| Param | Original file | Final file |
|---|---|---|
| Filename | modeM0/AS1T05_233T01_9000006438_49713cztM0_level2.fits | modeM0/AS1T05_233T01_9000006438_49713cztM0_level2_quad_clean.evt |
| Size (bytes) | 1,330,067,520 | 52,188,480 |
| Size | 1.2 GB | 49.8 MB |
| Events in quadrant A | 17,598,282 | 278,504 |
| Events in quadrant B | 4,728,305 | 703,171 |
| Events in quadrant C | 8,813,392 | 5,297 |
| Events in quadrant D | 17,558,595 | 99,972 |
| Mode SS | |||
|---|---|---|---|
| Quadrant | BADHDUFLAG | Total packets | Discarded packets |
| A | 0 | 140 | 0 |
| B | 0 | 140 | 0 |
| C | 0 | 140 | 0 |
| D | 0 | 140 | 0 |
| Mode M0 | |||
|---|---|---|---|
| Quadrant | BADHDUFLAG | Total packets | Discarded packets |
| A | 0 | 56985 | 0 |
| B | 0 | 18866 | 0 |
| C | 0 | 31107 | 0 |
| D | 0 | 56882 | 0 |
| Quadrant | Total seconds | Saturated seconds | Saturation percentage |
|---|---|---|---|
| A | 6929 | 6785 | 97.921778% |
| B | 6930 | 250 | 3.607504% |
| C | 6930 | 6930 | 100.000000% |
| D | 6929 | 6926 | 99.956704% |
Noise dominated data is calculated using 1-second bins in cleaned event files. If a bin has >2000 counts, and if more than 50% of those come from <1% of pixels, then it is considered to be noise-dominated and hence unusable.
| Quadrant | # 1 sec bins | Bins with >0 counts | Bins with >2000 counts | High rate bins dominated by noise | Noise dominated (total time) | Noise dominated (detector-on time) | Marked lightcurve |
|---|---|---|---|---|---|---|---|
| A | 6929 | 6929 | 6710 | 6710 | 96.84% | 96.84% | 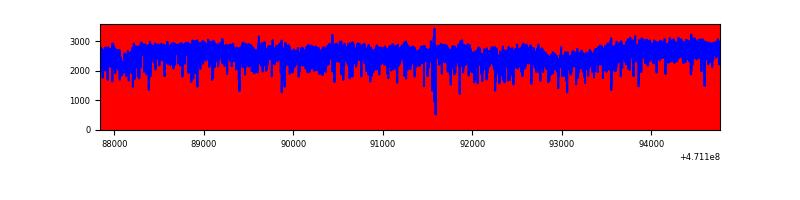 |
| B | 6930 | 6930 | 191 | 191 | 2.76% | 2.76% | 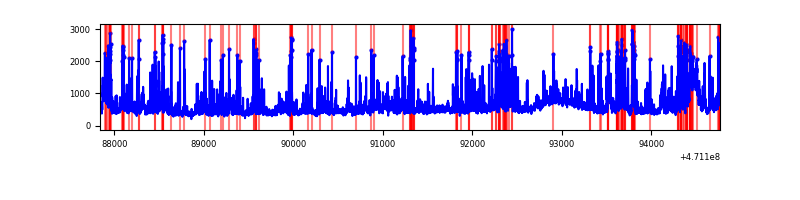 |
| C | 6930 | 6930 | 140 | 140 | 2.02% | 2.02% | 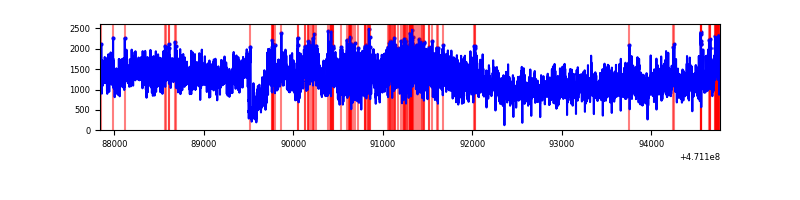 |
| D | 6929 | 6929 | 6596 | 6596 | 95.19% | 95.19% | 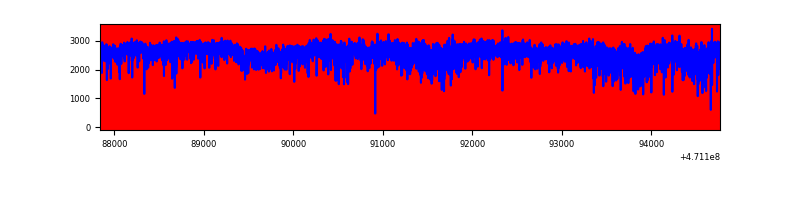 |
Top three noisy pixels from each quadrant. If the there are fewer than three noisy pixels in the level2.evt file, extra rows are filled as -1
| Pixel properties | Quadrant properties | ||||||
|---|---|---|---|---|---|---|---|
| Quadrant | DetID | PixID | Counts | Sigma | Mean | Median | Sigma |
| A | 10 | 83 | 5071792 | 52728.27 | 341 | 330 | 96.2 |
| A | 0 | 98 | 2345086 | 24378.56 | 341 | 330 | 96.2 |
| A | 3 | 130 | 2176923 | 22630.16 | 341 | 330 | 96.2 |
| B | 10 | 251 | 513050 | 3246.28 | 743 | 718 | 157.8 |
| B | 5 | 172 | 202850 | 1280.76 | 743 | 718 | 157.8 |
| B | 3 | 22 | 197739 | 1248.38 | 743 | 718 | 157.8 |
| C | 15 | 190 | 2253130 | 116686.87 | 28 | 26 | 19.3 |
| C | 15 | 180 | 1151074 | 59612.07 | 28 | 26 | 19.3 |
| C | 0 | 161 | 960023 | 49717.66 | 28 | 26 | 19.3 |
| D | 15 | 122 | 7031505 | 83022.56 | 148 | 135 | 84.7 |
| D | 15 | 40 | 2821217 | 33309.79 | 148 | 135 | 84.7 |
| D | 15 | 168 | 1123291 | 13261.61 | 148 | 135 | 84.7 |
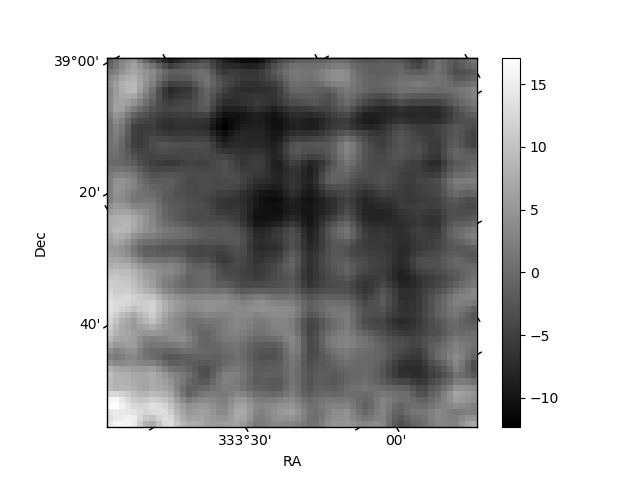
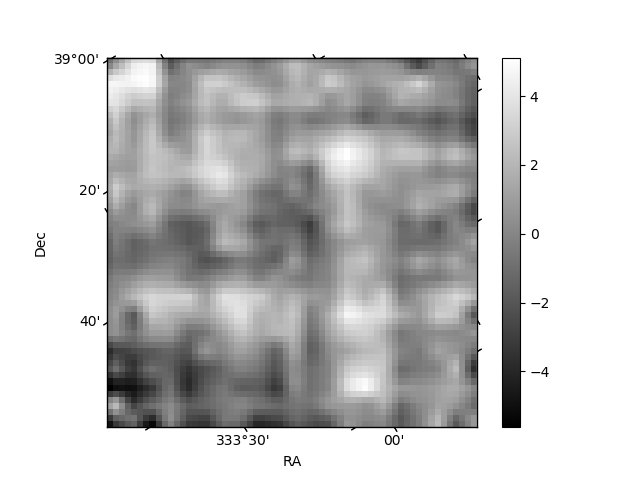
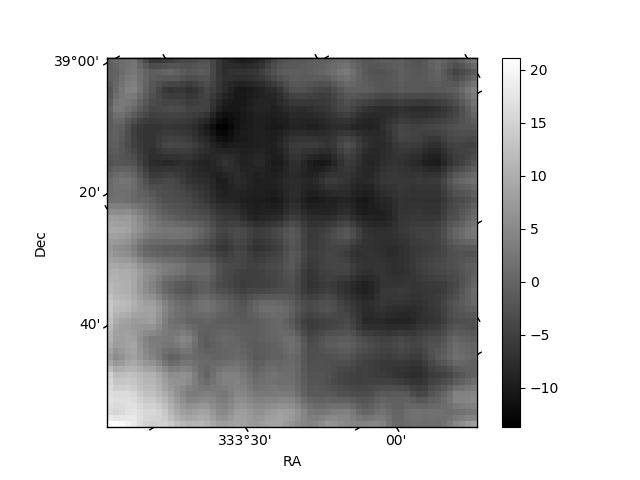
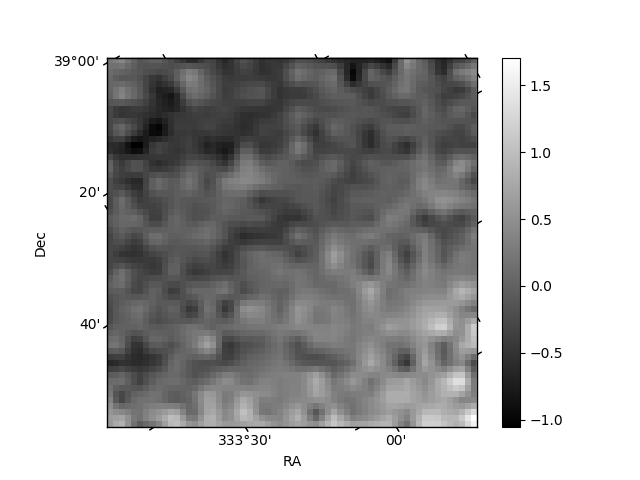
Histogram calculated using DETX and DETY for each event in the final _common_clean file
| Quadrant A | 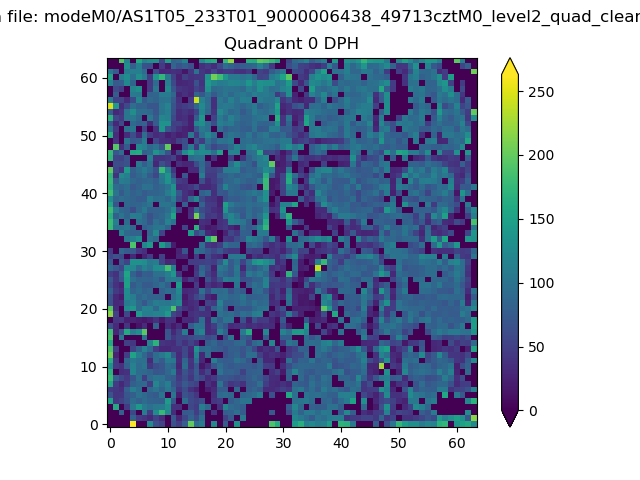 |
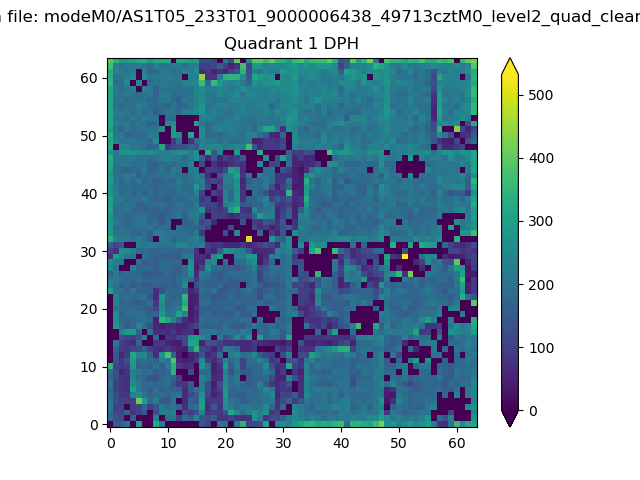 |
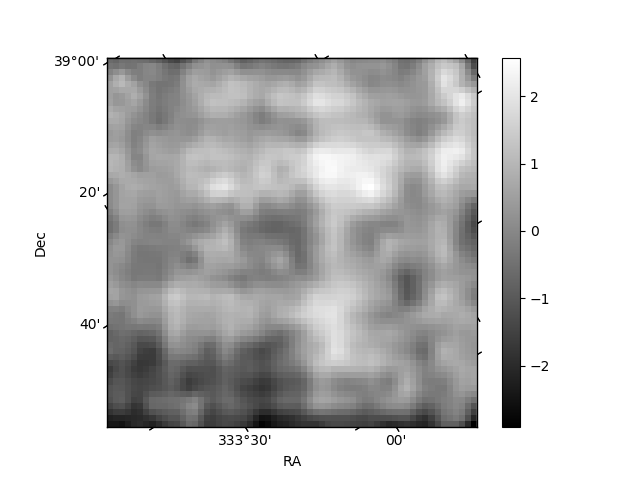
Quadrant B |
|---|---|---|---|
| Quadrant D | 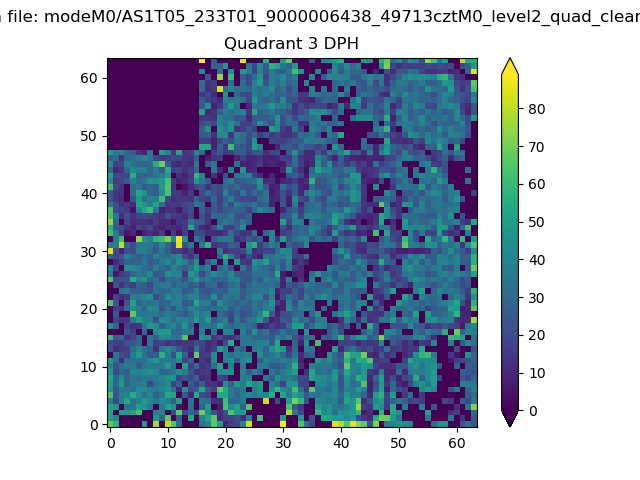 |
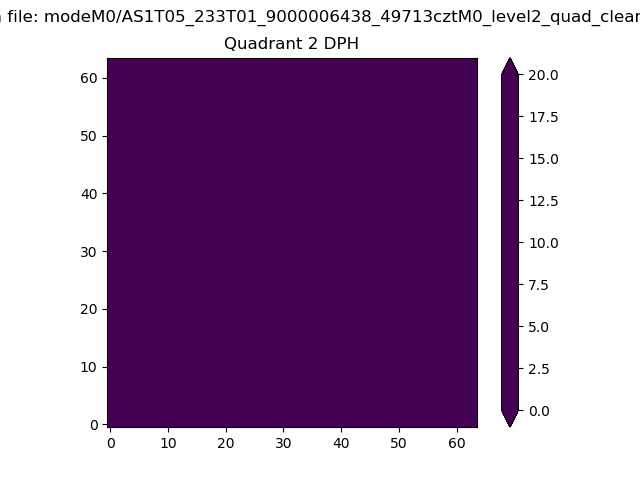 |
Quadrant C |
| Plot type | Count rate plots | Images |
|---|---|---|
| Comparison with Poisson distribution Blue bars denote a histogram of data divided into 1 sec bins. Red curve is a Poisson curve with rate = median count rate of data. |
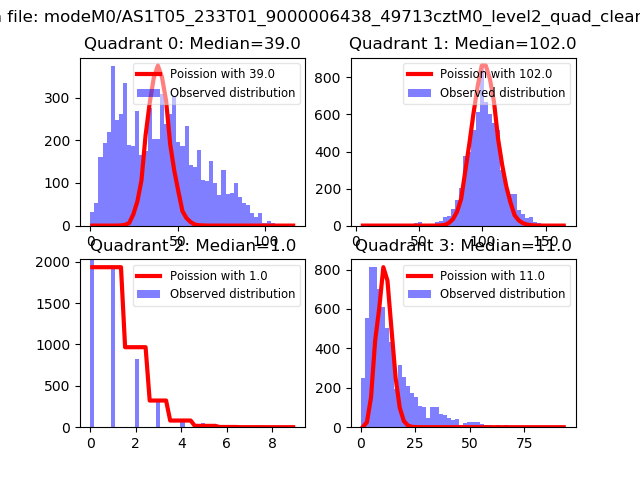 |
 |
| Quadrant-wise count rates Data is divided into 100 sec bins |
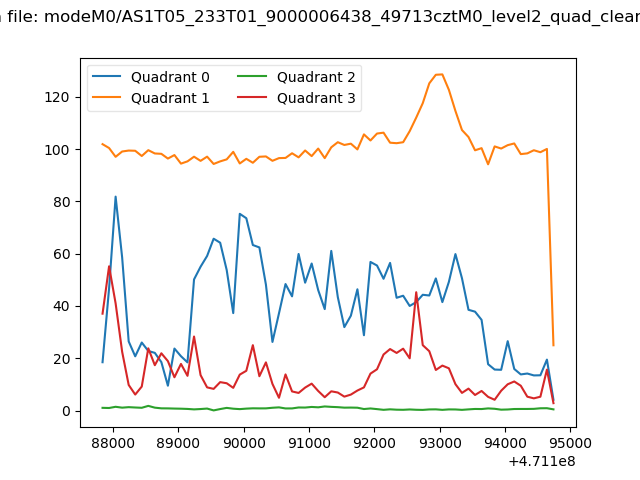 |
|
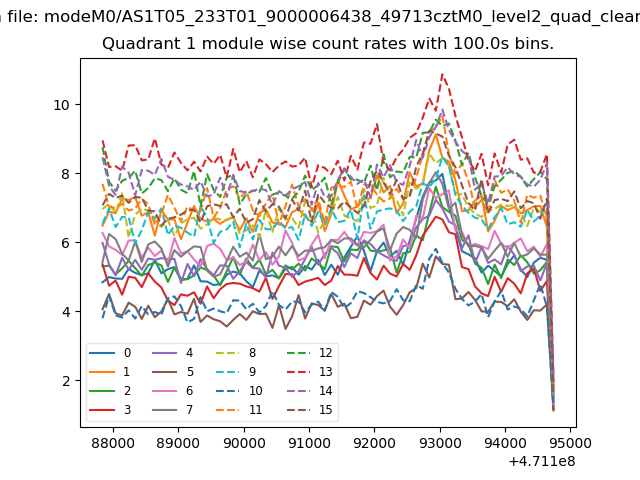
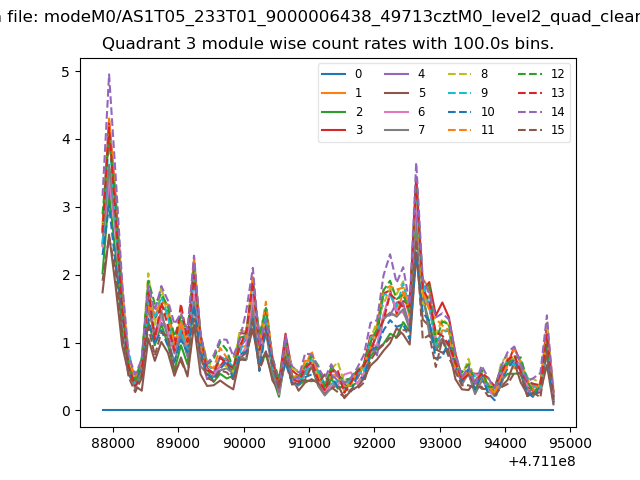
| Module-wise count rates for Quadrant A Data is divided into 100 sec bins |
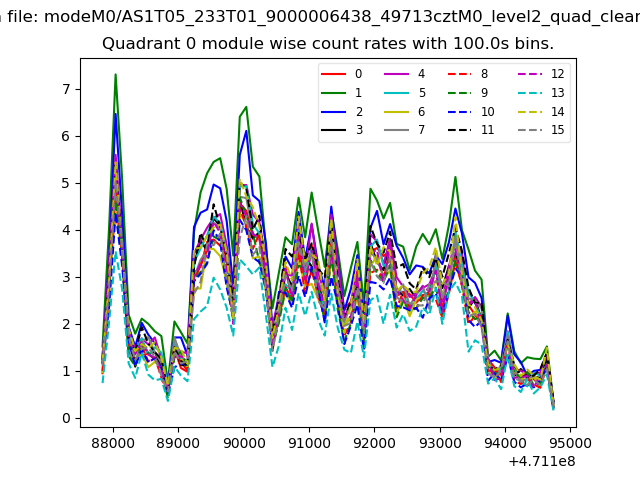 |
 |
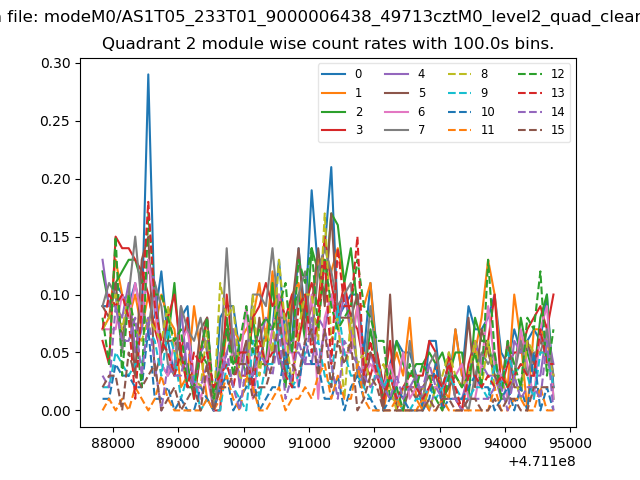
| Module-wise count rates for Quadrant B Data is divided into 100 sec bins |
 |
 |
| Module-wise count rates for Quadrant C Data is divided into 100 sec bins |
 |
 |
| Module-wise count rates for Quadrant D Data is divided into 100 sec bins |
 |
 |
| Parameter | Plot |
|---|---|
| CZT HV Monitor | 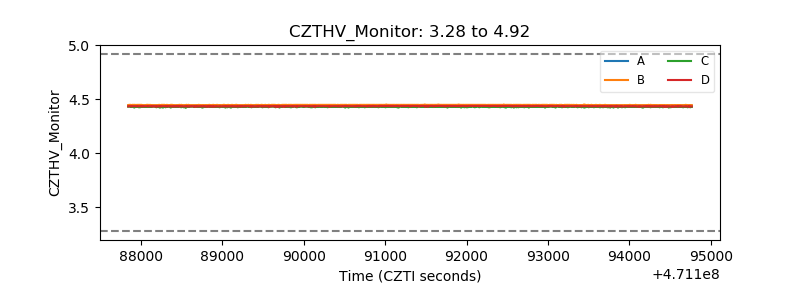 |
| D_VDD | 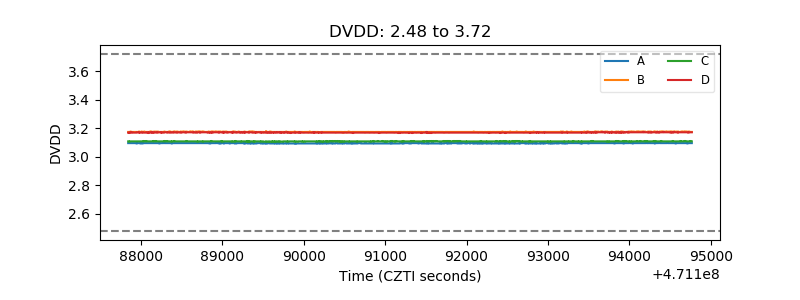 |
| Temperature 1 | 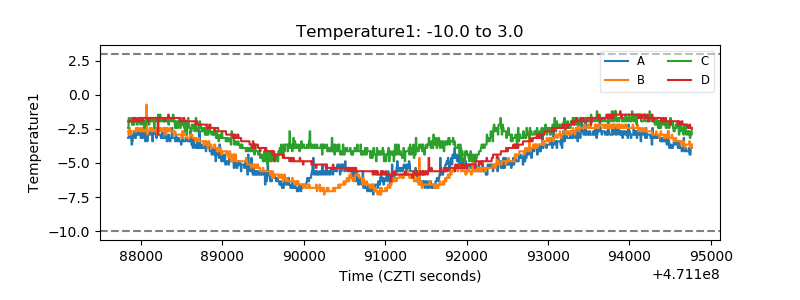 |
| Veto HV Monitor |  |
| Veto LLD | 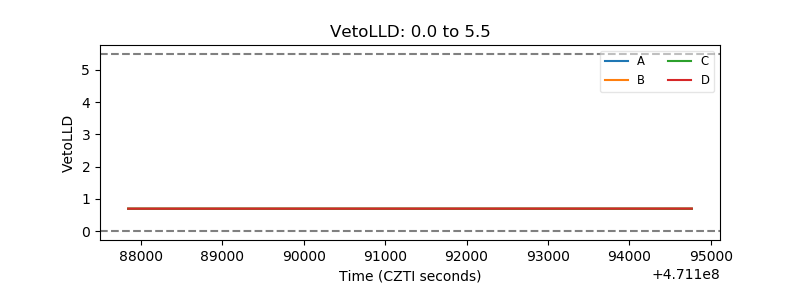 |
| Alpha Counter | 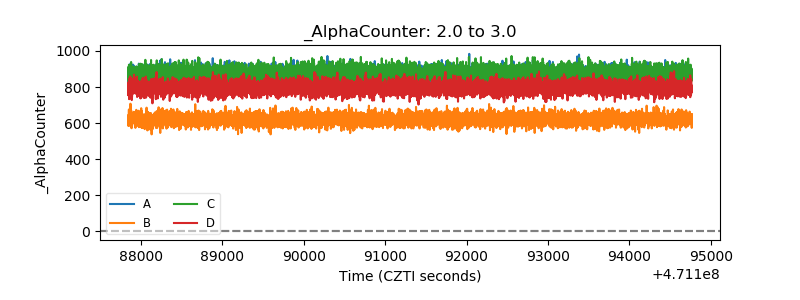 |
| _CPM_Rate | 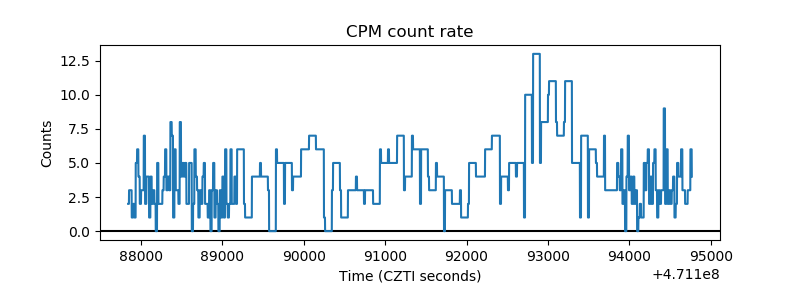 |
| CZT Counter | 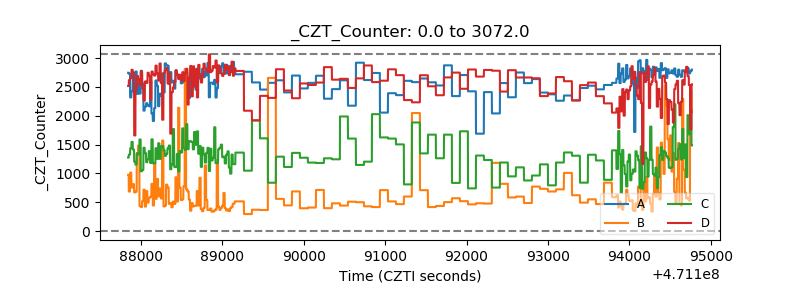 |
| +2.5 Volts monitor |  |
| +5 Volts monitor | 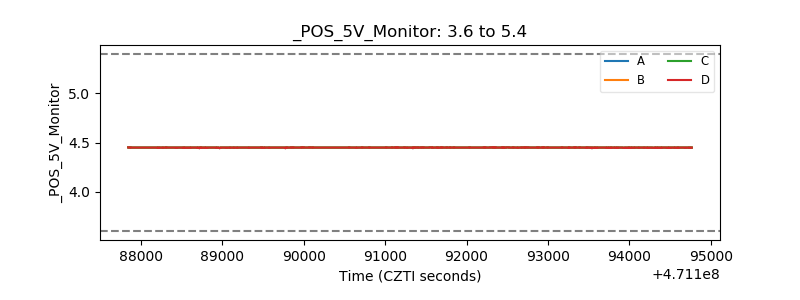 |
| _ROLL_ROT | 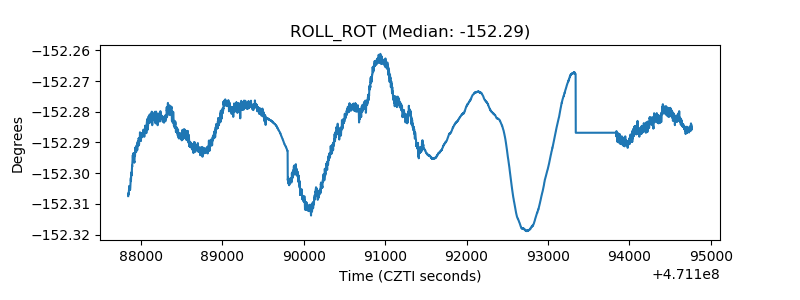 |
| _Roll_DEC |  |
| _Roll_RA | 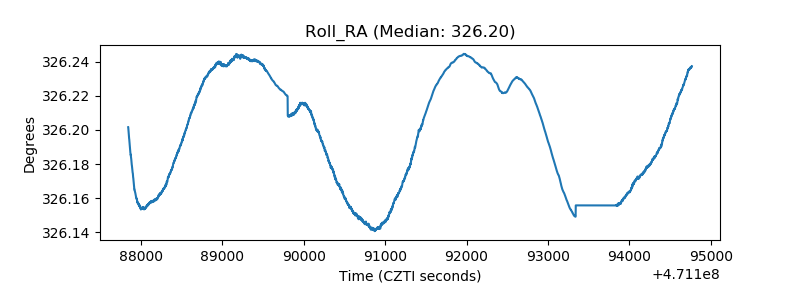 |
| Veto Counter | 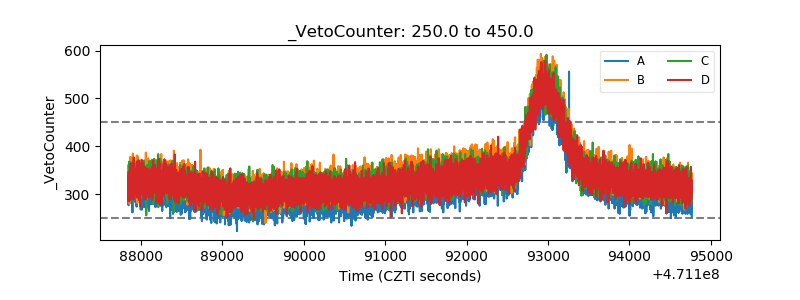 |