| Param | Original file | Final file |
|---|---|---|
| Filename | modeM0/AS1T05_233T01_9000006438_49715cztM0_level2.fits | modeM0/AS1T05_233T01_9000006438_49715cztM0_level2_quad_clean.evt |
| Size (bytes) | 1,227,542,400 | 49,325,760 |
| Size | 1.1 GB | 47.0 MB |
| Events in quadrant A | 20,043,025 | 174,430 |
| Events in quadrant B | 5,028,094 | 752,486 |
| Events in quadrant C | 5,337,169 | 4,209 |
| Events in quadrant D | 14,444,413 | 27,381 |
| Mode SS | |||
|---|---|---|---|
| Quadrant | BADHDUFLAG | Total packets | Discarded packets |
| A | 0 | 150 | 0 |
| B | 0 | 150 | 0 |
| C | 0 | 150 | 0 |
| D | 0 | 150 | 0 |
| Mode M0 | |||
|---|---|---|---|
| Quadrant | BADHDUFLAG | Total packets | Discarded packets |
| A | 0 | 64870 | 0 |
| B | 0 | 20036 | 0 |
| C | 0 | 21263 | 0 |
| D | 0 | 48077 | 0 |
| Quadrant | Total seconds | Saturated seconds | Saturation percentage |
|---|---|---|---|
| A | 7531 | 7531 | 100.000000% |
| B | 7531 | 259 | 3.439118% |
| C | 7531 | 7531 | 100.000000% |
| D | 7531 | 7531 | 100.000000% |
Noise dominated data is calculated using 1-second bins in cleaned event files. If a bin has >2000 counts, and if more than 50% of those come from <1% of pixels, then it is considered to be noise-dominated and hence unusable.
| Quadrant | # 1 sec bins | Bins with >0 counts | Bins with >2000 counts | High rate bins dominated by noise | Noise dominated (total time) | Noise dominated (detector-on time) | Marked lightcurve |
|---|---|---|---|---|---|---|---|
| A | 7531 | 7531 | 7400 | 7400 | 98.26% | 98.26% | 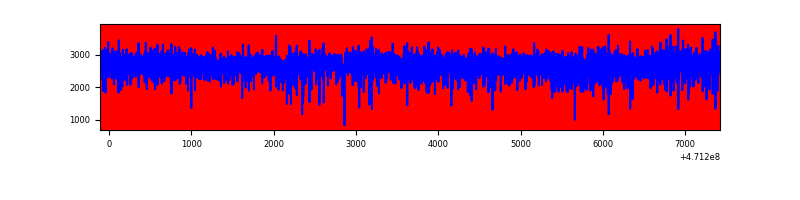 |
| B | 7531 | 7531 | 174 | 174 | 2.31% | 2.31% | 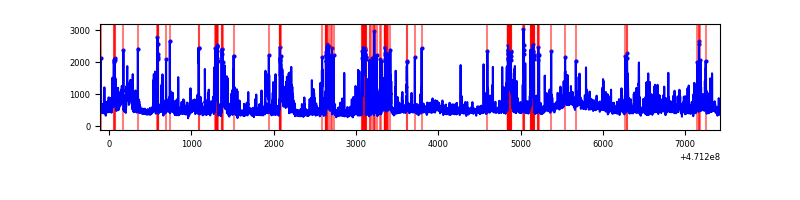 |
| C | 7530 | 7530 | 1 | 1 | 0.01% | 0.01% | 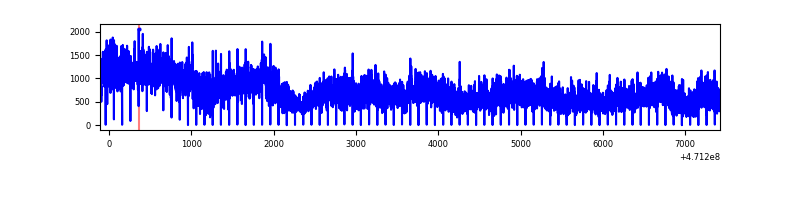 |
| D | 7530 | 7530 | 3495 | 3495 | 46.41% | 46.41% | 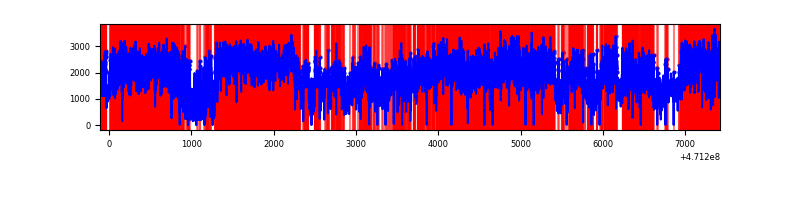 |
Top three noisy pixels from each quadrant. If the there are fewer than three noisy pixels in the level2.evt file, extra rows are filled as -1
| Pixel properties | Quadrant properties | ||||||
|---|---|---|---|---|---|---|---|
| Quadrant | DetID | PixID | Counts | Sigma | Mean | Median | Sigma |
| A | 10 | 83 | 5412701 | 72539.92 | 218 | 209 | 74.6 |
| A | 0 | 99 | 4815911 | 64541.56 | 218 | 209 | 74.6 |
| A | 0 | 98 | 2473729 | 33150.89 | 218 | 209 | 74.6 |
| B | 3 | 232 | 631002 | 3743.44 | 786 | 761 | 168.4 |
| B | 9 | 218 | 209401 | 1239.26 | 786 | 761 | 168.4 |
| B | 7 | 252 | 137298 | 810.99 | 786 | 761 | 168.4 |
| C | 15 | 190 | 973070 | 85396.44 | 11 | 10 | 11.4 |
| C | 15 | 181 | 717292 | 62949.18 | 11 | 10 | 11.4 |
| C | 15 | 180 | 637519 | 55948.24 | 11 | 10 | 11.4 |
| D | 15 | 122 | 4230081 | 107949.26 | 56 | 50 | 39.2 |
| D | 7 | 61 | 2661747 | 67925.8 | 56 | 50 | 39.2 |
| D | 15 | 184 | 1553747 | 39649.93 | 56 | 50 | 39.2 |
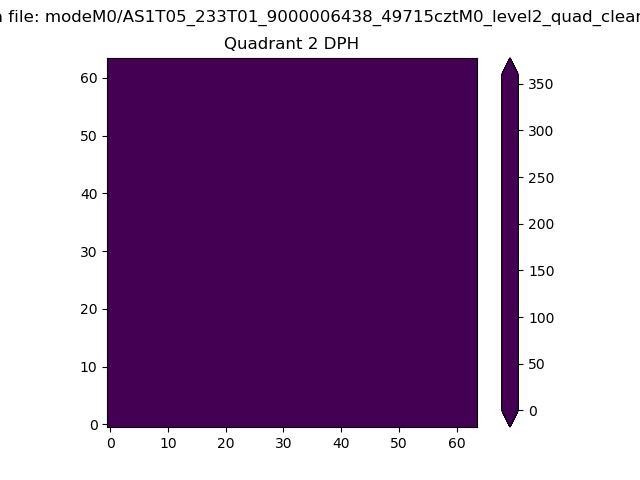
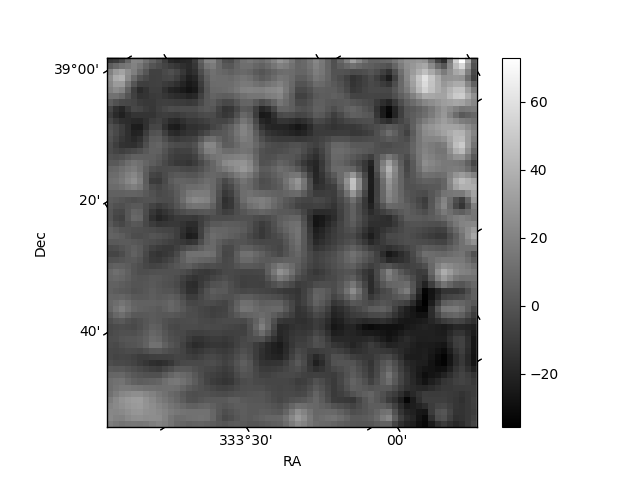
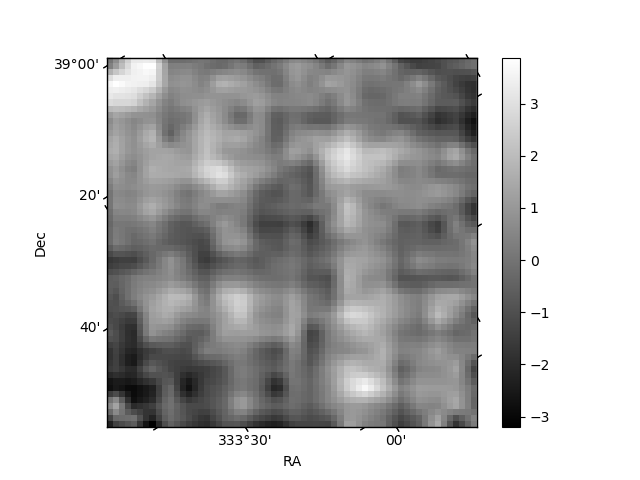
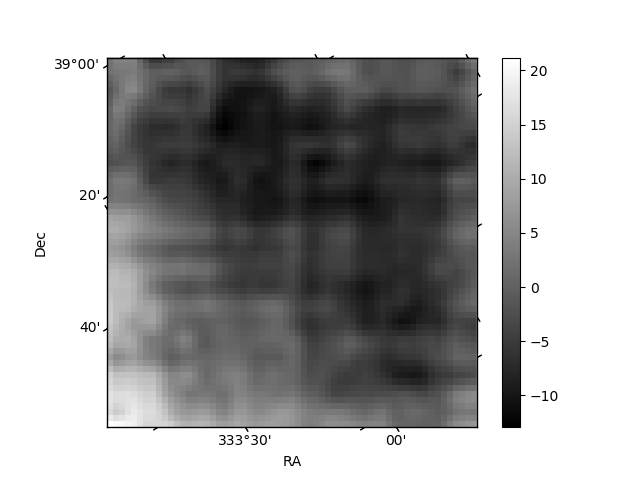
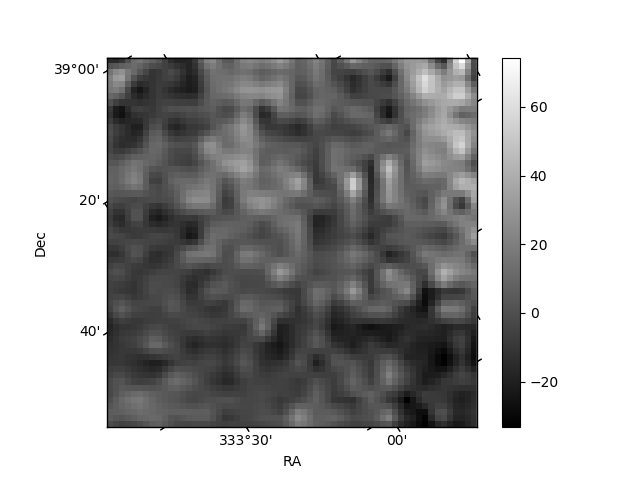
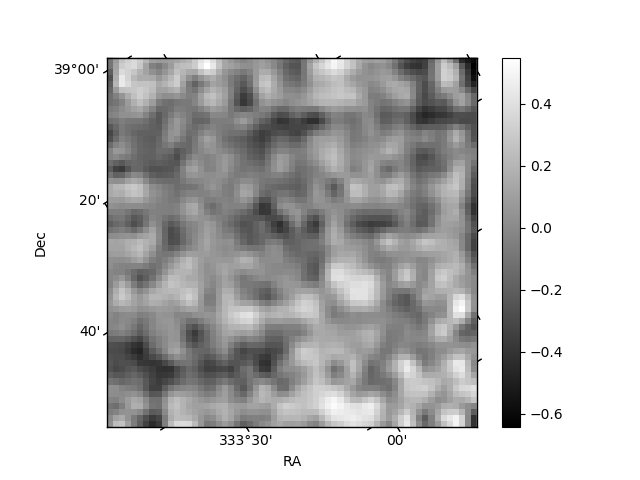
Histogram calculated using DETX and DETY for each event in the final _common_clean file
| Quadrant A | 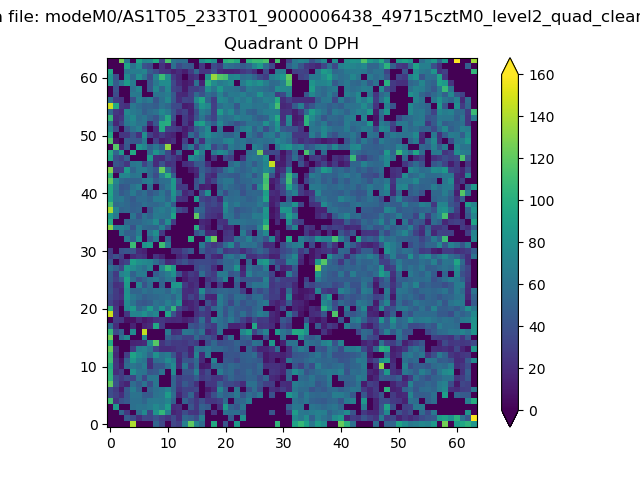 |
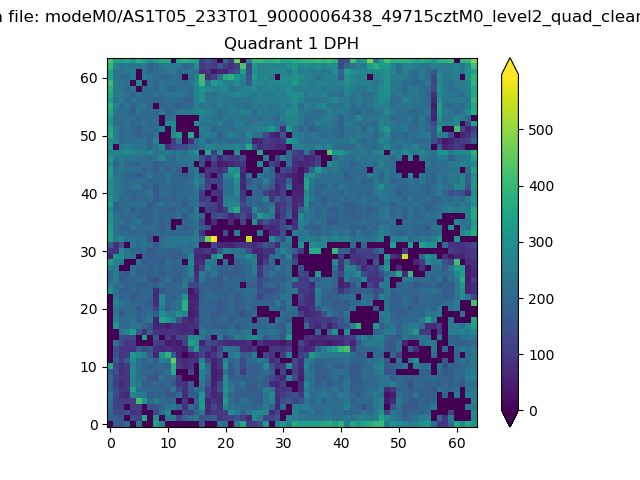 |
Quadrant B |
|---|---|---|---|
| Quadrant D | 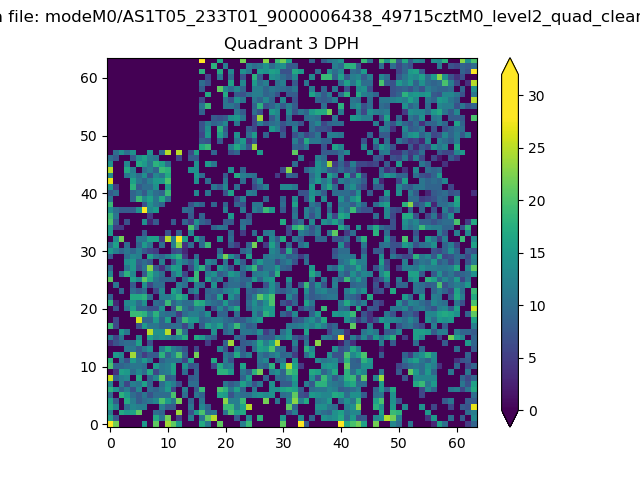 |
 |
Quadrant C |
| Plot type | Count rate plots | Images |
|---|---|---|
| Comparison with Poisson distribution Blue bars denote a histogram of data divided into 1 sec bins. Red curve is a Poisson curve with rate = median count rate of data. |
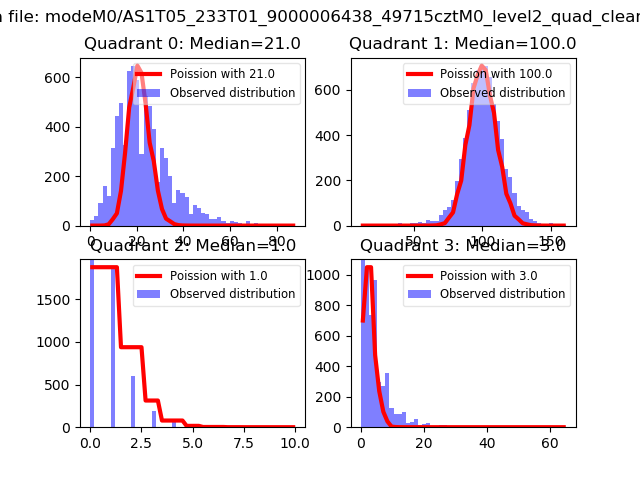 |
 |
| Quadrant-wise count rates Data is divided into 100 sec bins |
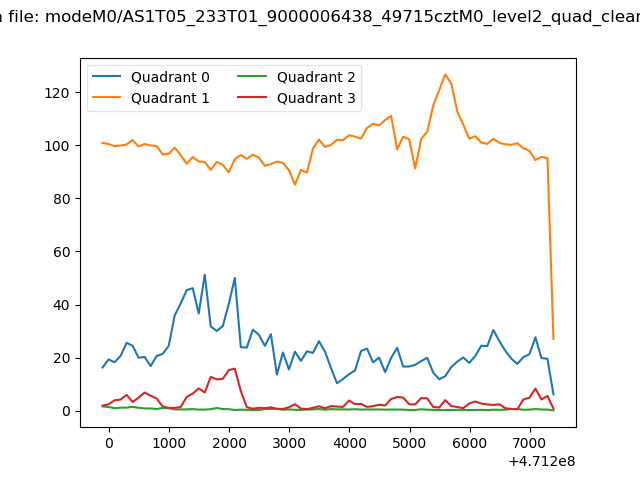 |
|
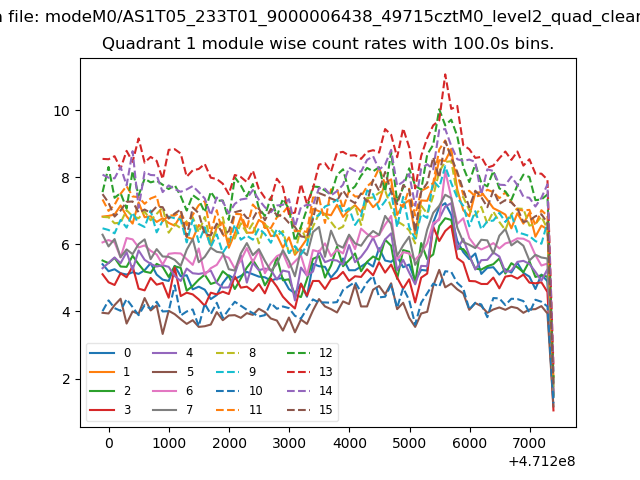
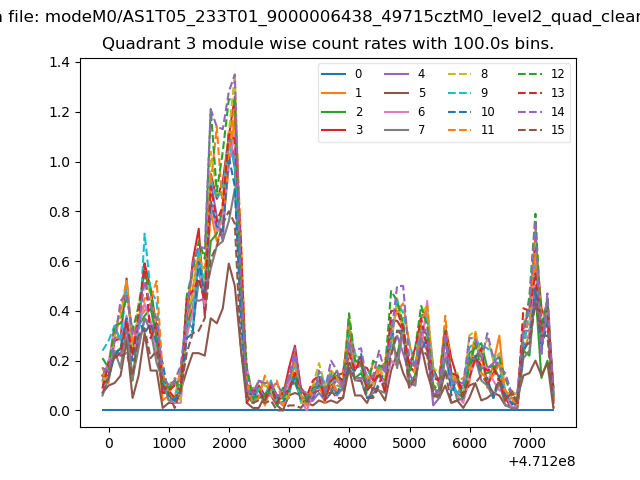
| Module-wise count rates for Quadrant A Data is divided into 100 sec bins |
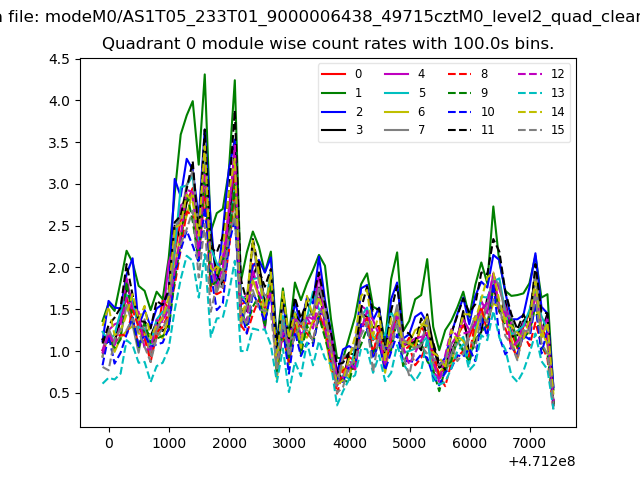 |
 |
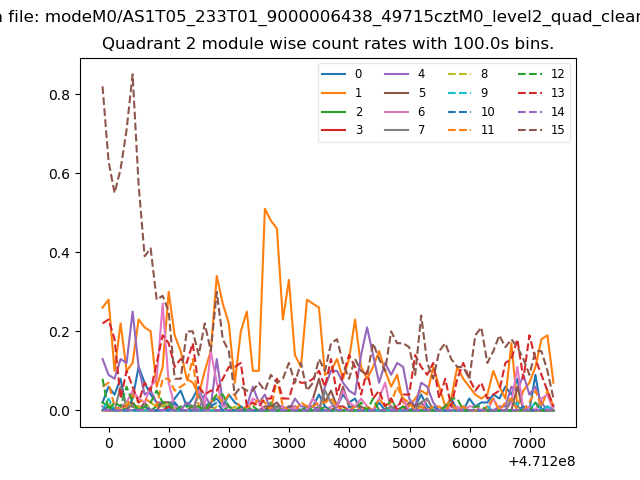
| Module-wise count rates for Quadrant B Data is divided into 100 sec bins |
 |
 |
| Module-wise count rates for Quadrant C Data is divided into 100 sec bins |
 |
 |
| Module-wise count rates for Quadrant D Data is divided into 100 sec bins |
 |
 |
| Parameter | Plot |
|---|---|
| CZT HV Monitor | 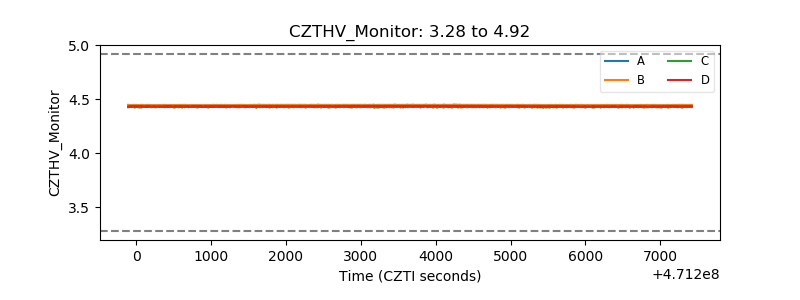 |
| D_VDD | 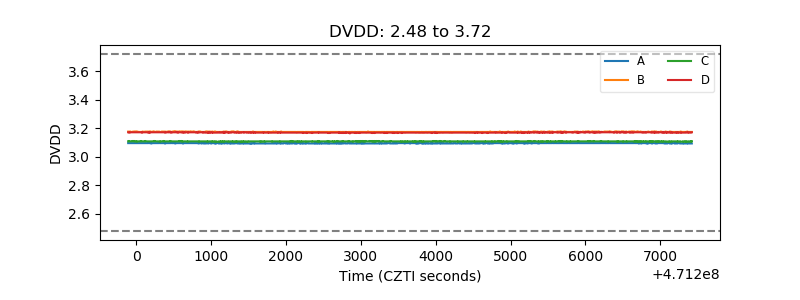 |
| Temperature 1 | 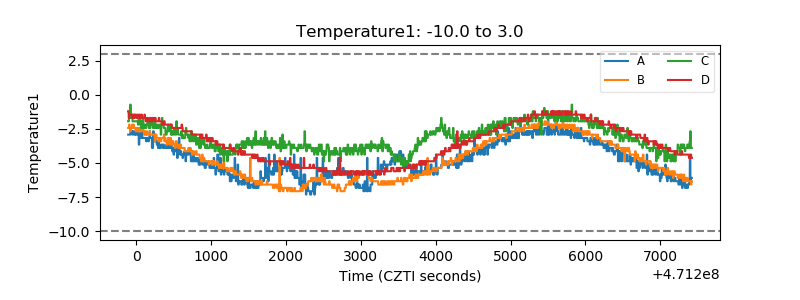 |
| Veto HV Monitor | 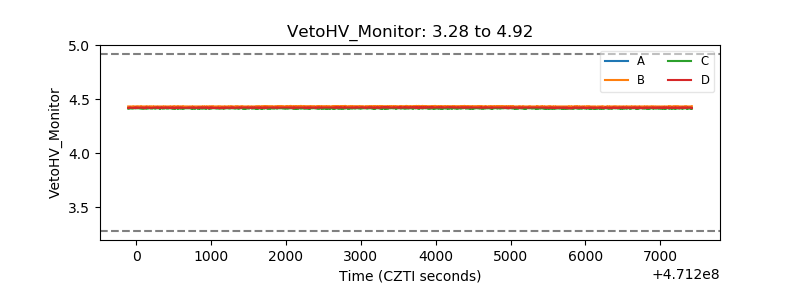 |
| Veto LLD | 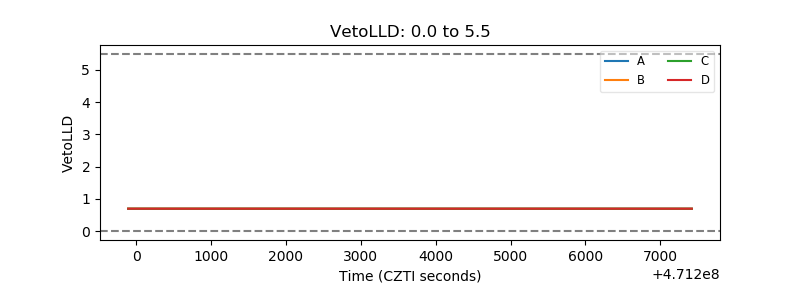 |
| Alpha Counter | 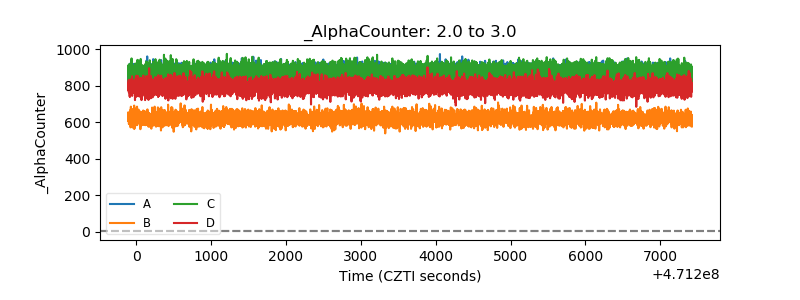 |
| _CPM_Rate | 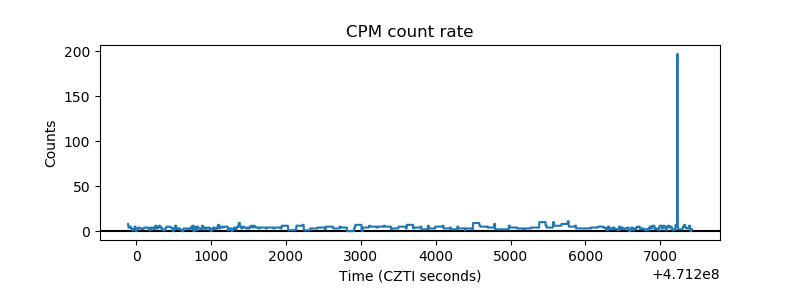 |
| CZT Counter | 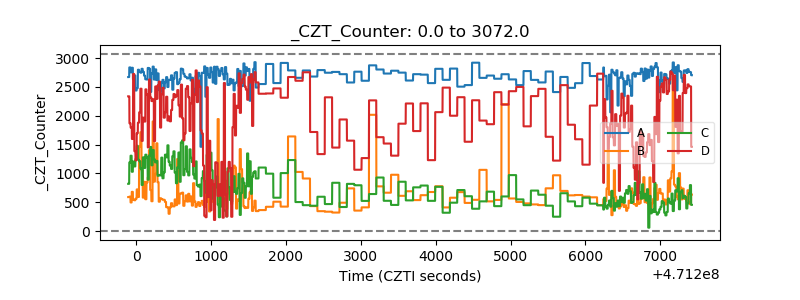 |
| +2.5 Volts monitor | 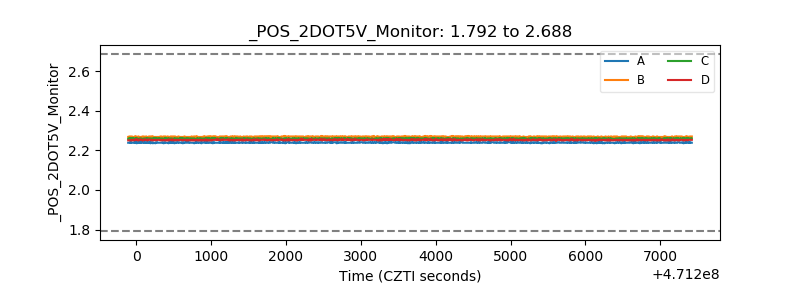 |
| +5 Volts monitor | 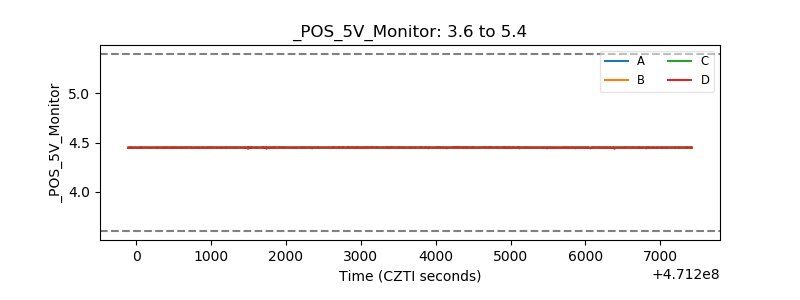 |
| _ROLL_ROT | 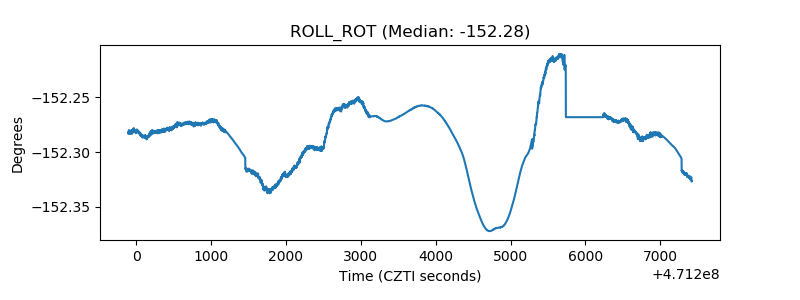 |
| _Roll_DEC | 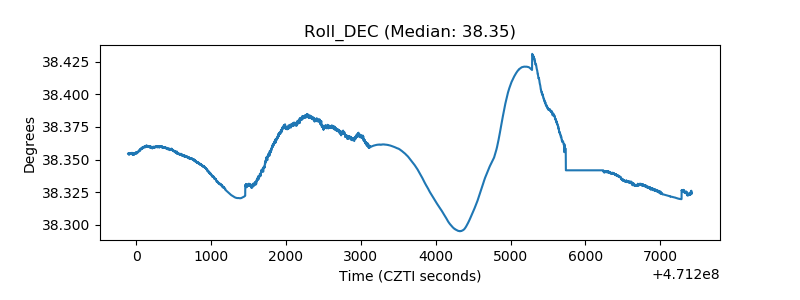 |
| _Roll_RA | 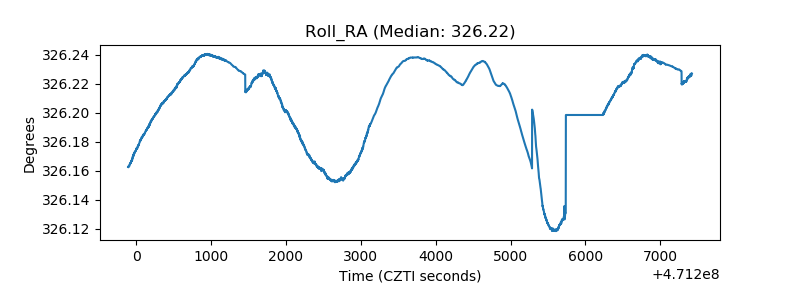 |
| Veto Counter | 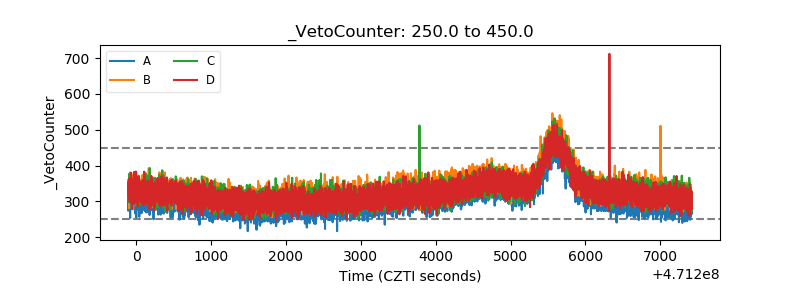 |