| Param | Original file | Final file |
|---|---|---|
| Filename | modeM0/AS1T05_233T01_9000006438_49719cztM0_level2.fits | modeM0/AS1T05_233T01_9000006438_49719cztM0_level2_quad_clean.evt |
| Size (bytes) | 1,180,526,400 | 39,510,720 |
| Size | 1.1 GB | 37.7 MB |
| Events in quadrant A | 15,292,105 | 83,512 |
| Events in quadrant B | 3,669,876 | 638,467 |
| Events in quadrant C | 8,408,327 | 165 |
| Events in quadrant D | 15,830,892 | 25,539 |
| Mode M9 | |||
|---|---|---|---|
| Quadrant | BADHDUFLAG | Total packets | Discarded packets |
| A | 0 | 9 | 0 |
| B | 0 | 9 | 0 |
| C | 0 | 9 | 0 |
| D | 0 | 9 | 0 |
| Mode SS | |||
|---|---|---|---|
| Quadrant | BADHDUFLAG | Total packets | Discarded packets |
| A | 0 | 132 | 0 |
| B | 0 | 132 | 0 |
| C | 0 | 132 | 0 |
| D | 0 | 132 | 0 |
| Mode M0 | |||
|---|---|---|---|
| Quadrant | BADHDUFLAG | Total packets | Discarded packets |
| A | 0 | 49691 | 3 |
| B | 0 | 15426 | 1 |
| C | 0 | 29518 | 1 |
| D | 0 | 51484 | 1 |
| Quadrant | Total seconds | Saturated seconds | Saturation percentage |
|---|---|---|---|
| A | 6422 | 5797 | 90.267829% |
| B | 6422 | 141 | 2.195578% |
| C | 6423 | 6422 | 99.984431% |
| D | 6423 | 6188 | 96.341274% |
Noise dominated data is calculated using 1-second bins in cleaned event files. If a bin has >2000 counts, and if more than 50% of those come from <1% of pixels, then it is considered to be noise-dominated and hence unusable.
| Quadrant | # 1 sec bins | Bins with >0 counts | Bins with >2000 counts | High rate bins dominated by noise | Noise dominated (total time) | Noise dominated (detector-on time) | Marked lightcurve |
|---|---|---|---|---|---|---|---|
| A | 7347 | 6423 | 5916 | 5916 | 80.52% | 92.11% | 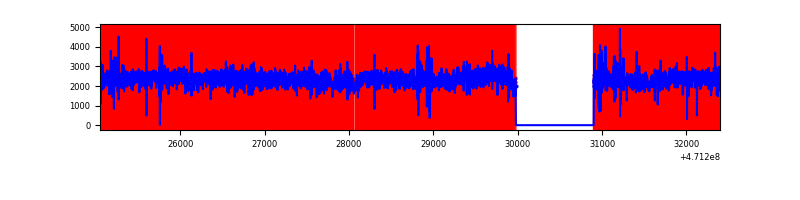 |
| B | 7347 | 6423 | 62 | 62 | 0.84% | 0.97% | 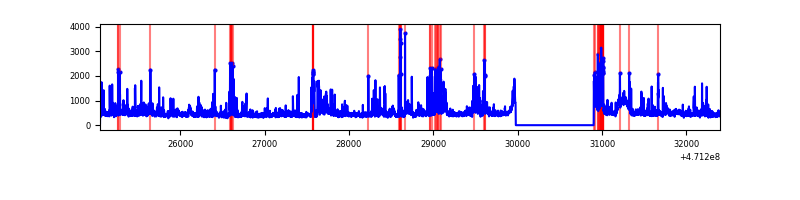 |
| C | 7347 | 6422 | 664 | 664 | 9.04% | 10.34% | 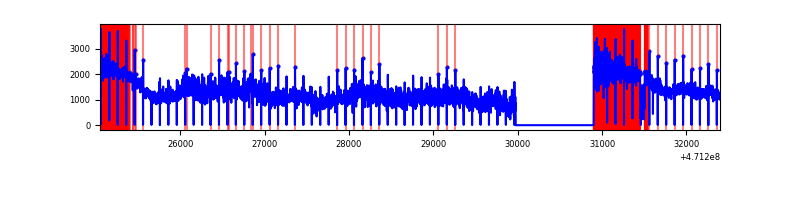 |
| D | 7348 | 6423 | 5276 | 5276 | 71.80% | 82.14% | 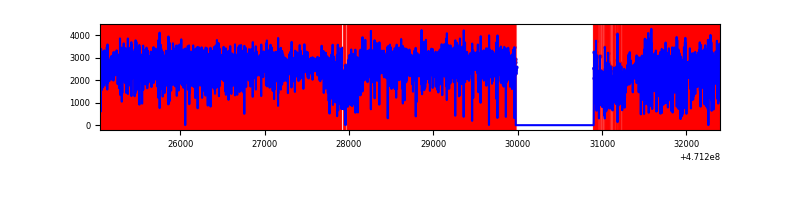 |
Top three noisy pixels from each quadrant. If the there are fewer than three noisy pixels in the level2.evt file, extra rows are filled as -1
| Pixel properties | Quadrant properties | ||||||
|---|---|---|---|---|---|---|---|
| Quadrant | DetID | PixID | Counts | Sigma | Mean | Median | Sigma |
| A | 10 | 83 | 7311014 | 53509.64 | 490 | 475 | 136.6 |
| A | 12 | 50 | 2143515 | 15686.02 | 490 | 475 | 136.6 |
| A | 4 | 205 | 730279 | 5341.82 | 490 | 475 | 136.6 |
| B | 10 | 128 | 157045 | 1110.01 | 674 | 654 | 140.9 |
| B | 5 | 49 | 155384 | 1098.22 | 674 | 654 | 140.9 |
| B | 3 | 233 | 148219 | 1047.37 | 674 | 654 | 140.9 |
| C | 15 | 180 | 2675028 | 136289.34 | 38 | 37 | 19.6 |
| C | 15 | 190 | 2637484 | 134376.5 | 38 | 37 | 19.6 |
| C | 15 | 163 | 544478 | 27738.97 | 38 | 37 | 19.6 |
| D | 15 | 40 | 4305340 | 50735.12 | 221 | 210 | 84.9 |
| D | 7 | 61 | 3256472 | 38374.42 | 221 | 210 | 84.9 |
| D | 15 | 122 | 1789396 | 21085.21 | 221 | 210 | 84.9 |
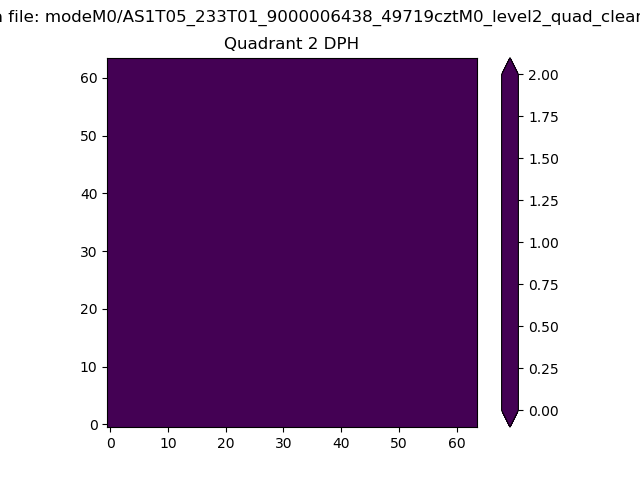
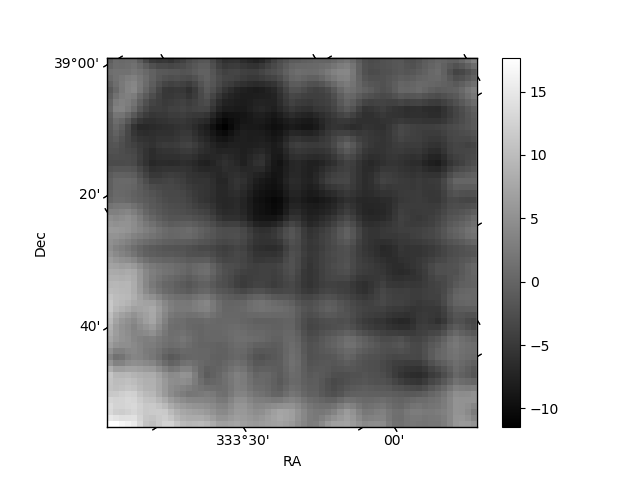
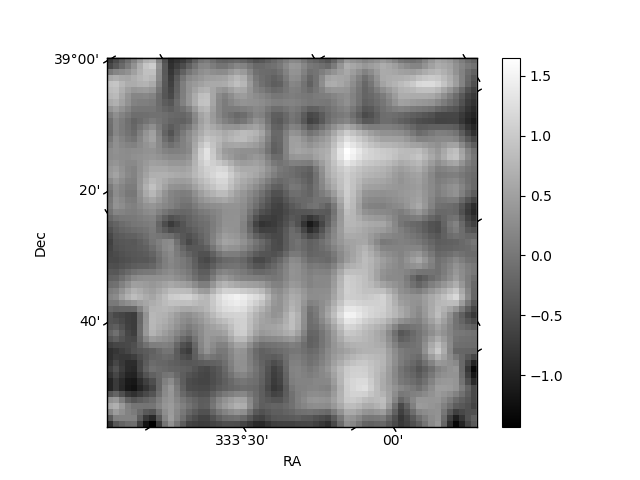
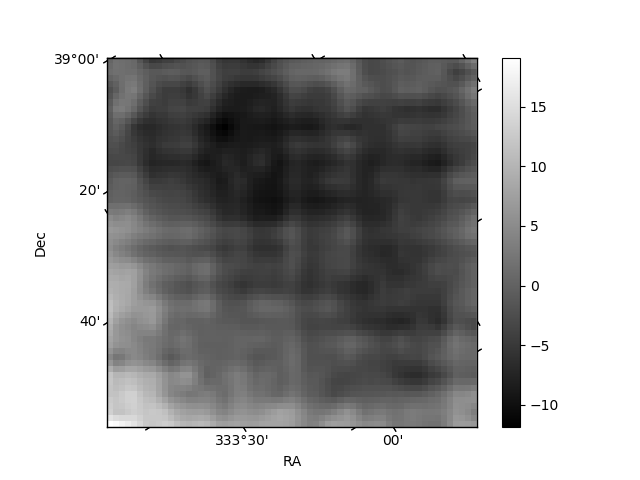
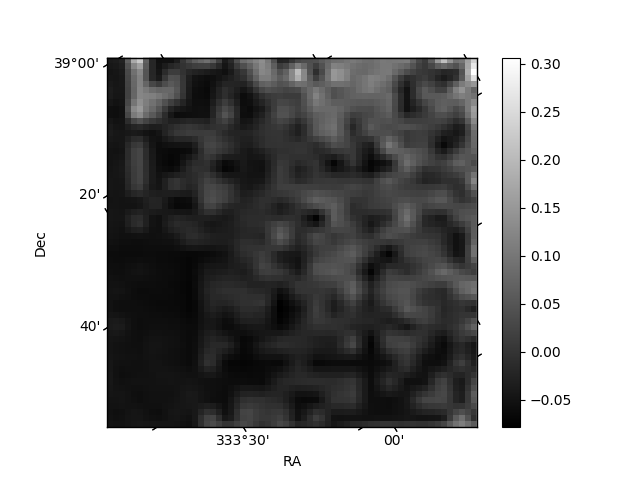
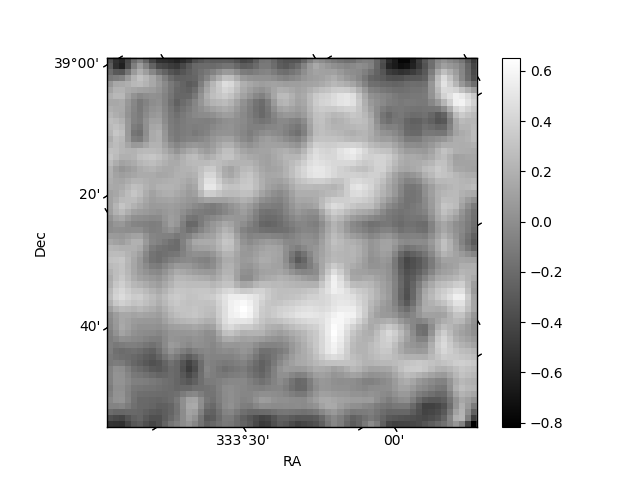
Histogram calculated using DETX and DETY for each event in the final _common_clean file
| Quadrant A | 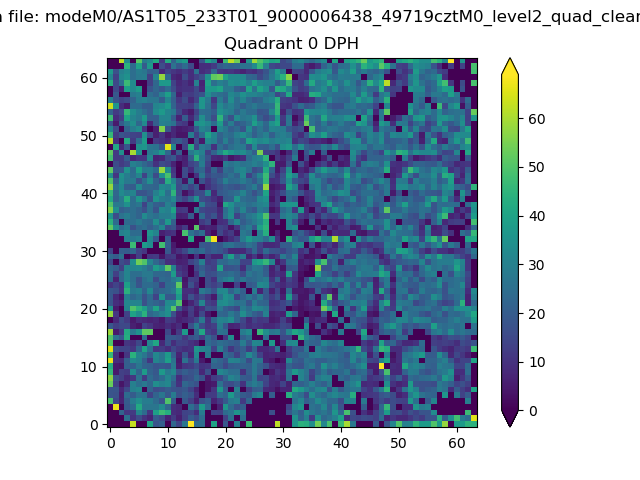 |
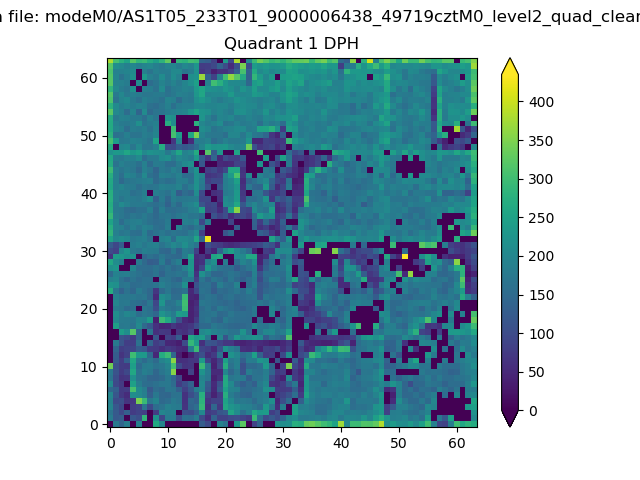 |
Quadrant B |
|---|---|---|---|
| Quadrant D | 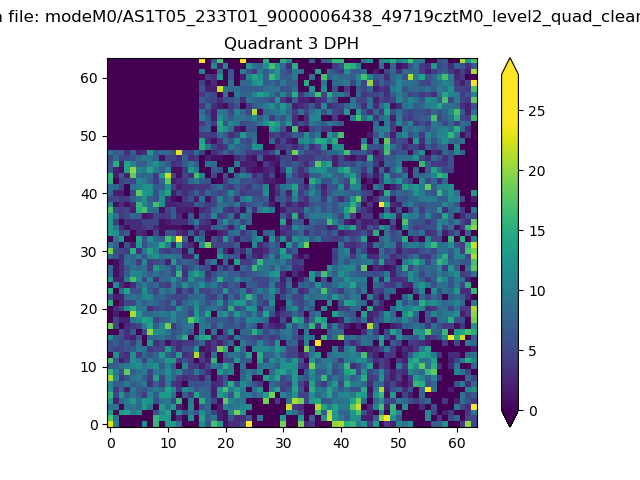 |
 |
Quadrant C |
| Plot type | Count rate plots | Images |
|---|---|---|
| Comparison with Poisson distribution Blue bars denote a histogram of data divided into 1 sec bins. Red curve is a Poisson curve with rate = median count rate of data. |
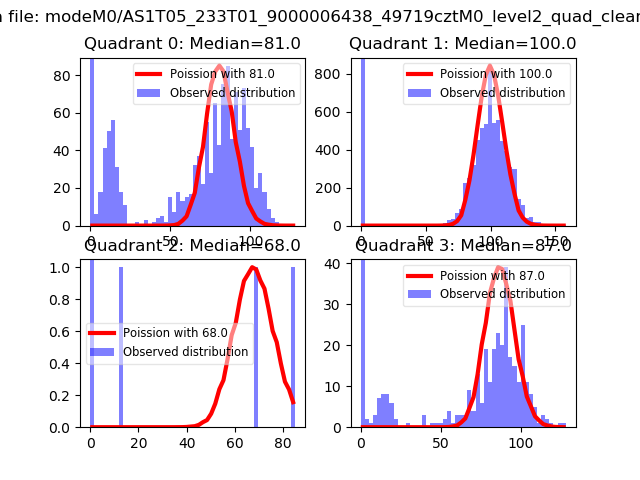 |
 |
| Quadrant-wise count rates Data is divided into 100 sec bins |
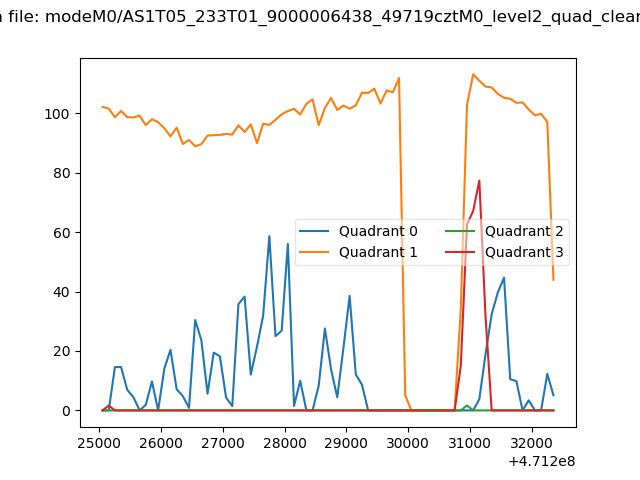 |
|
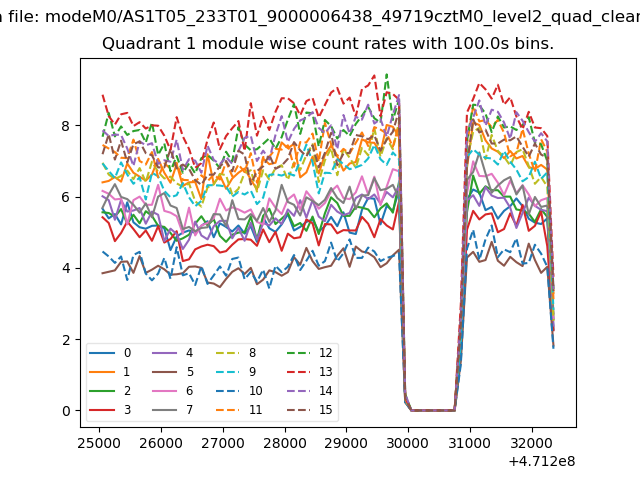
| Module-wise count rates for Quadrant A Data is divided into 100 sec bins |
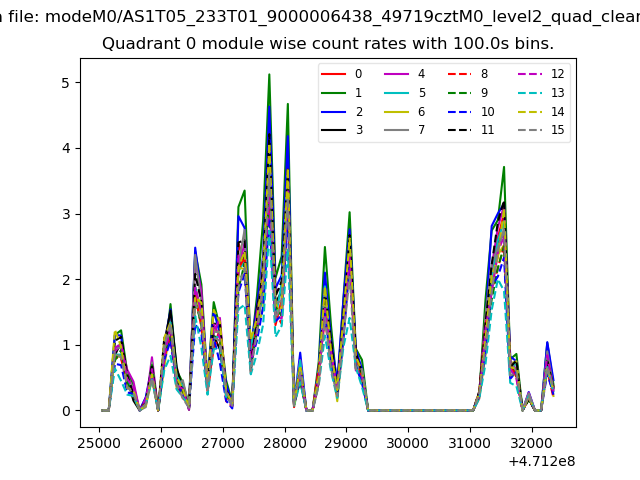 |
 |
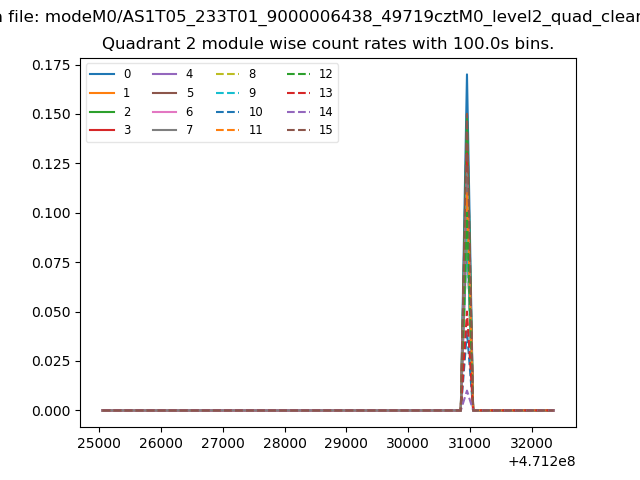
| Module-wise count rates for Quadrant B Data is divided into 100 sec bins |
 |
 |
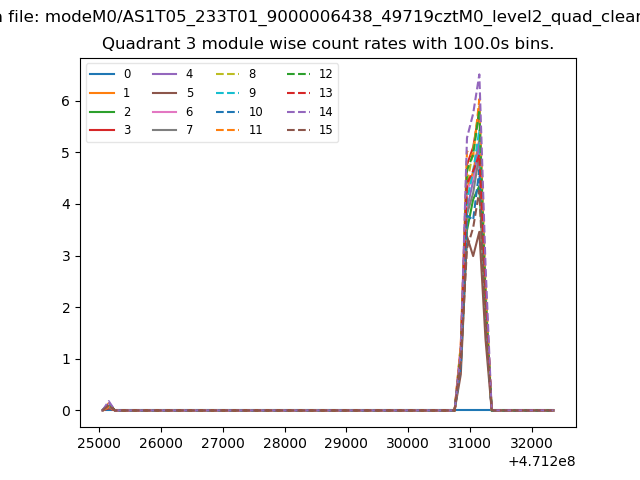
| Module-wise count rates for Quadrant C Data is divided into 100 sec bins |
 |
 |
| Module-wise count rates for Quadrant D Data is divided into 100 sec bins |
 |
 |
| Parameter | Plot |
|---|---|
| CZT HV Monitor | 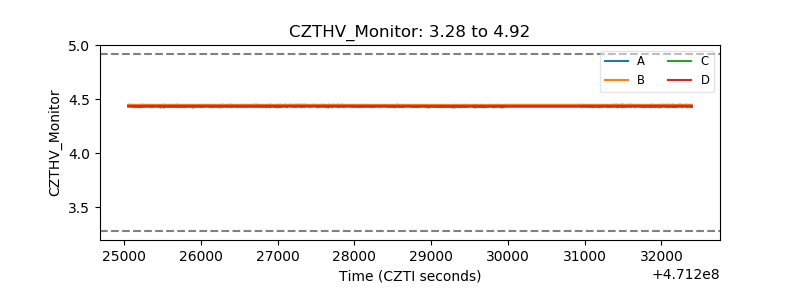 |
| D_VDD | 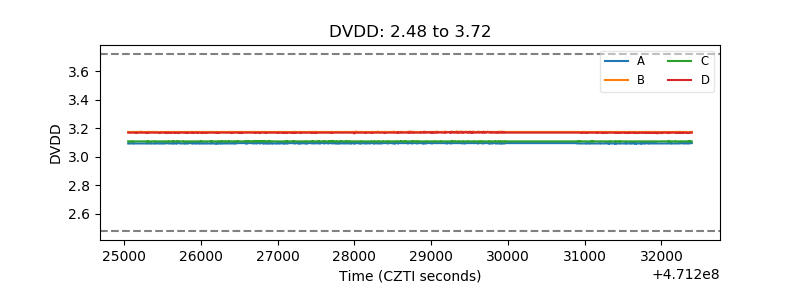 |
| Temperature 1 | 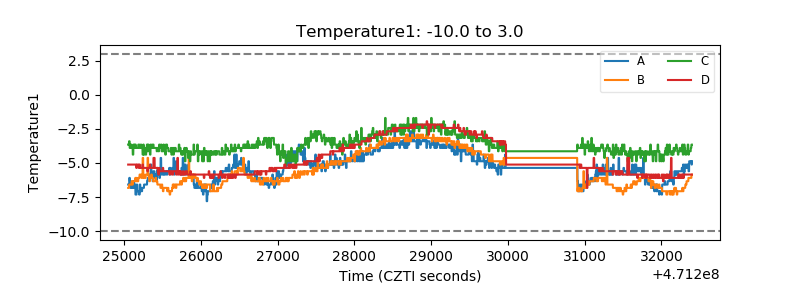 |
| Veto HV Monitor | 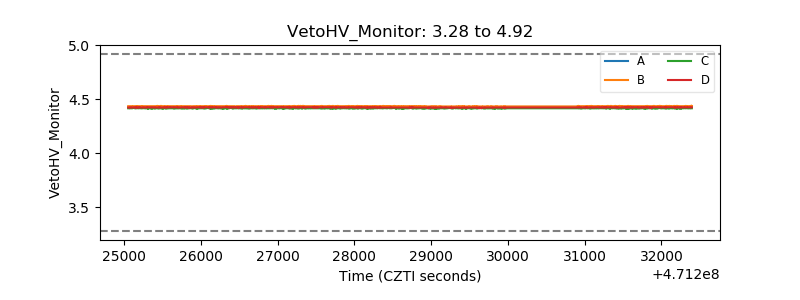 |
| Veto LLD | 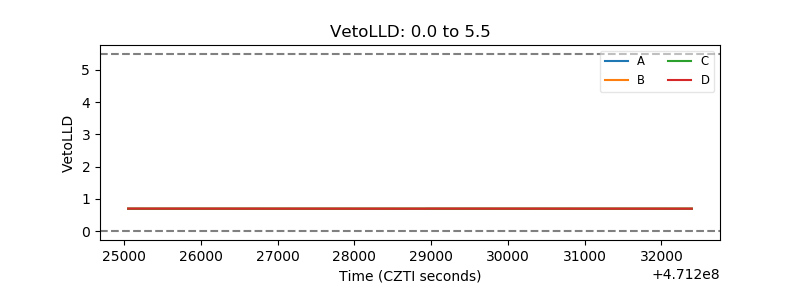 |
| Alpha Counter | 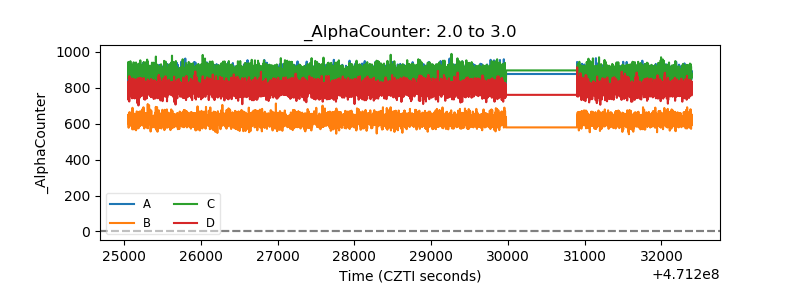 |
| _CPM_Rate | 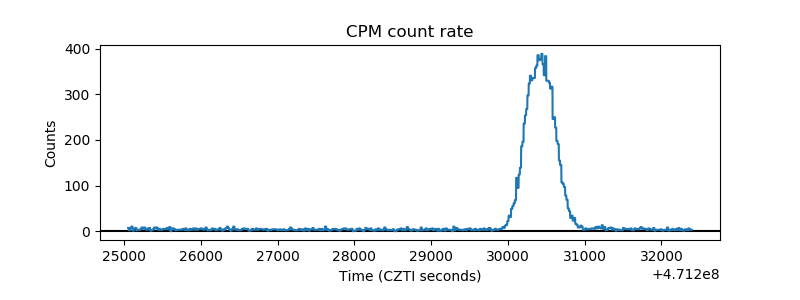 |
| CZT Counter | 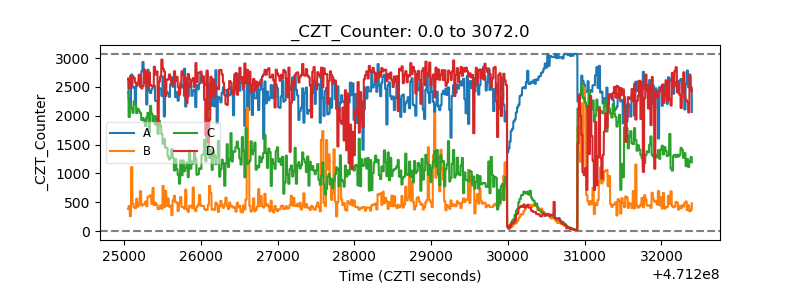 |
| +2.5 Volts monitor | 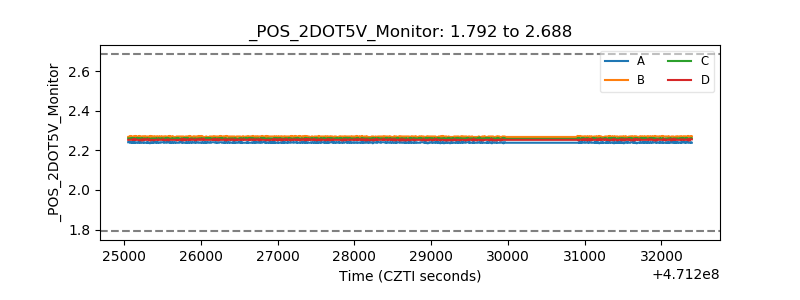 |
| +5 Volts monitor | 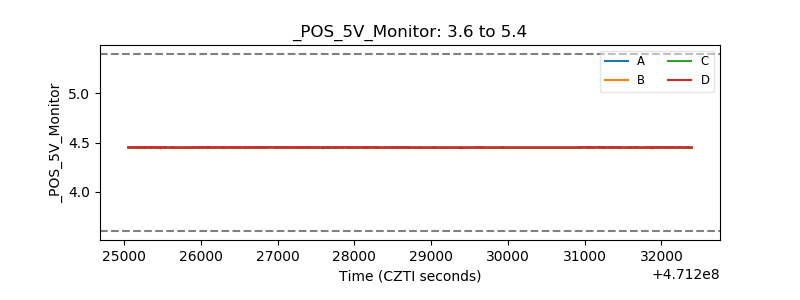 |
| _ROLL_ROT | 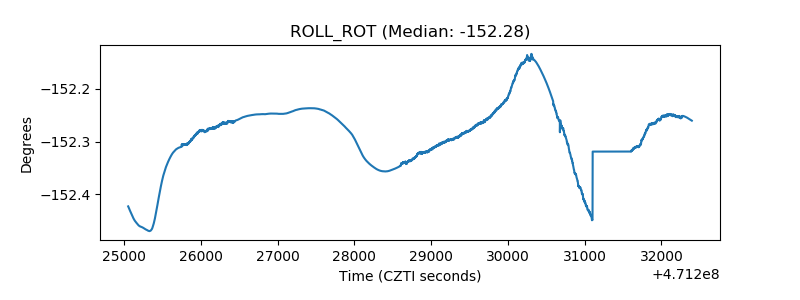 |
| _Roll_DEC | 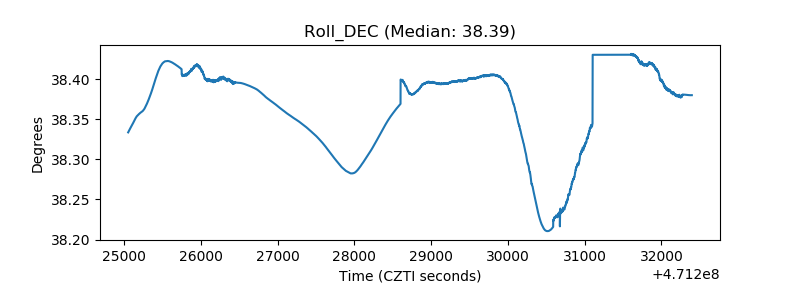 |
| _Roll_RA | 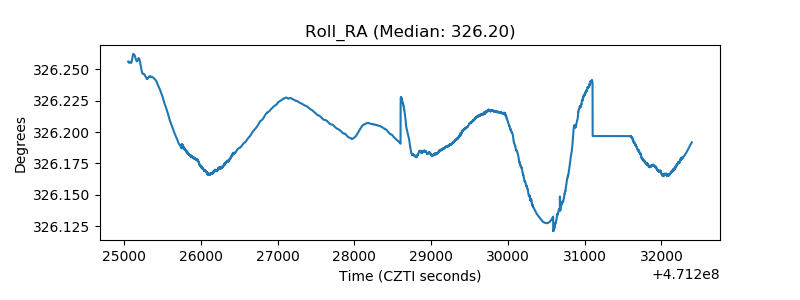 |
| Veto Counter | 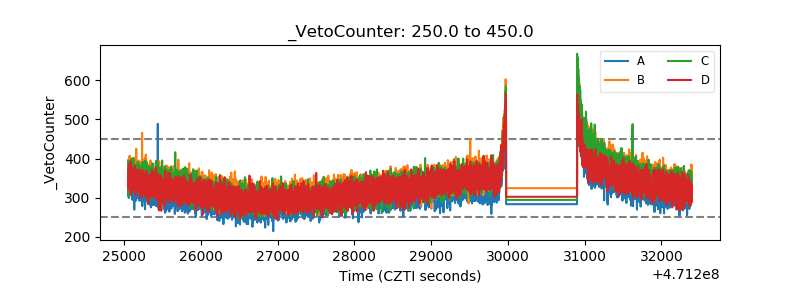 |