| Param | Original file | Final file |
|---|---|---|
| Filename | modeM0/AS1T05_233T01_9000006438_49721cztM0_level2.fits | modeM0/AS1T05_233T01_9000006438_49721cztM0_level2_quad_clean.evt |
| Size (bytes) | 1,091,776,320 | 36,794,880 |
| Size | 1.0 GB | 35.1 MB |
| Events in quadrant A | 14,050,789 | 88,561 |
| Events in quadrant B | 3,427,728 | 602,349 |
| Events in quadrant C | 7,856,313 | 459 |
| Events in quadrant D | 14,620,249 | 9,015 |
| Mode M9 | |||
|---|---|---|---|
| Quadrant | BADHDUFLAG | Total packets | Discarded packets |
| A | 0 | 10 | 0 |
| B | 0 | 10 | 0 |
| C | 0 | 10 | 0 |
| D | 0 | 10 | 0 |
| Mode SS | |||
|---|---|---|---|
| Quadrant | BADHDUFLAG | Total packets | Discarded packets |
| A | 0 | 120 | 0 |
| B | 0 | 120 | 0 |
| C | 0 | 120 | 0 |
| D | 0 | 120 | 0 |
| Mode M0 | |||
|---|---|---|---|
| Quadrant | BADHDUFLAG | Total packets | Discarded packets |
| A | 0 | 45742 | 8 |
| B | 0 | 14342 | 1 |
| C | 0 | 27525 | 1 |
| D | 0 | 47497 | 1 |
| Quadrant | Total seconds | Saturated seconds | Saturation percentage |
|---|---|---|---|
| A | 5917 | 5266 | 88.997803% |
| B | 5918 | 154 | 2.602230% |
| C | 5918 | 5915 | 99.949307% |
| D | 5918 | 5846 | 98.783373% |
Noise dominated data is calculated using 1-second bins in cleaned event files. If a bin has >2000 counts, and if more than 50% of those come from <1% of pixels, then it is considered to be noise-dominated and hence unusable.
| Quadrant | # 1 sec bins | Bins with >0 counts | Bins with >2000 counts | High rate bins dominated by noise | Noise dominated (total time) | Noise dominated (detector-on time) | Marked lightcurve |
|---|---|---|---|---|---|---|---|
| A | 6952 | 5918 | 5241 | 5241 | 75.39% | 88.56% | 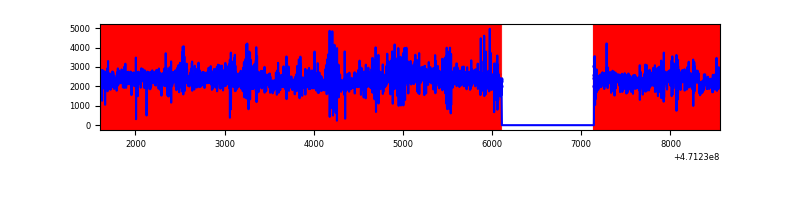 |
| B | 6953 | 5919 | 70 | 70 | 1.01% | 1.18% | 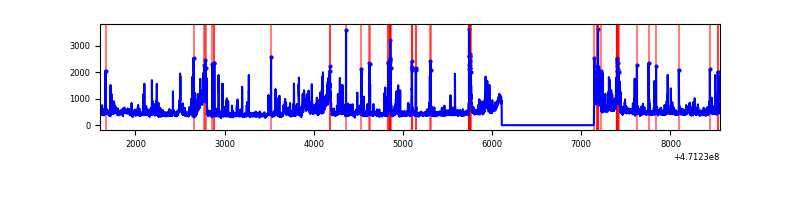 |
| C | 6952 | 5917 | 576 | 576 | 8.29% | 9.73% | 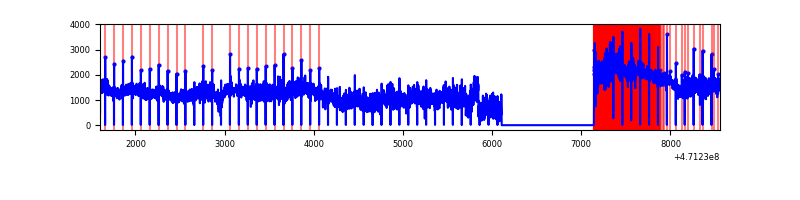 |
| D | 6953 | 5919 | 5013 | 5013 | 72.10% | 84.69% | 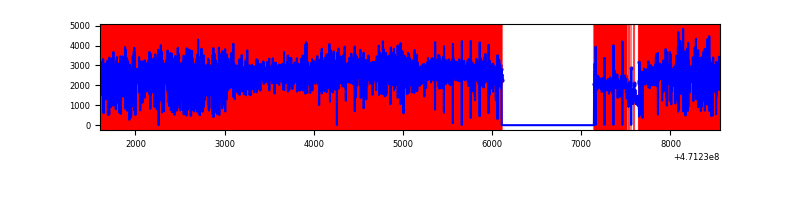 |
Top three noisy pixels from each quadrant. If the there are fewer than three noisy pixels in the level2.evt file, extra rows are filled as -1
| Pixel properties | Quadrant properties | ||||||
|---|---|---|---|---|---|---|---|
| Quadrant | DetID | PixID | Counts | Sigma | Mean | Median | Sigma |
| A | 10 | 83 | 6525736 | 54892.91 | 436 | 422 | 118.9 |
| A | 12 | 50 | 1023845 | 8609.34 | 436 | 422 | 118.9 |
| A | 6 | 250 | 936809 | 7877.17 | 436 | 422 | 118.9 |
| B | 5 | 49 | 195508 | 1470.01 | 632 | 613 | 132.6 |
| B | 10 | 44 | 145388 | 1091.97 | 632 | 613 | 132.6 |
| B | 4 | 206 | 102742 | 770.31 | 632 | 613 | 132.6 |
| C | 15 | 180 | 2356891 | 147941.23 | 39 | 38 | 15.9 |
| C | 15 | 190 | 1853546 | 116345.93 | 39 | 38 | 15.9 |
| C | 15 | 197 | 730867 | 45874.62 | 39 | 38 | 15.9 |
| D | 15 | 40 | 4620723 | 56203.83 | 224 | 213 | 82.2 |
| D | 7 | 61 | 2480602 | 30171.42 | 224 | 213 | 82.2 |
| D | 15 | 168 | 1788314 | 21750.44 | 224 | 213 | 82.2 |
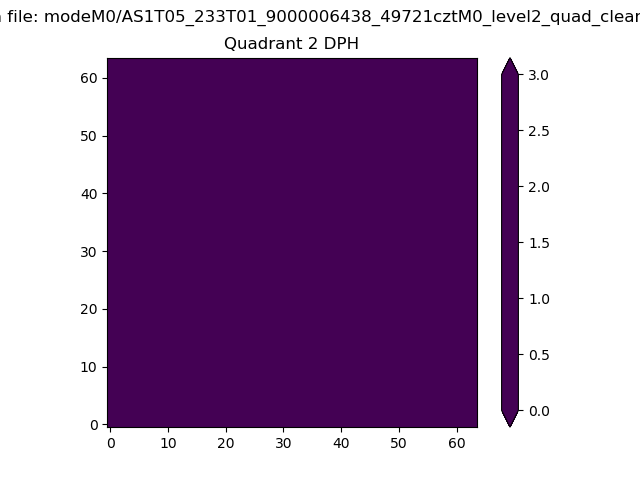
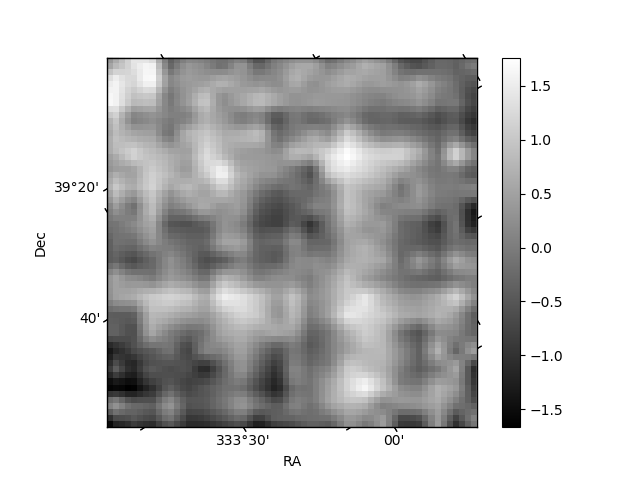
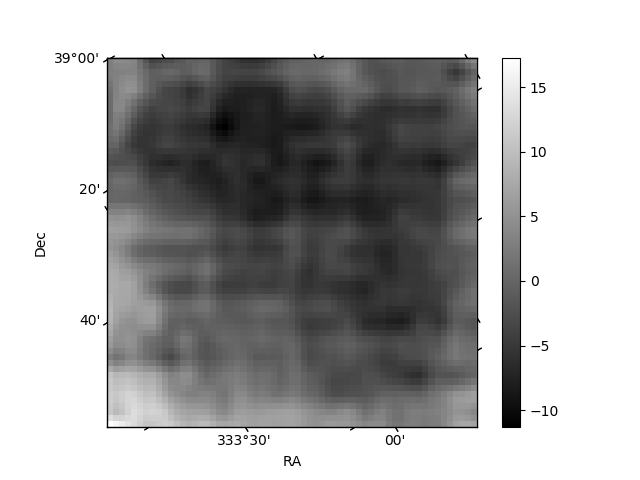
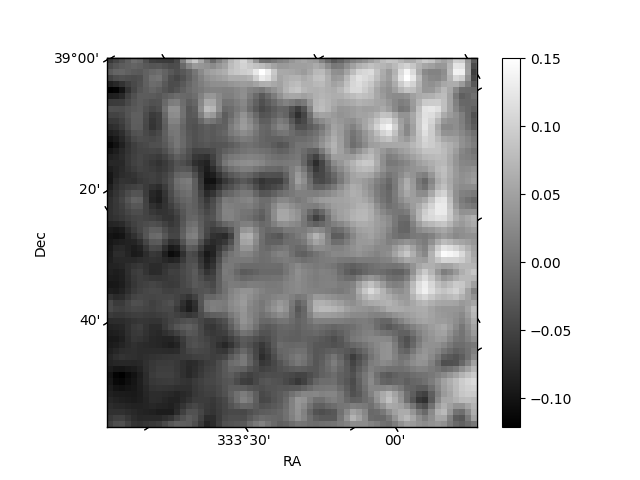
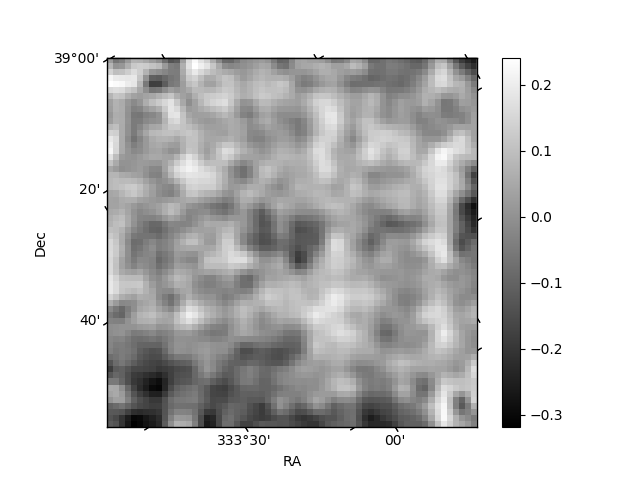
Histogram calculated using DETX and DETY for each event in the final _common_clean file
| Quadrant A | 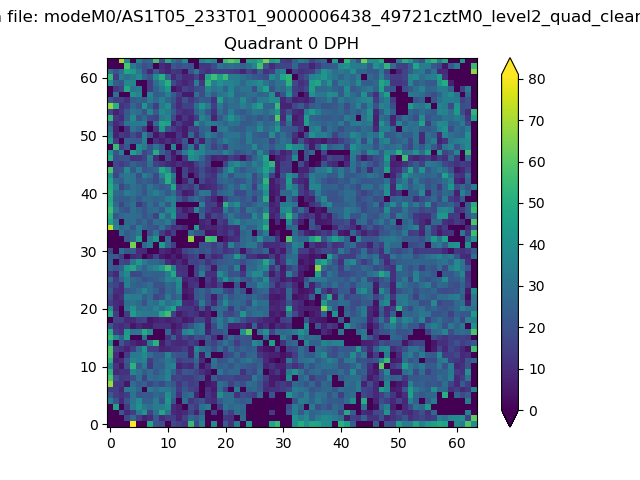 |
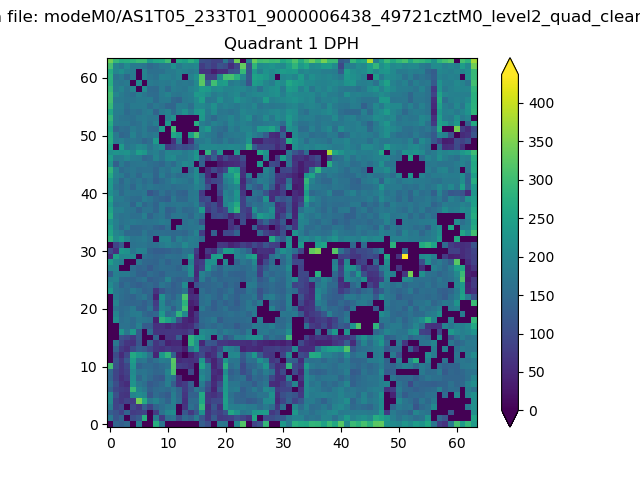 |
Quadrant B |
|---|---|---|---|
| Quadrant D | 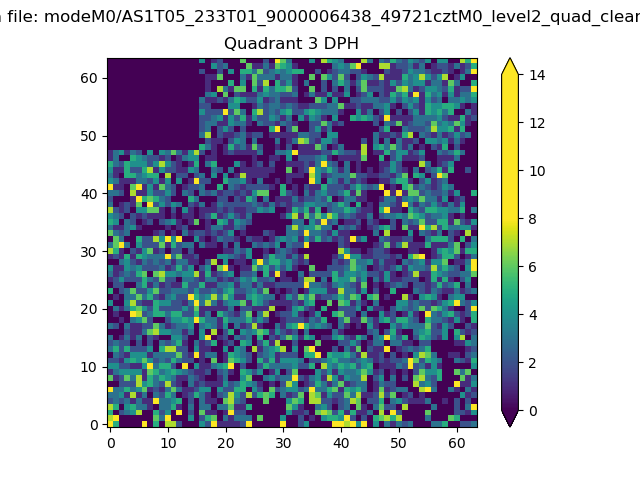 |
 |
Quadrant C |
| Plot type | Count rate plots | Images |
|---|---|---|
| Comparison with Poisson distribution Blue bars denote a histogram of data divided into 1 sec bins. Red curve is a Poisson curve with rate = median count rate of data. |
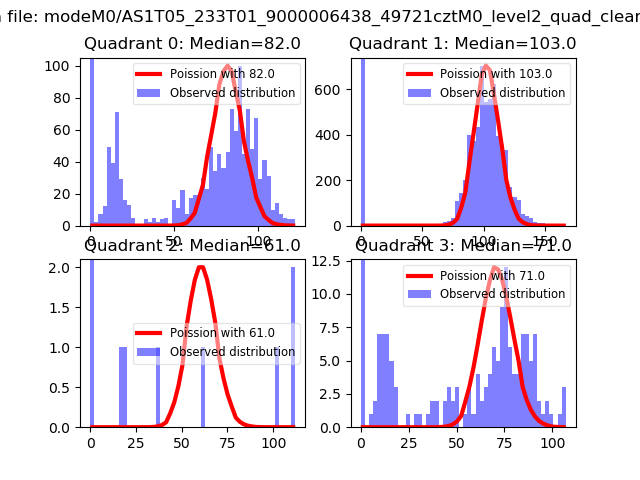 |
 |
| Quadrant-wise count rates Data is divided into 100 sec bins |
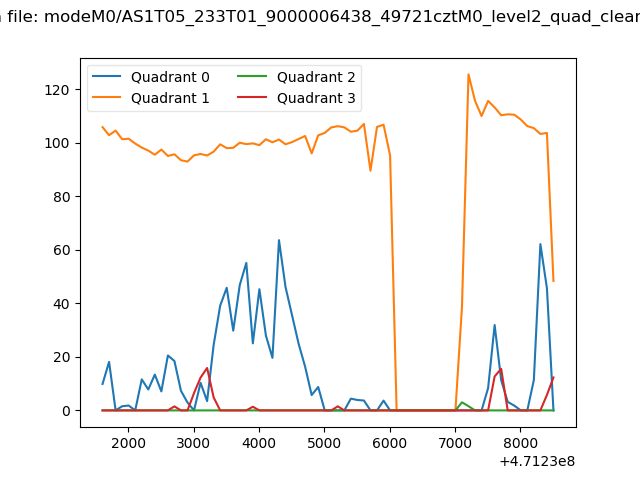 |
|
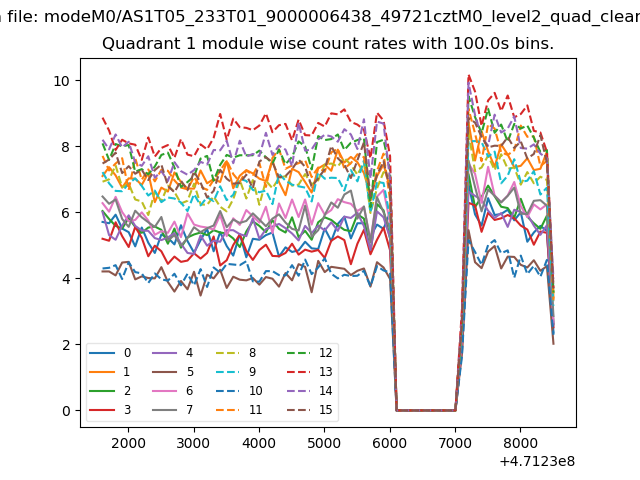
| Module-wise count rates for Quadrant A Data is divided into 100 sec bins |
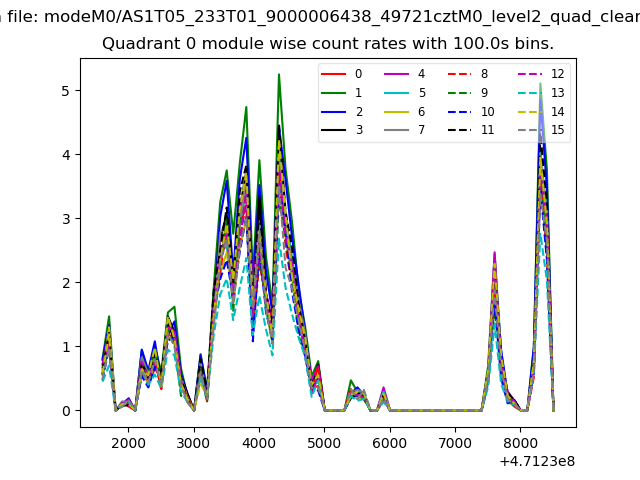 |
 |
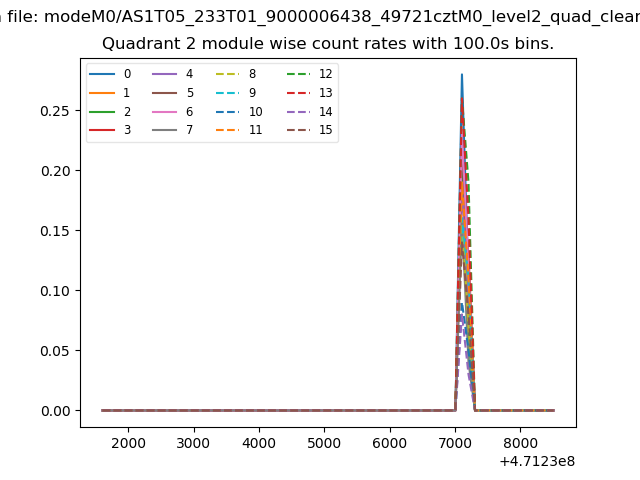
| Module-wise count rates for Quadrant B Data is divided into 100 sec bins |
 |
 |
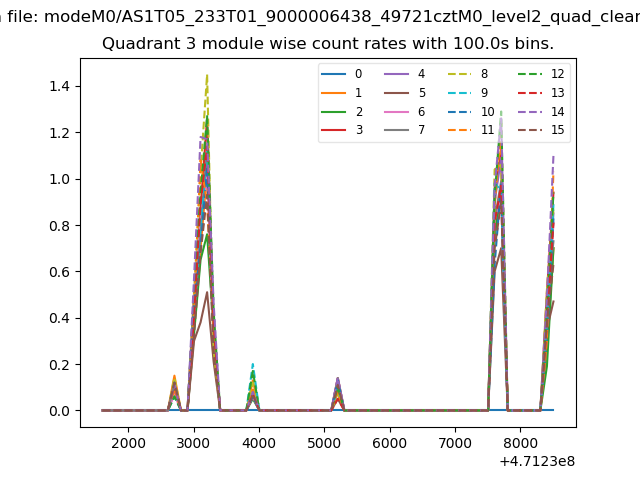
| Module-wise count rates for Quadrant C Data is divided into 100 sec bins |
 |
 |
| Module-wise count rates for Quadrant D Data is divided into 100 sec bins |
 |
 |
| Parameter | Plot |
|---|---|
| CZT HV Monitor | 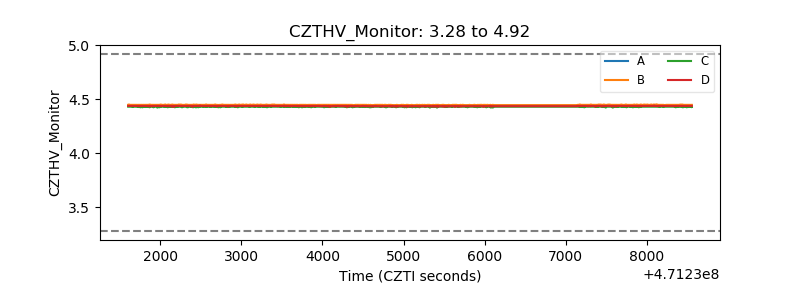 |
| D_VDD | 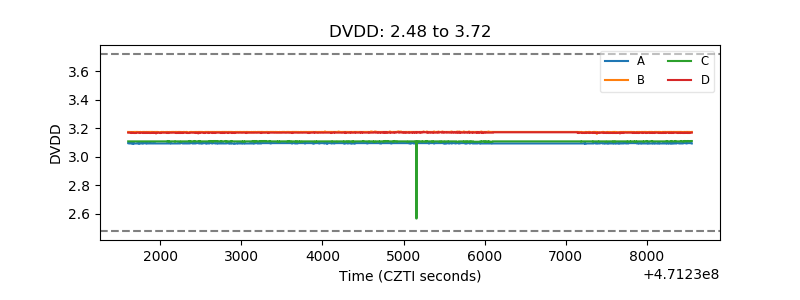 |
| Temperature 1 | 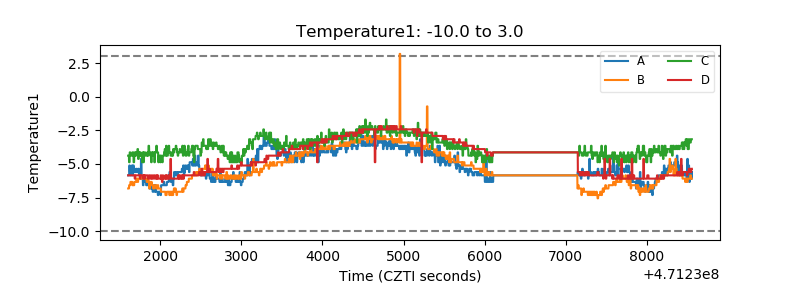 |
| Veto HV Monitor | 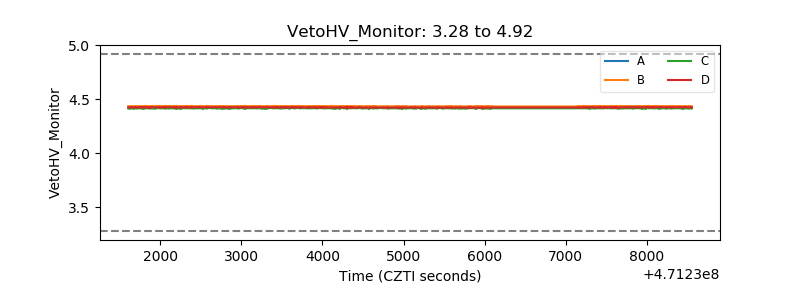 |
| Veto LLD | 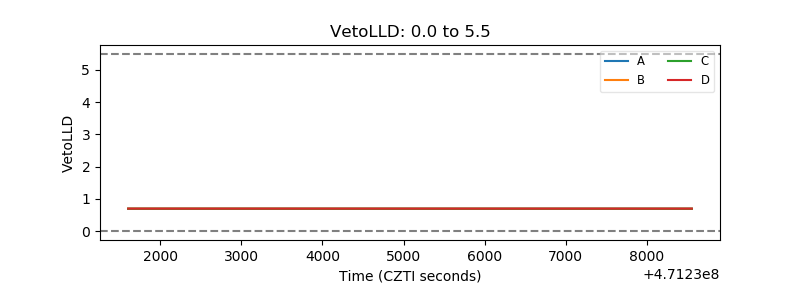 |
| Alpha Counter | 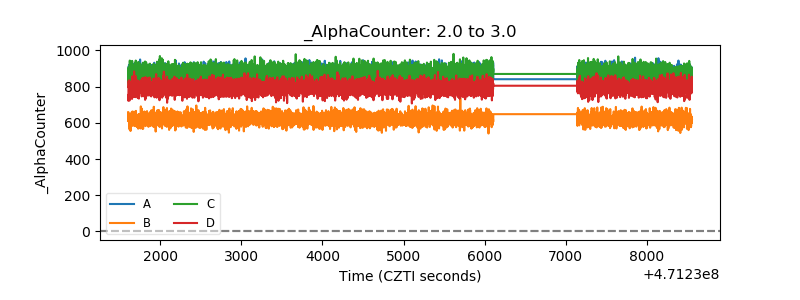 |
| _CPM_Rate | 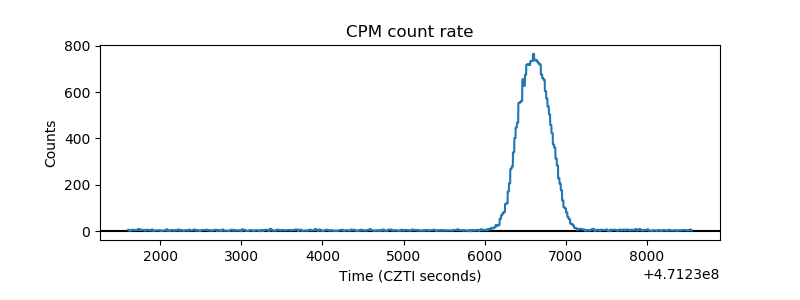 |
| CZT Counter | 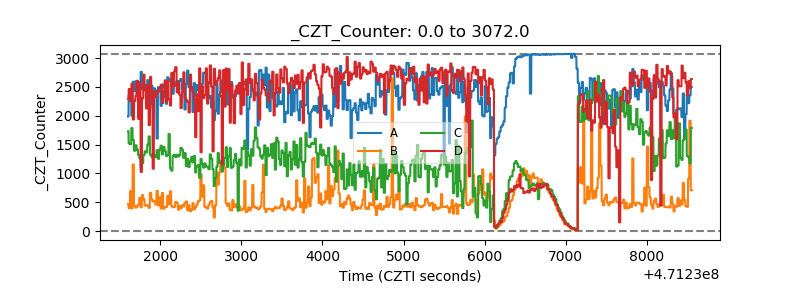 |
| +2.5 Volts monitor | 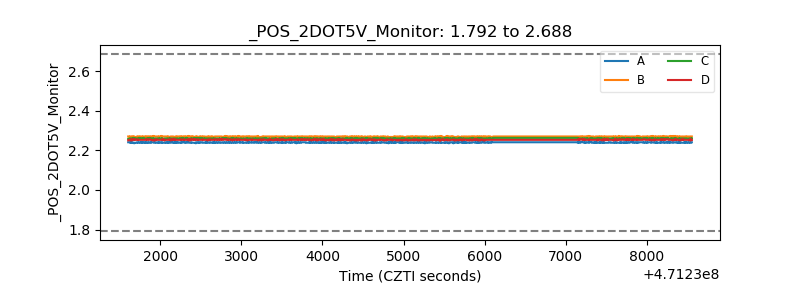 |
| +5 Volts monitor | 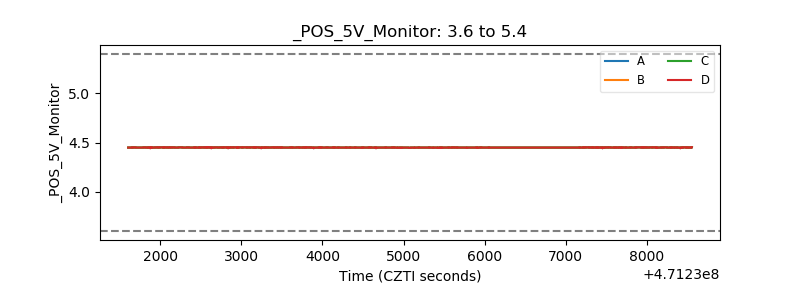 |
| _ROLL_ROT | 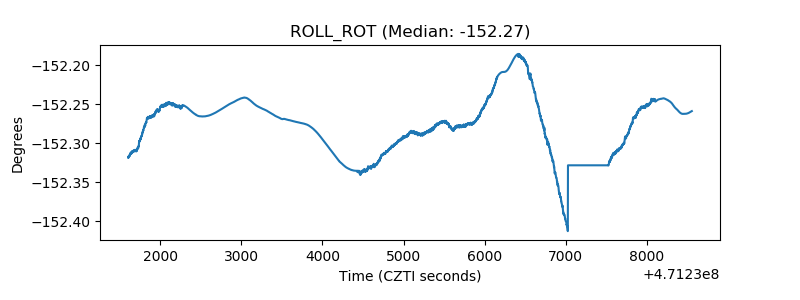 |
| _Roll_DEC | 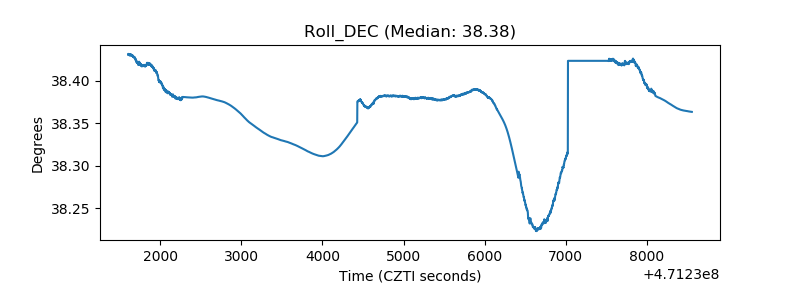 |
| _Roll_RA | 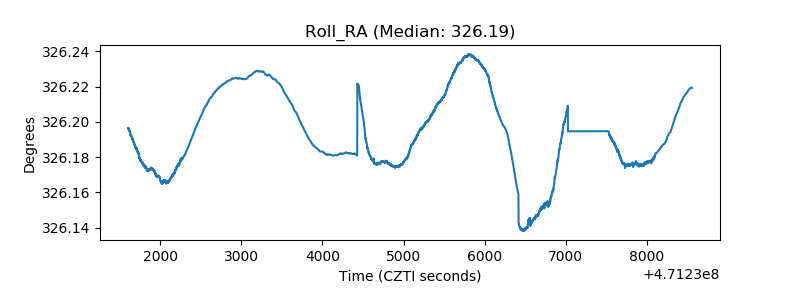 |
| Veto Counter | 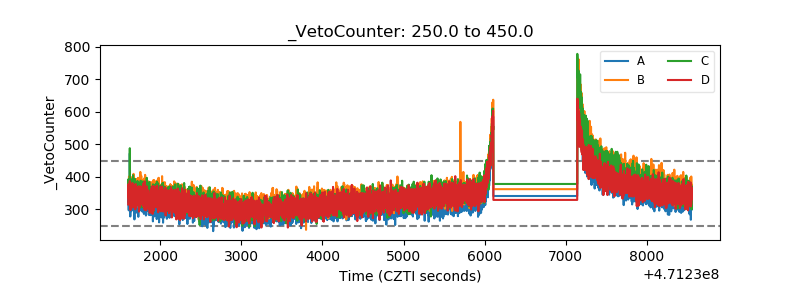 |