| Param | Original file | Final file |
|---|---|---|
| Filename | modeM0/AS1T05_233T01_9000006438_49723cztM0_level2.fits | modeM0/AS1T05_233T01_9000006438_49723cztM0_level2_quad_clean.evt |
| Size (bytes) | 1,219,515,840 | 62,628,480 |
| Size | 1.1 GB | 59.7 MB |
| Events in quadrant A | 14,631,430 | 482,000 |
| Events in quadrant B | 4,518,036 | 707,457 |
| Events in quadrant C | 9,895,228 | 31,728 |
| Events in quadrant D | 15,608,397 | 224,675 |
| Mode M9 | |||
|---|---|---|---|
| Quadrant | BADHDUFLAG | Total packets | Discarded packets |
| A | 0 | 11 | 0 |
| B | 0 | 11 | 0 |
| C | 0 | 11 | 0 |
| D | 0 | 11 | 0 |
| Mode SS | |||
|---|---|---|---|
| Quadrant | BADHDUFLAG | Total packets | Discarded packets |
| A | 0 | 130 | 0 |
| B | 0 | 130 | 0 |
| C | 0 | 130 | 0 |
| D | 0 | 130 | 0 |
| Mode M0 | |||
|---|---|---|---|
| Quadrant | BADHDUFLAG | Total packets | Discarded packets |
| A | 0 | 47785 | 0 |
| B | 0 | 17704 | 0 |
| C | 0 | 33798 | 0 |
| D | 0 | 50732 | 0 |
| Quadrant | Total seconds | Saturated seconds | Saturation percentage |
|---|---|---|---|
| A | 6332 | 5112 | 80.732786% |
| B | 6333 | 358 | 5.652929% |
| C | 6333 | 6333 | 100.000000% |
| D | 6332 | 5948 | 93.935565% |
Noise dominated data is calculated using 1-second bins in cleaned event files. If a bin has >2000 counts, and if more than 50% of those come from <1% of pixels, then it is considered to be noise-dominated and hence unusable.
| Quadrant | # 1 sec bins | Bins with >0 counts | Bins with >2000 counts | High rate bins dominated by noise | Noise dominated (total time) | Noise dominated (detector-on time) | Marked lightcurve |
|---|---|---|---|---|---|---|---|
| A | 7497 | 6333 | 5422 | 5422 | 72.32% | 85.62% | 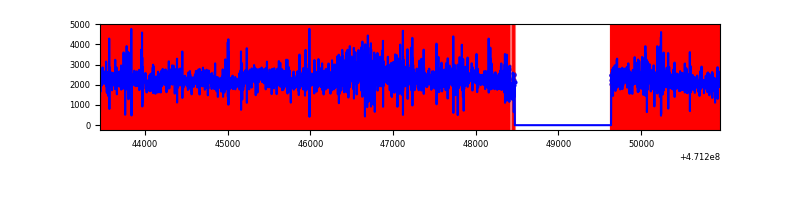 |
| B | 7498 | 6334 | 201 | 201 | 2.68% | 3.17% | 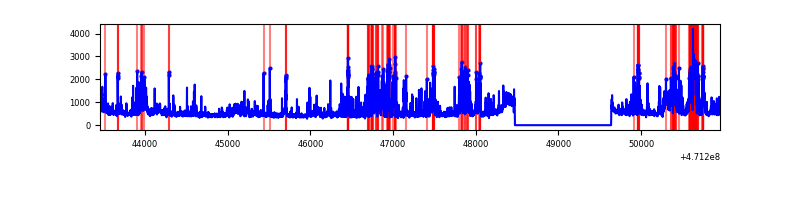 |
| C | 7497 | 6332 | 801 | 801 | 10.68% | 12.65% | 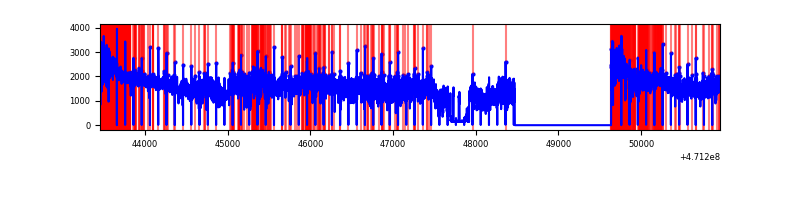 |
| D | 7497 | 6332 | 5247 | 5247 | 69.99% | 82.86% | 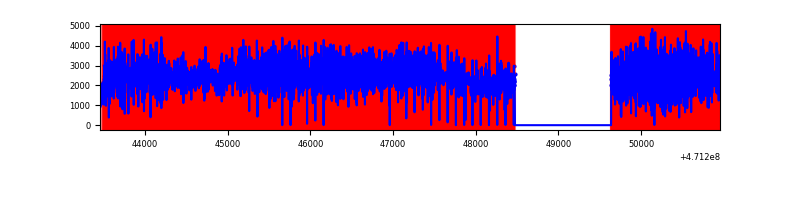 |
Top three noisy pixels from each quadrant. If the there are fewer than three noisy pixels in the level2.evt file, extra rows are filled as -1
| Pixel properties | Quadrant properties | ||||||
|---|---|---|---|---|---|---|---|
| Quadrant | DetID | PixID | Counts | Sigma | Mean | Median | Sigma |
| A | 10 | 83 | 7854457 | 53819.55 | 541 | 526 | 145.9 |
| A | 3 | 130 | 769942 | 5272.47 | 541 | 526 | 145.9 |
| A | 12 | 50 | 728971 | 4991.71 | 541 | 526 | 145.9 |
| B | 10 | 128 | 622929 | 4141.49 | 711 | 690 | 150.2 |
| B | 7 | 0 | 373034 | 2478.24 | 711 | 690 | 150.2 |
| B | 10 | 45 | 200398 | 1329.21 | 711 | 690 | 150.2 |
| C | 15 | 190 | 2589538 | 81284.0 | 52 | 49 | 31.9 |
| C | 15 | 213 | 2167631 | 68040.35 | 52 | 49 | 31.9 |
| C | 15 | 180 | 1188481 | 37304.85 | 52 | 49 | 31.9 |
| D | 7 | 61 | 2818532 | 29685.65 | 280 | 267 | 94.9 |
| D | 15 | 40 | 2814349 | 29641.59 | 280 | 267 | 94.9 |
| D | 15 | 94 | 1829123 | 19263.9 | 280 | 267 | 94.9 |
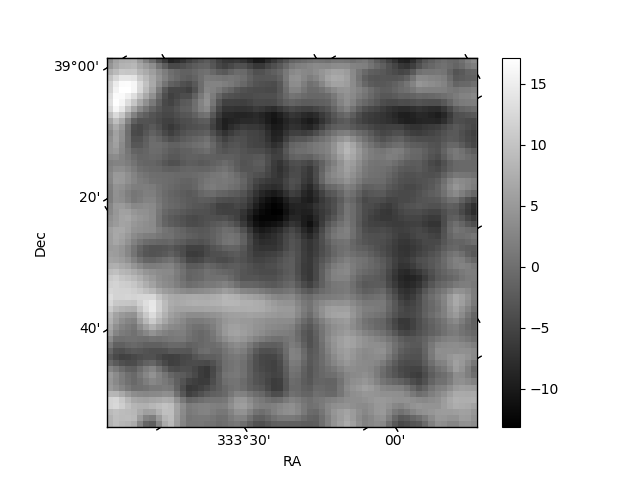
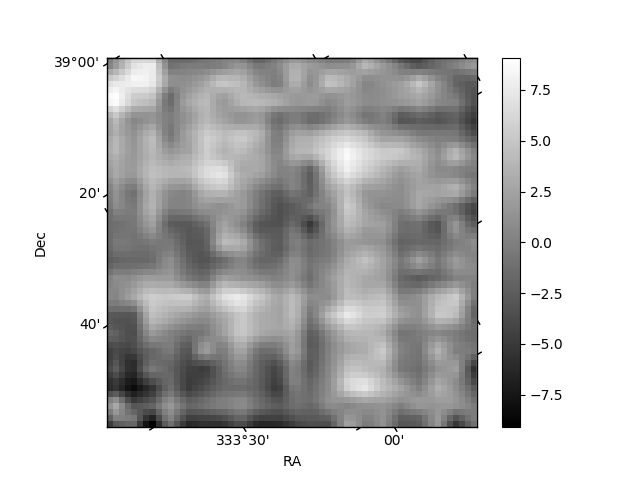
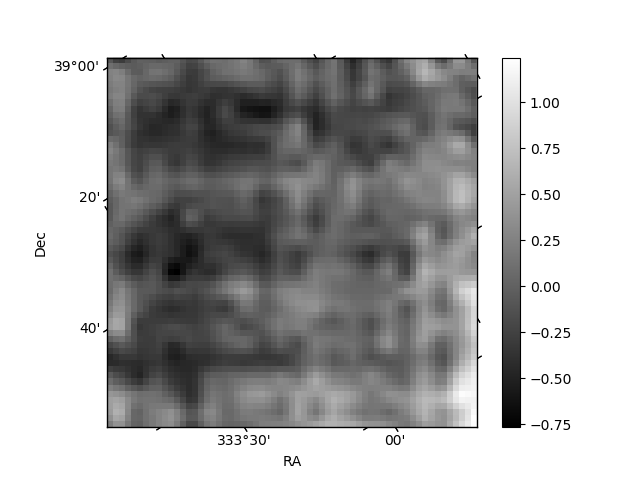
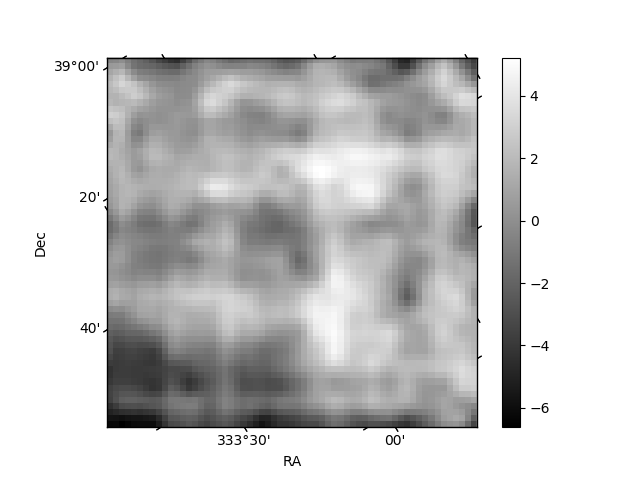
Histogram calculated using DETX and DETY for each event in the final _common_clean file
| Quadrant A | 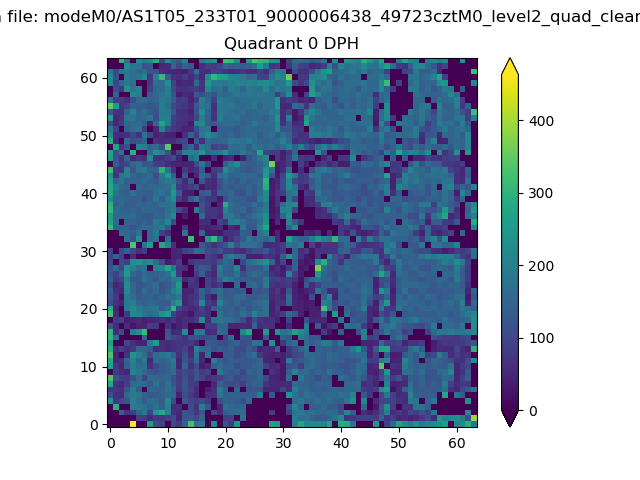 |
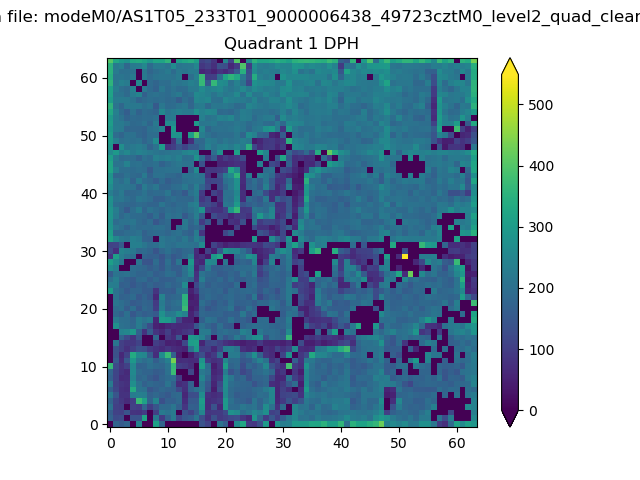 |
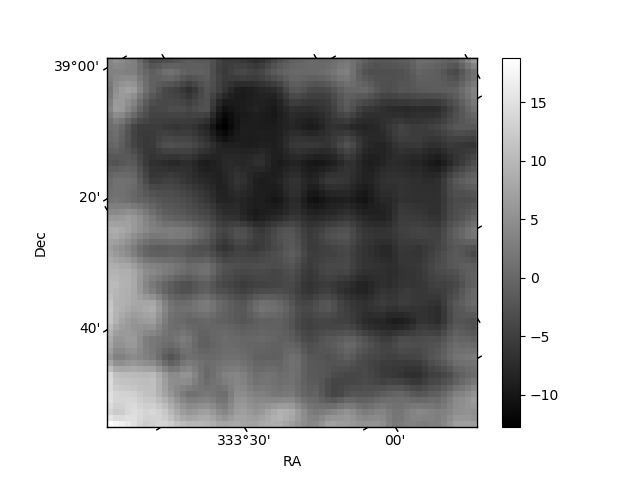
Quadrant B |
|---|---|---|---|
| Quadrant D | 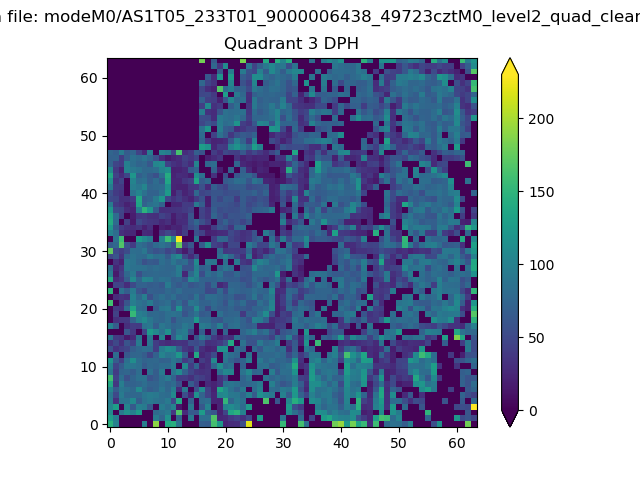 |
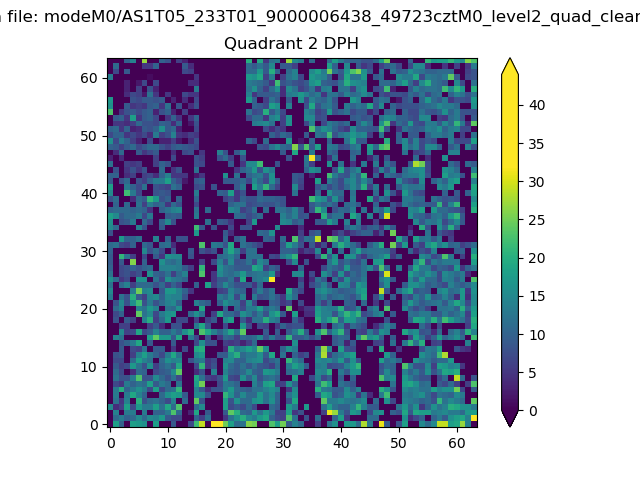 |
Quadrant C |
| Plot type | Count rate plots | Images |
|---|---|---|
| Comparison with Poisson distribution Blue bars denote a histogram of data divided into 1 sec bins. Red curve is a Poisson curve with rate = median count rate of data. |
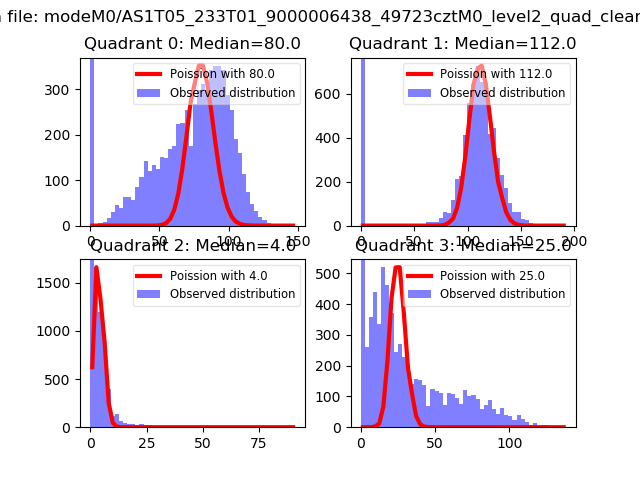 |
 |
| Quadrant-wise count rates Data is divided into 100 sec bins |
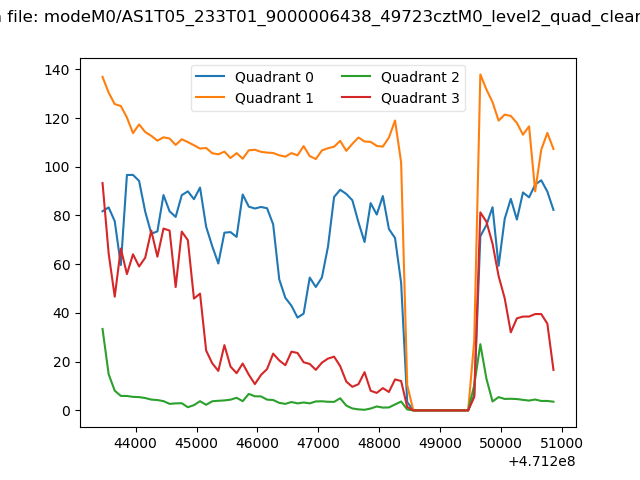 |
|
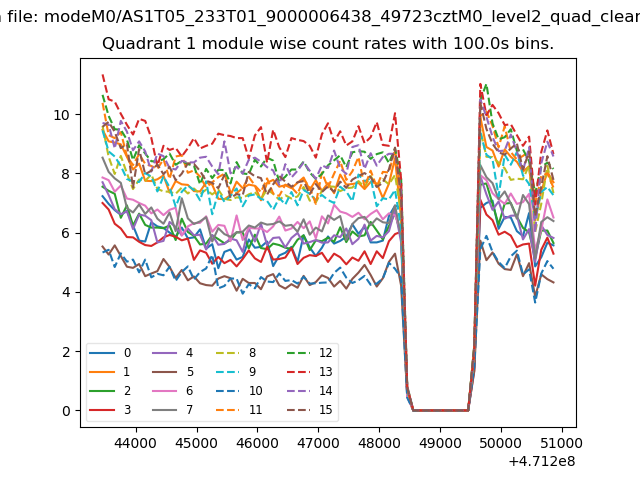
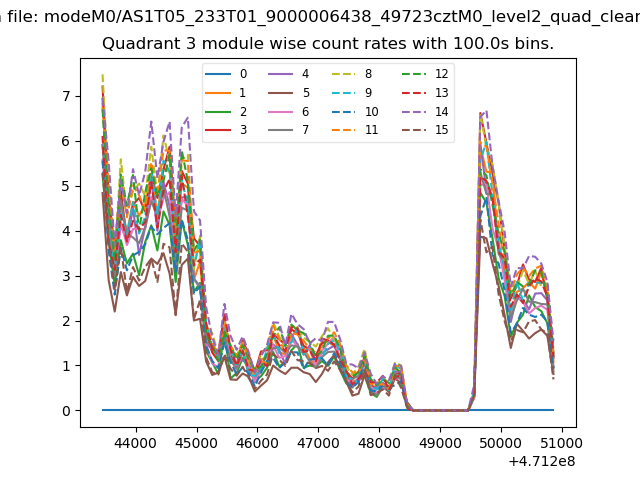
| Module-wise count rates for Quadrant A Data is divided into 100 sec bins |
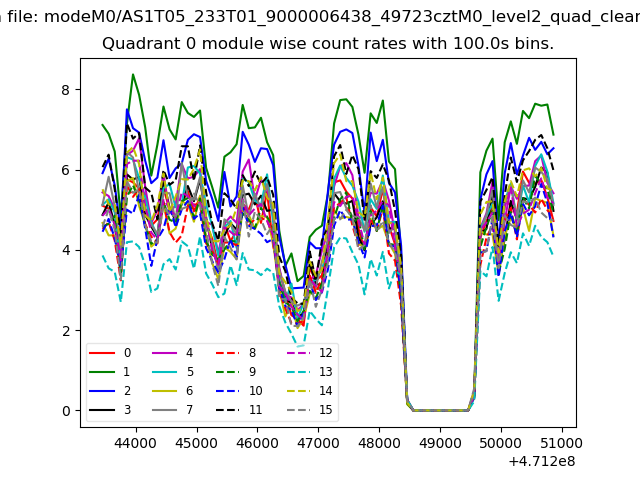 |
 |
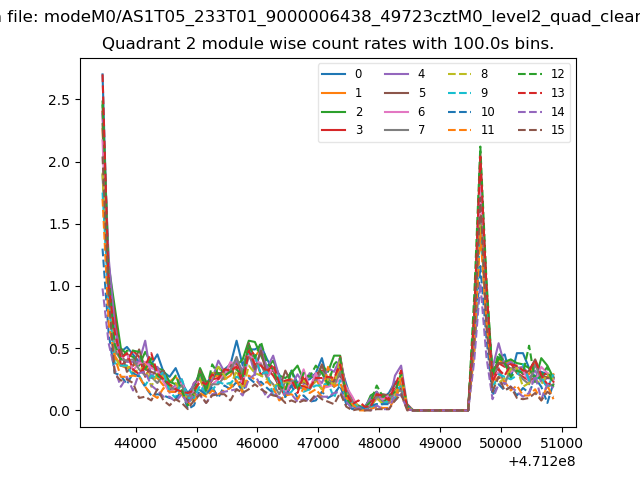
| Module-wise count rates for Quadrant B Data is divided into 100 sec bins |
 |
 |
| Module-wise count rates for Quadrant C Data is divided into 100 sec bins |
 |
 |
| Module-wise count rates for Quadrant D Data is divided into 100 sec bins |
 |
 |
| Parameter | Plot |
|---|---|
| CZT HV Monitor | 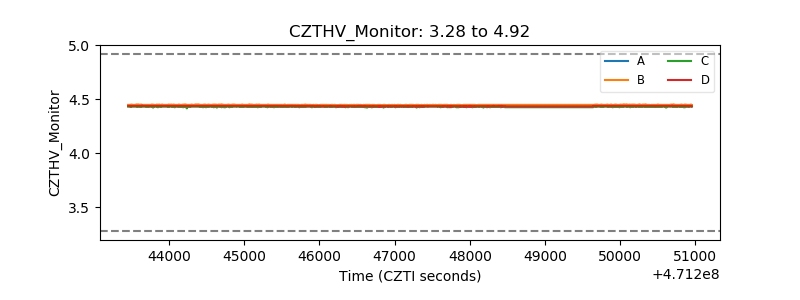 |
| D_VDD | 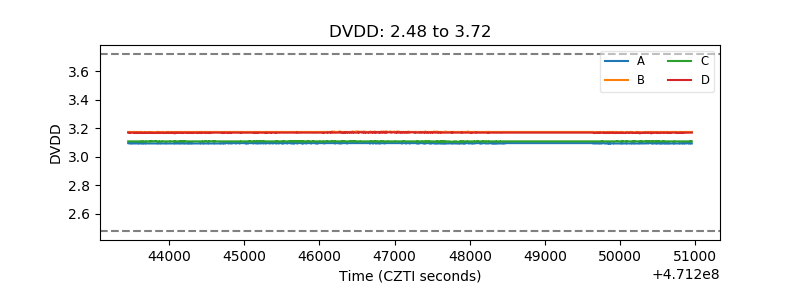 |
| Temperature 1 | 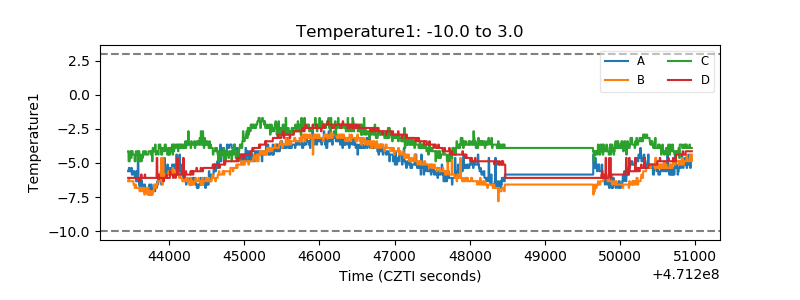 |
| Veto HV Monitor | 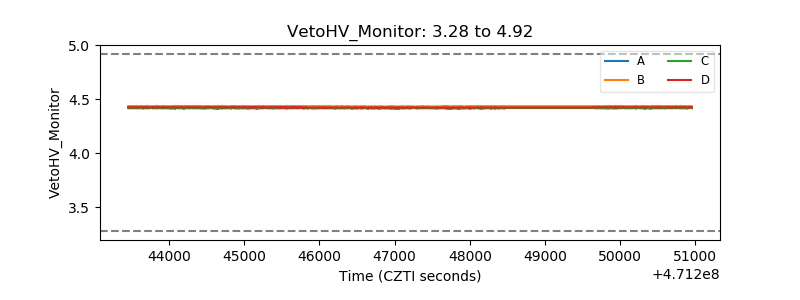 |
| Veto LLD | 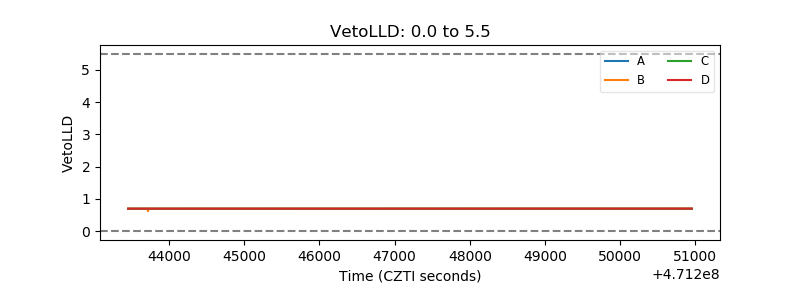 |
| Alpha Counter | 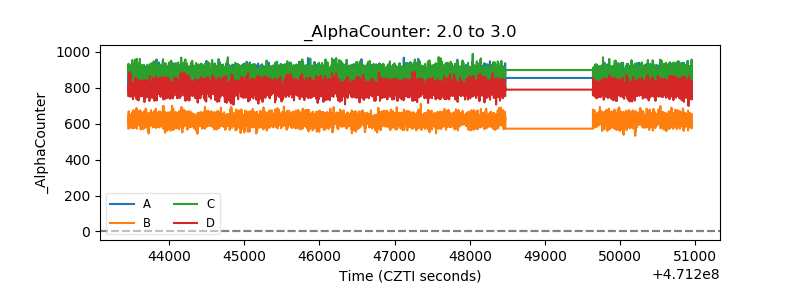 |
| _CPM_Rate | 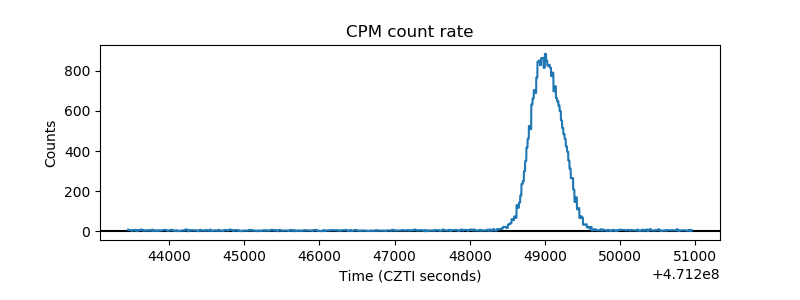 |
| CZT Counter | 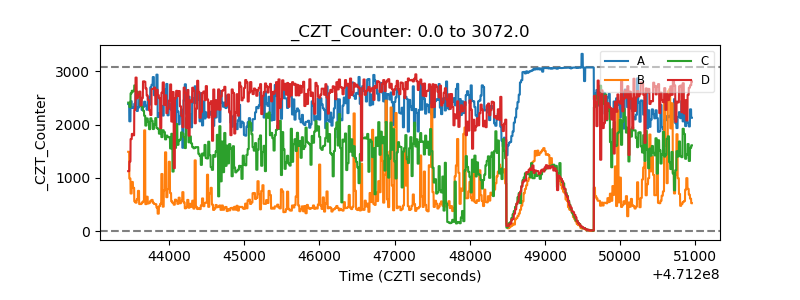 |
| +2.5 Volts monitor | 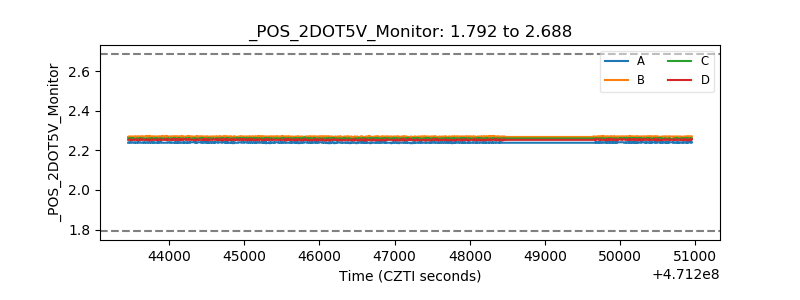 |
| +5 Volts monitor | 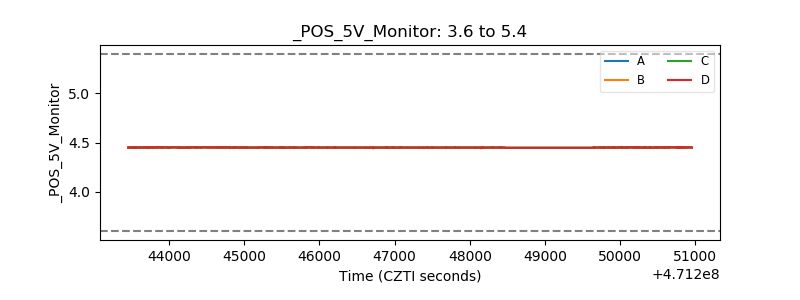 |
| _ROLL_ROT | 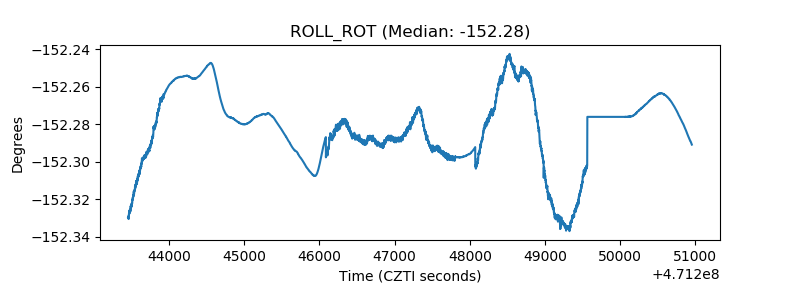 |
| _Roll_DEC | 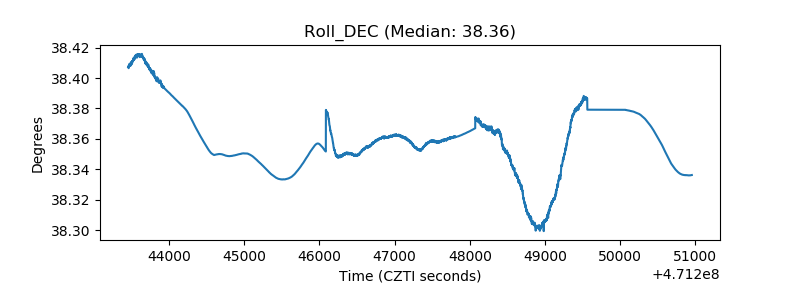 |
| _Roll_RA | 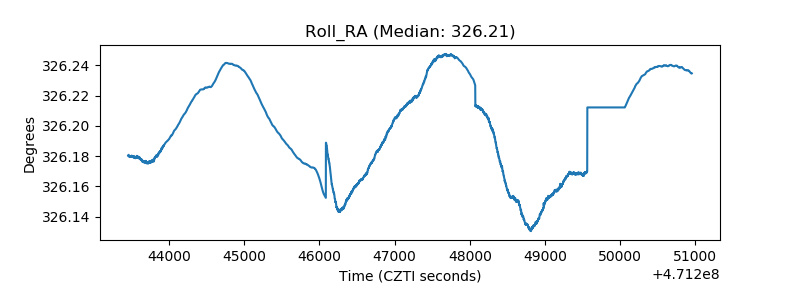 |
| Veto Counter | 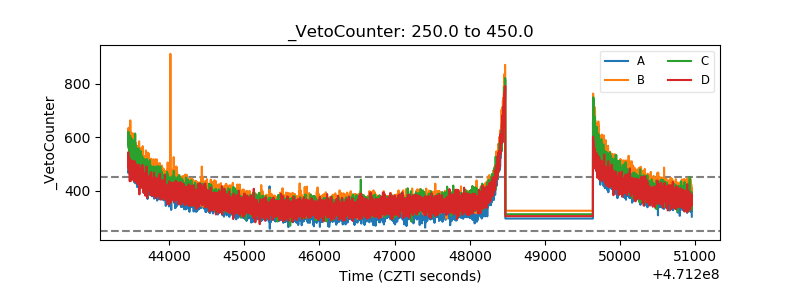 |