| Param | Original file | Final file |
|---|---|---|
| Filename | modeM0/AS1T05_233T01_9000006438_49727cztM0_level2.fits | modeM0/AS1T05_233T01_9000006438_49727cztM0_level2_quad_clean.evt |
| Size (bytes) | 1,251,648,000 | 59,302,080 |
| Size | 1.2 GB | 56.6 MB |
| Events in quadrant A | 16,002,963 | 452,262 |
| Events in quadrant B | 6,367,791 | 678,268 |
| Events in quadrant C | 8,176,736 | 10,293 |
| Events in quadrant D | 15,249,096 | 164,149 |
| Mode M9 | |||
|---|---|---|---|
| Quadrant | BADHDUFLAG | Total packets | Discarded packets |
| A | 0 | 2 | 0 |
| B | 0 | 2 | 0 |
| C | 0 | 2 | 0 |
| D | 0 | 2 | 0 |
| Mode SS | |||
|---|---|---|---|
| Quadrant | BADHDUFLAG | Total packets | Discarded packets |
| A | 0 | 142 | 0 |
| B | 0 | 142 | 0 |
| C | 0 | 142 | 0 |
| D | 0 | 142 | 0 |
| Mode M0 | |||
|---|---|---|---|
| Quadrant | BADHDUFLAG | Total packets | Discarded packets |
| A | 0 | 52286 | 0 |
| B | 0 | 23678 | 0 |
| C | 0 | 29185 | 0 |
| D | 0 | 50033 | 0 |
| Quadrant | Total seconds | Saturated seconds | Saturation percentage |
|---|---|---|---|
| A | 6903 | 5694 | 82.485876% |
| B | 6904 | 1060 | 15.353418% |
| C | 6904 | 6904 | 100.000000% |
| D | 6903 | 6651 | 96.349413% |
Noise dominated data is calculated using 1-second bins in cleaned event files. If a bin has >2000 counts, and if more than 50% of those come from <1% of pixels, then it is considered to be noise-dominated and hence unusable.
| Quadrant | # 1 sec bins | Bins with >0 counts | Bins with >2000 counts | High rate bins dominated by noise | Noise dominated (total time) | Noise dominated (detector-on time) | Marked lightcurve |
|---|---|---|---|---|---|---|---|
| A | 7103 | 6905 | 5654 | 5654 | 79.60% | 81.88% | 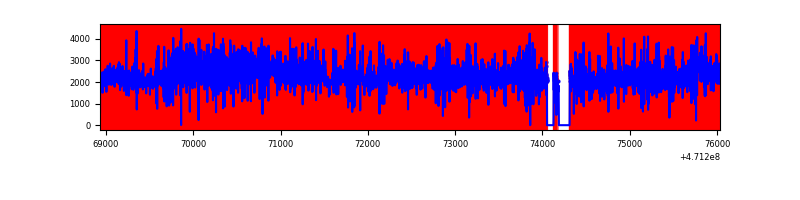 |
| B | 7104 | 6906 | 775 | 775 | 10.91% | 11.22% | 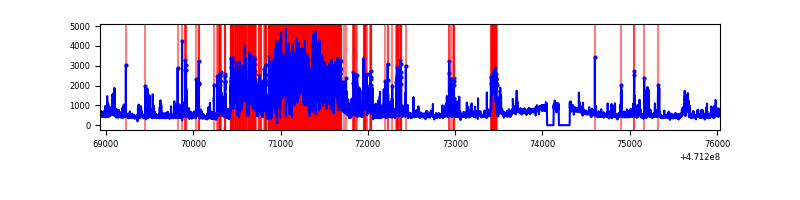 |
| C | 7103 | 6903 | 339 | 339 | 4.77% | 4.91% | 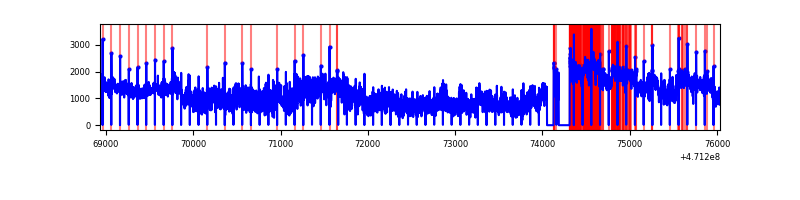 |
| D | 7103 | 6902 | 4511 | 4511 | 63.51% | 65.36% | 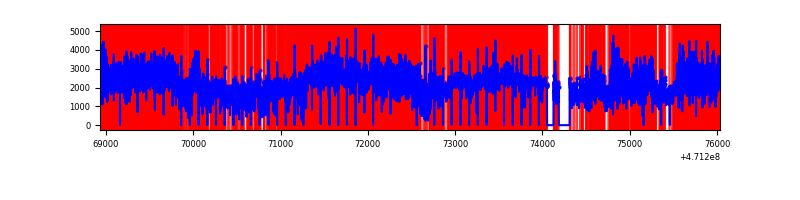 |
Top three noisy pixels from each quadrant. If the there are fewer than three noisy pixels in the level2.evt file, extra rows are filled as -1
| Pixel properties | Quadrant properties | ||||||
|---|---|---|---|---|---|---|---|
| Quadrant | DetID | PixID | Counts | Sigma | Mean | Median | Sigma |
| A | 10 | 83 | 7613708 | 49063.21 | 538 | 521 | 155.2 |
| A | 3 | 99 | 1121310 | 7222.93 | 538 | 521 | 155.2 |
| A | 3 | 130 | 909527 | 5858.09 | 538 | 521 | 155.2 |
| B | 10 | 128 | 2478674 | 16135.3 | 726 | 704 | 153.6 |
| B | 10 | 44 | 182639 | 1184.67 | 726 | 704 | 153.6 |
| B | 4 | 206 | 136281 | 882.81 | 726 | 704 | 153.6 |
| C | 15 | 180 | 2233004 | 105539.62 | 33 | 31 | 21.2 |
| C | 15 | 190 | 1914226 | 90472.85 | 33 | 31 | 21.2 |
| C | 0 | 193 | 1291950 | 61061.48 | 33 | 31 | 21.2 |
| D | 7 | 61 | 4124773 | 47984.26 | 232 | 220 | 86.0 |
| D | 15 | 40 | 2476100 | 28803.91 | 232 | 220 | 86.0 |
| D | 15 | 168 | 1308629 | 15221.78 | 232 | 220 | 86.0 |
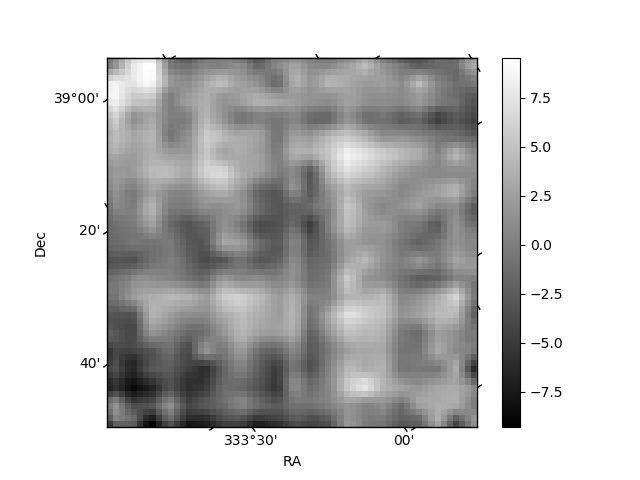
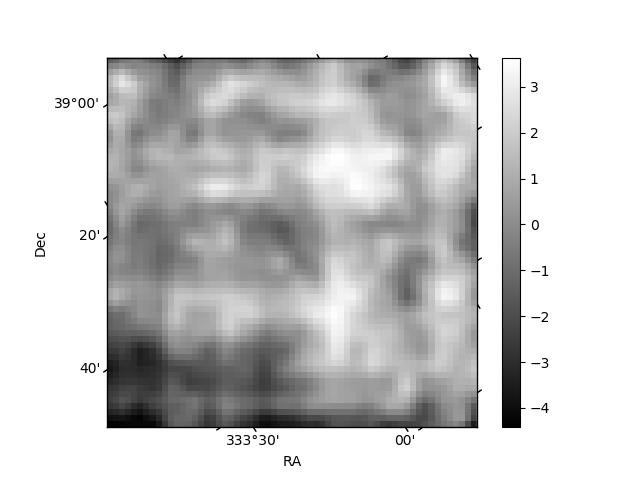
Histogram calculated using DETX and DETY for each event in the final _common_clean file
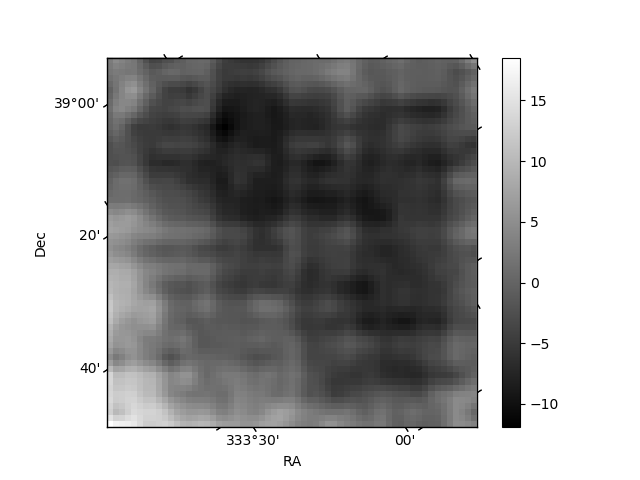
| Quadrant A | 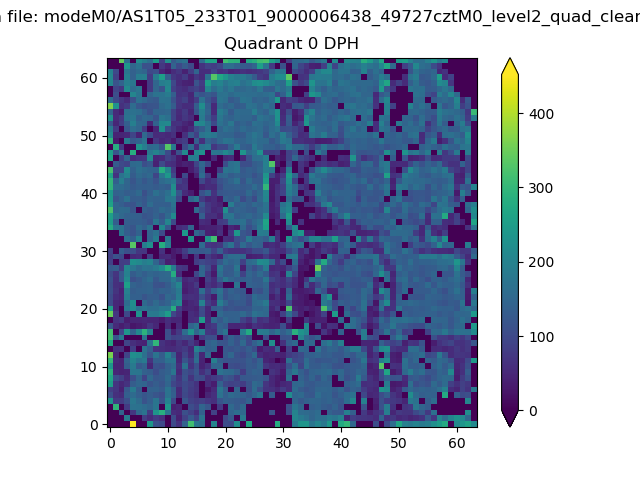 |
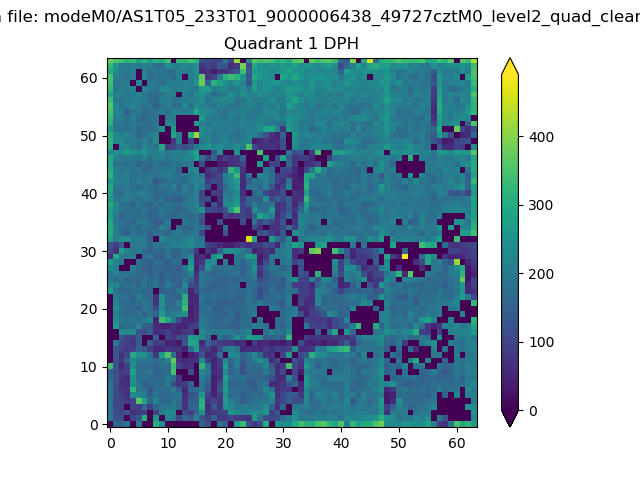 |
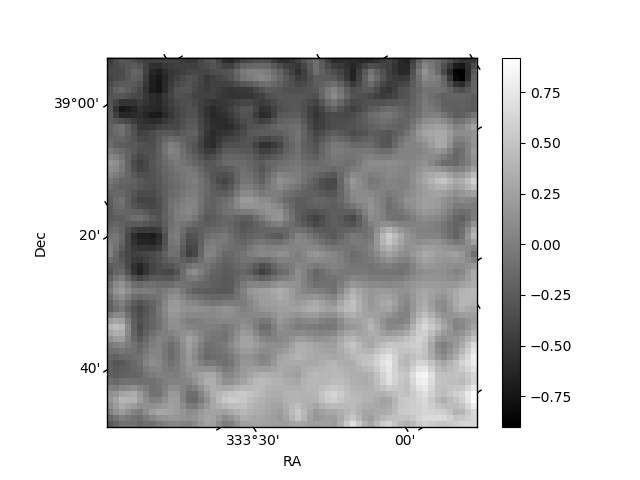
Quadrant B |
|---|---|---|---|
| Quadrant D | 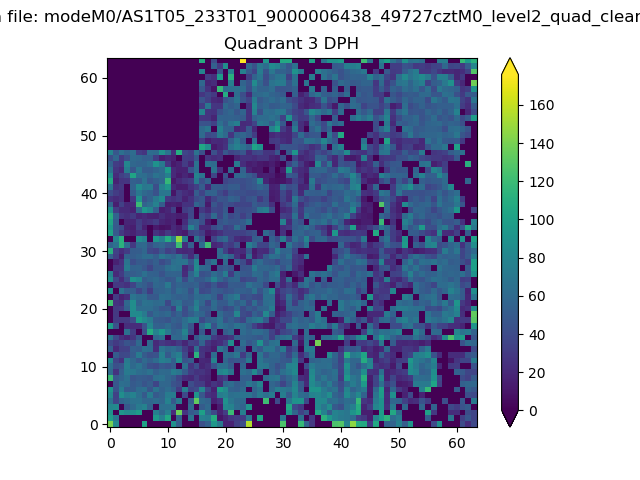 |
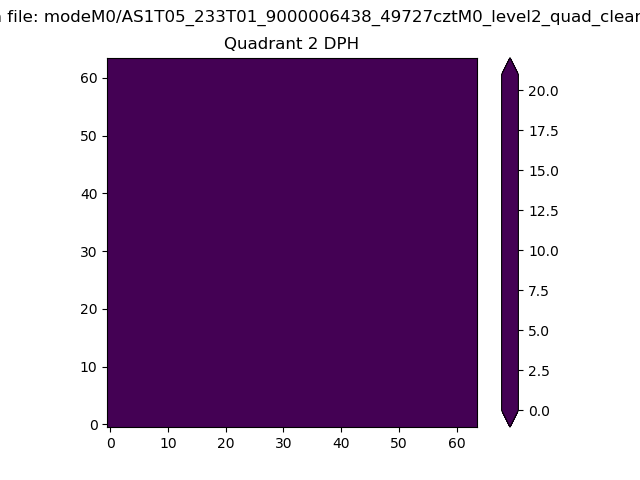 |
Quadrant C |
| Plot type | Count rate plots | Images |
|---|---|---|
| Comparison with Poisson distribution Blue bars denote a histogram of data divided into 1 sec bins. Red curve is a Poisson curve with rate = median count rate of data. |
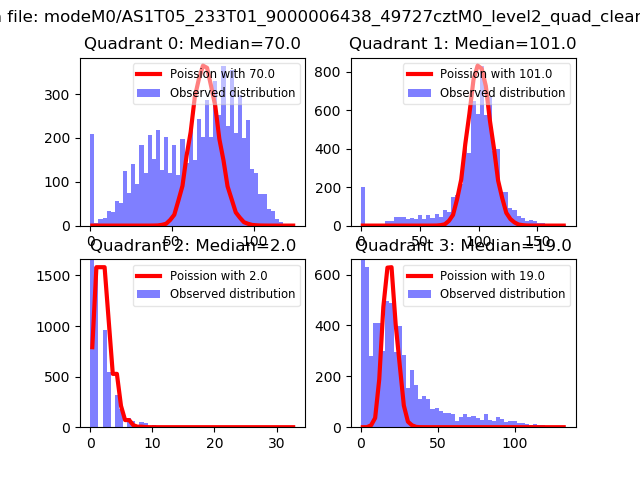 |
 |
| Quadrant-wise count rates Data is divided into 100 sec bins |
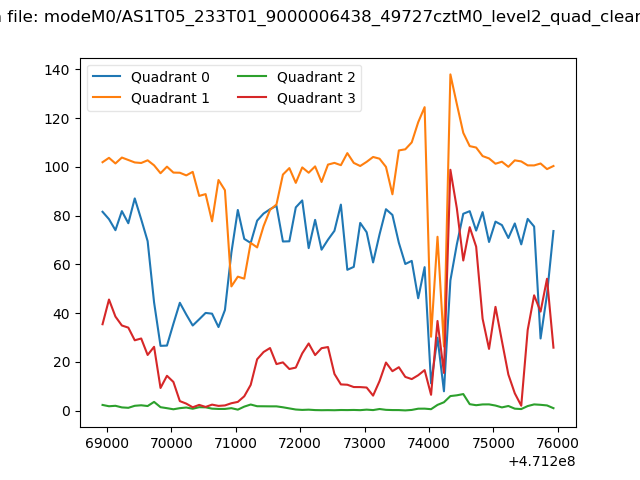 |
|
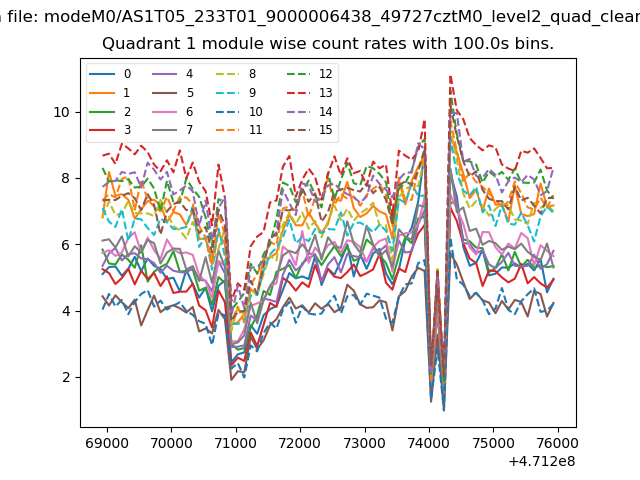
| Module-wise count rates for Quadrant A Data is divided into 100 sec bins |
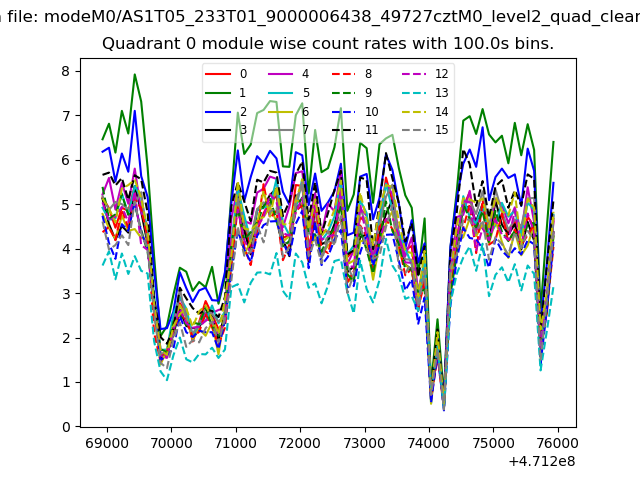 |
 |
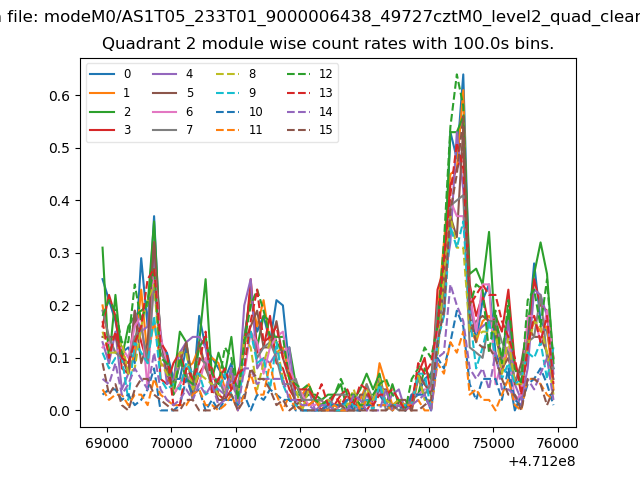
| Module-wise count rates for Quadrant B Data is divided into 100 sec bins |
 |
 |
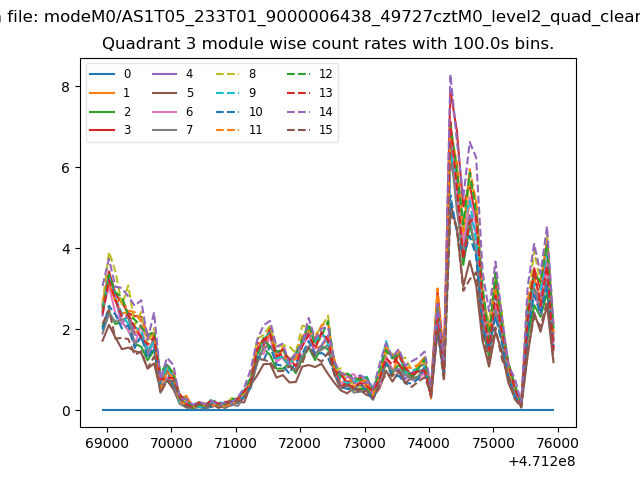
| Module-wise count rates for Quadrant C Data is divided into 100 sec bins |
 |
 |
| Module-wise count rates for Quadrant D Data is divided into 100 sec bins |
 |
 |
| Parameter | Plot |
|---|---|
| CZT HV Monitor |  |
| D_VDD | 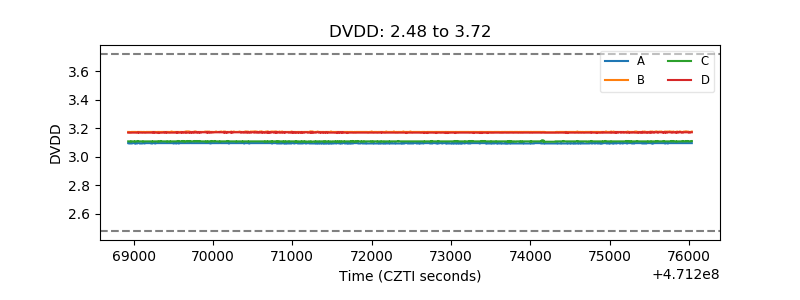 |
| Temperature 1 | 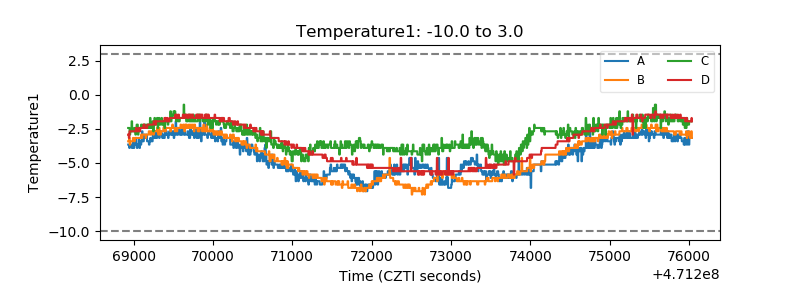 |
| Veto HV Monitor | 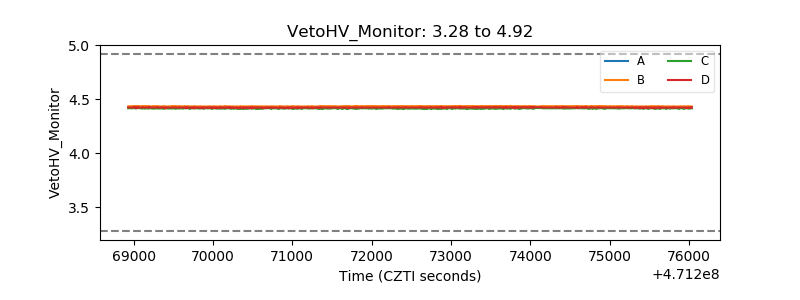 |
| Veto LLD | 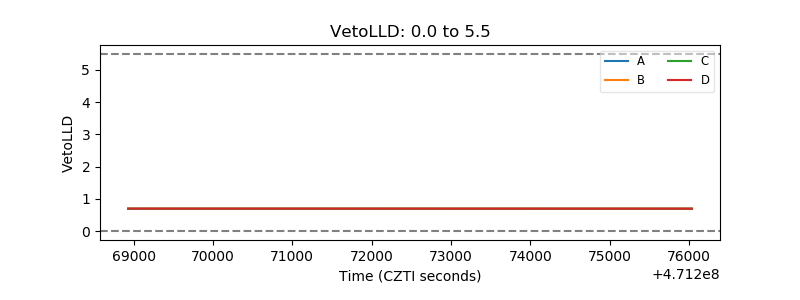 |
| Alpha Counter | 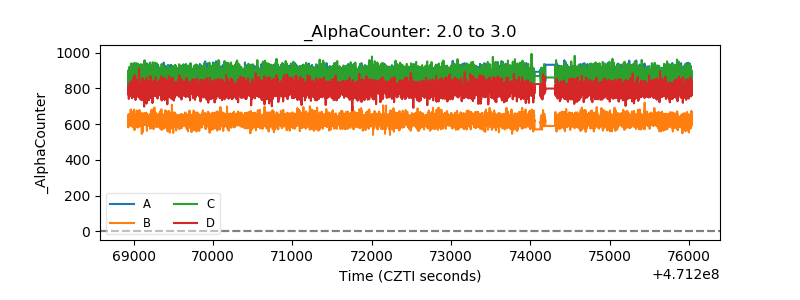 |
| _CPM_Rate | 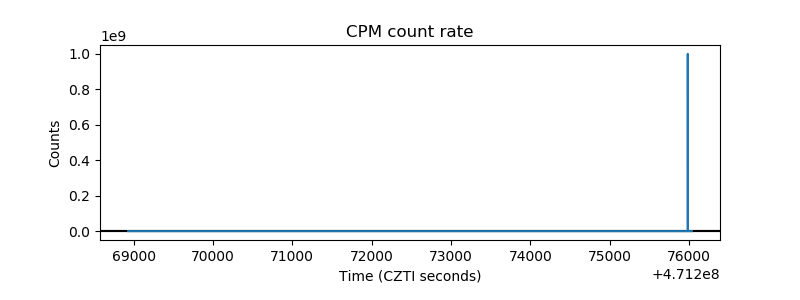 |
| CZT Counter | 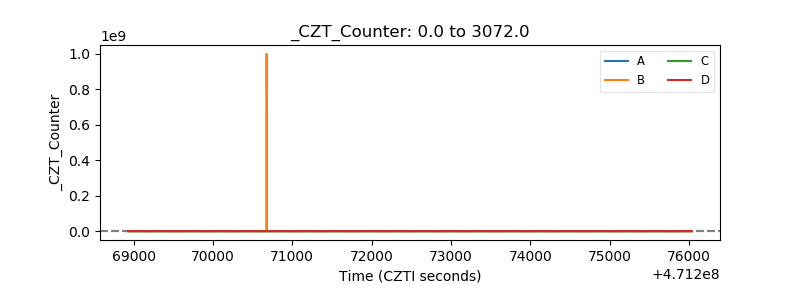 |
| +2.5 Volts monitor |  |
| +5 Volts monitor | 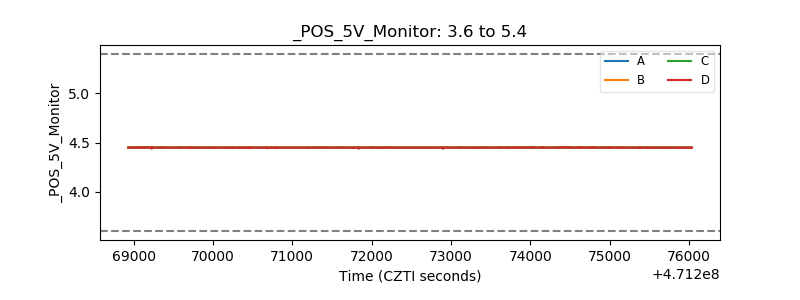 |
| _ROLL_ROT | 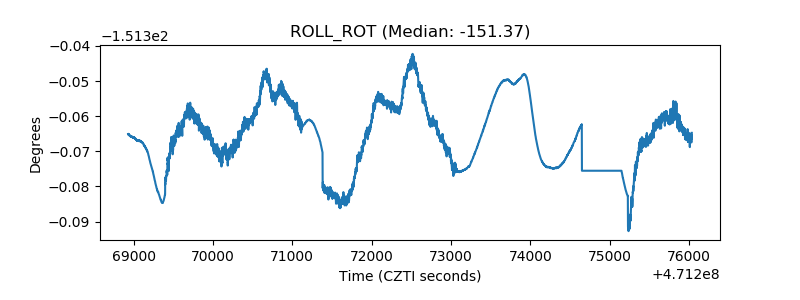 |
| _Roll_DEC | 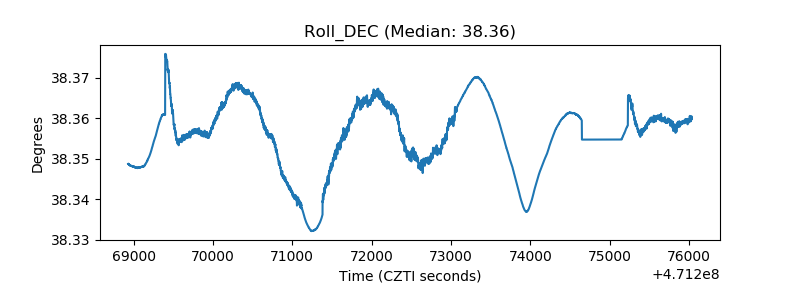 |
| _Roll_RA | 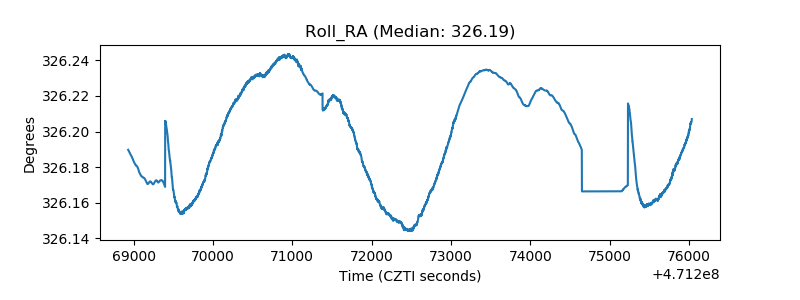 |
| Veto Counter | 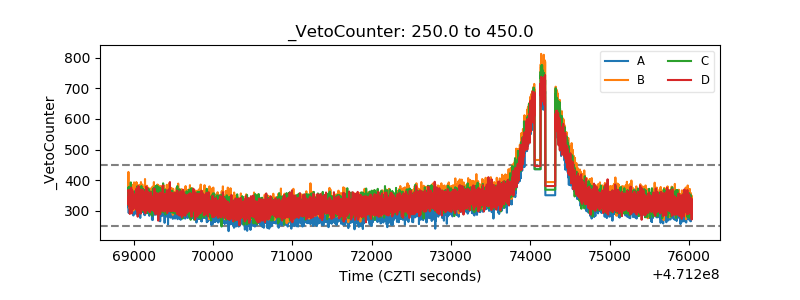 |