| Param | Original file | Final file |
|---|---|---|
| Filename | modeM0/AS1T05_233T01_9000006438_49729cztM0_level2.fits | modeM0/AS1T05_233T01_9000006438_49729cztM0_level2_quad_clean.evt |
| Size (bytes) | 1,308,205,440 | 50,483,520 |
| Size | 1.2 GB | 48.1 MB |
| Events in quadrant A | 19,290,839 | 209,396 |
| Events in quadrant B | 5,860,553 | 719,225 |
| Events in quadrant C | 6,269,815 | 5,521 |
| Events in quadrant D | 16,434,038 | 72,532 |
| Mode SS | |||
|---|---|---|---|
| Quadrant | BADHDUFLAG | Total packets | Discarded packets |
| A | 0 | 146 | 0 |
| B | 0 | 146 | 0 |
| C | 0 | 146 | 0 |
| D | 0 | 146 | 0 |
| Mode M0 | |||
|---|---|---|---|
| Quadrant | BADHDUFLAG | Total packets | Discarded packets |
| A | 0 | 62396 | 0 |
| B | 0 | 22417 | 0 |
| C | 0 | 23923 | 0 |
| D | 0 | 53855 | 0 |
| Quadrant | Total seconds | Saturated seconds | Saturation percentage |
|---|---|---|---|
| A | 7342 | 7325 | 99.768455% |
| B | 7343 | 569 | 7.748876% |
| C | 7343 | 7343 | 100.000000% |
| D | 7343 | 7343 | 100.000000% |
Noise dominated data is calculated using 1-second bins in cleaned event files. If a bin has >2000 counts, and if more than 50% of those come from <1% of pixels, then it is considered to be noise-dominated and hence unusable.
| Quadrant | # 1 sec bins | Bins with >0 counts | Bins with >2000 counts | High rate bins dominated by noise | Noise dominated (total time) | Noise dominated (detector-on time) | Marked lightcurve |
|---|---|---|---|---|---|---|---|
| A | 7341 | 7341 | 7083 | 7083 | 96.49% | 96.49% | 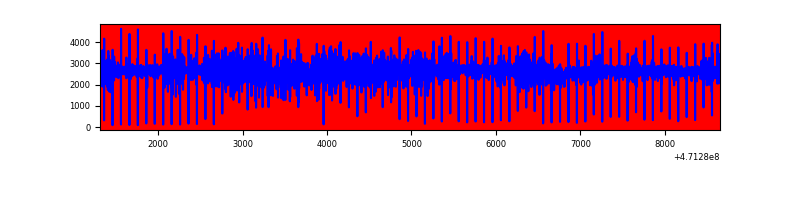 |
| B | 7343 | 7343 | 408 | 408 | 5.56% | 5.56% | 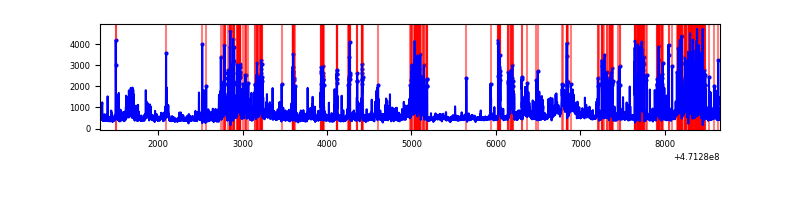 |
| C | 7342 | 7342 | 2 | 2 | 0.03% | 0.03% | 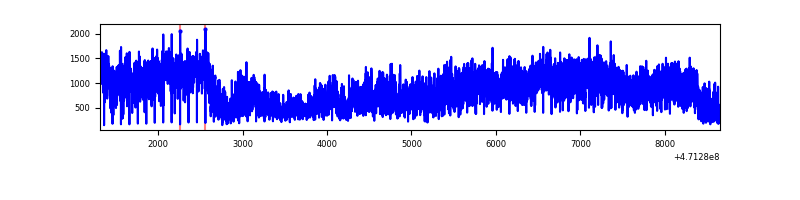 |
| D | 7343 | 7343 | 5432 | 5432 | 73.98% | 73.98% | 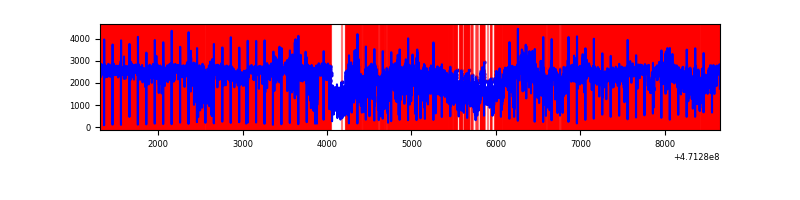 |
Top three noisy pixels from each quadrant. If the there are fewer than three noisy pixels in the level2.evt file, extra rows are filled as -1
| Pixel properties | Quadrant properties | ||||||
|---|---|---|---|---|---|---|---|
| Quadrant | DetID | PixID | Counts | Sigma | Mean | Median | Sigma |
| A | 10 | 83 | 5195166 | 69156.99 | 252 | 244 | 75.1 |
| A | 0 | 98 | 4021585 | 53533.78 | 252 | 244 | 75.1 |
| A | 0 | 99 | 2096697 | 27908.87 | 252 | 244 | 75.1 |
| B | 10 | 128 | 971598 | 6025.61 | 751 | 729 | 161.1 |
| B | 10 | 44 | 277429 | 1717.31 | 751 | 729 | 161.1 |
| B | 10 | 251 | 248365 | 1536.93 | 751 | 729 | 161.1 |
| C | 15 | 180 | 1199421 | 65154.77 | 17 | 15 | 18.4 |
| C | 15 | 190 | 1187842 | 64525.77 | 17 | 15 | 18.4 |
| C | 15 | 163 | 618941 | 33621.63 | 17 | 15 | 18.4 |
| D | 7 | 61 | 3238572 | 53848.13 | 109 | 100 | 60.1 |
| D | 15 | 168 | 2559879 | 42563.07 | 109 | 100 | 60.1 |
| D | 15 | 40 | 1909108 | 31742.29 | 109 | 100 | 60.1 |
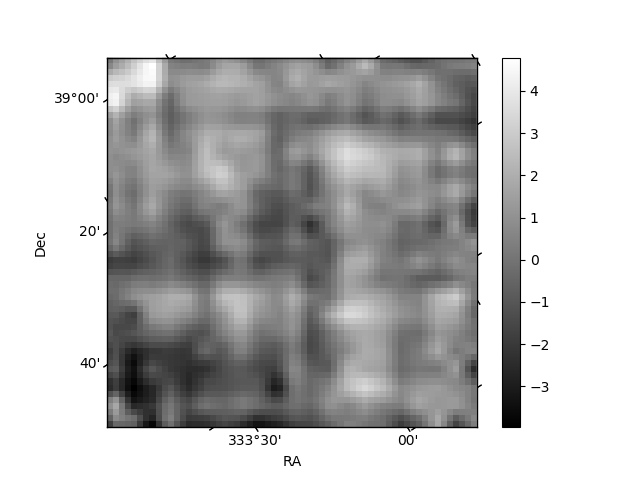
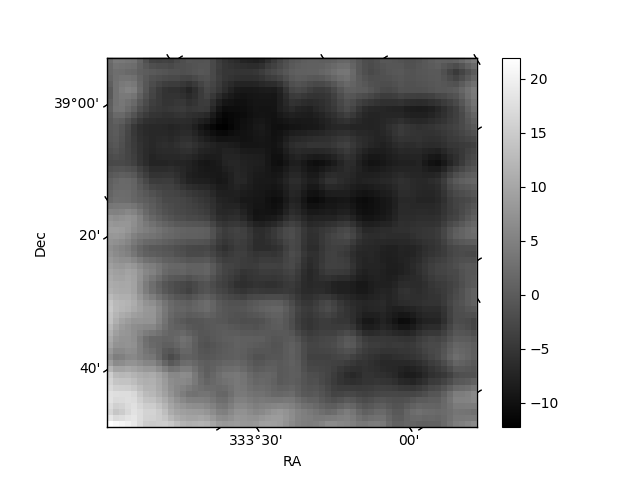
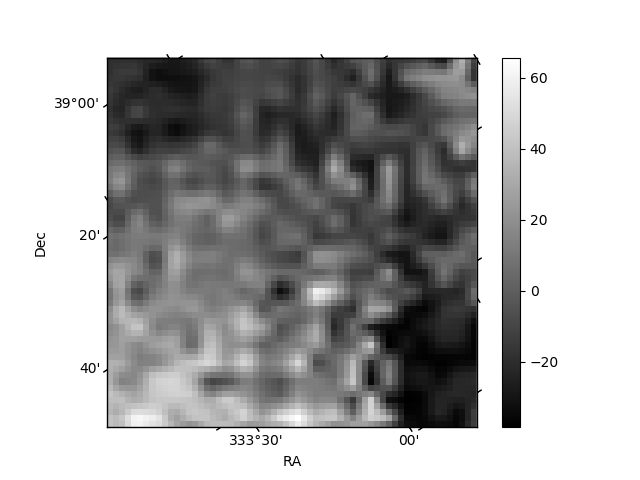
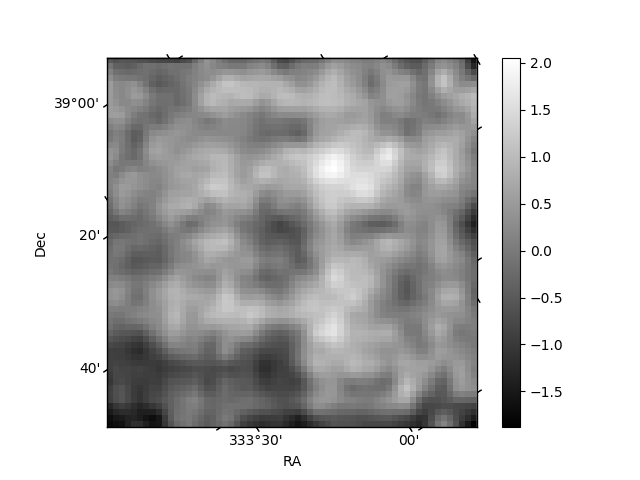
Histogram calculated using DETX and DETY for each event in the final _common_clean file
| Quadrant A | 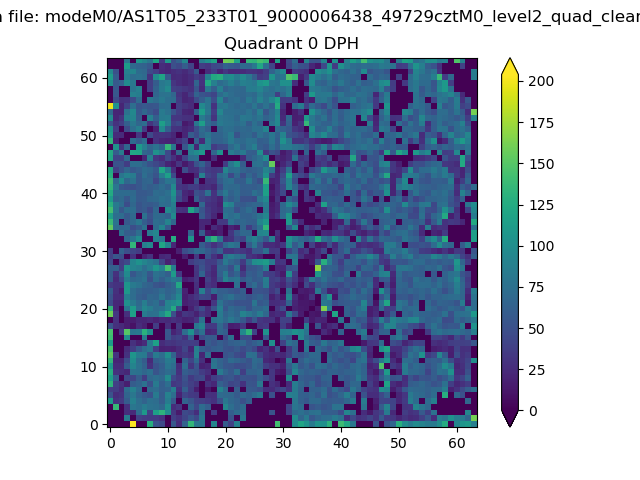 |
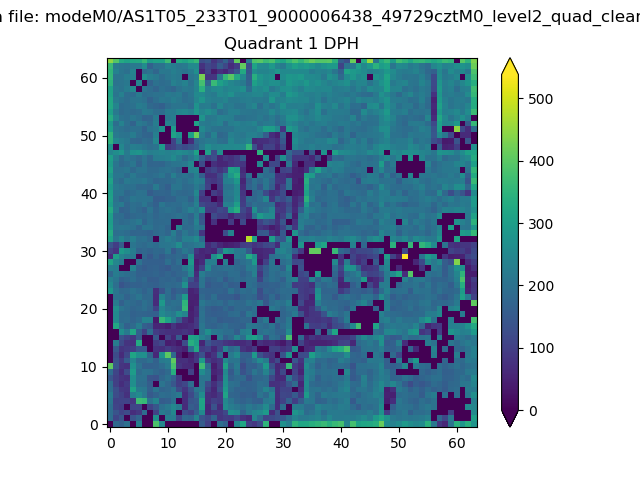 |
Quadrant B |
|---|---|---|---|
| Quadrant D | 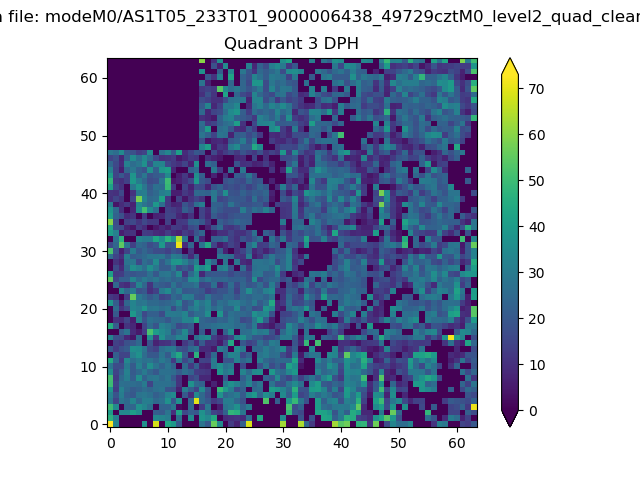 |
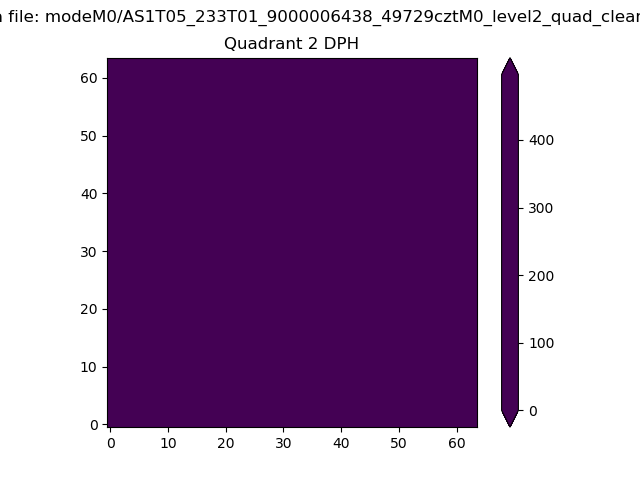 |
Quadrant C |
| Plot type | Count rate plots | Images |
|---|---|---|
| Comparison with Poisson distribution Blue bars denote a histogram of data divided into 1 sec bins. Red curve is a Poisson curve with rate = median count rate of data. |
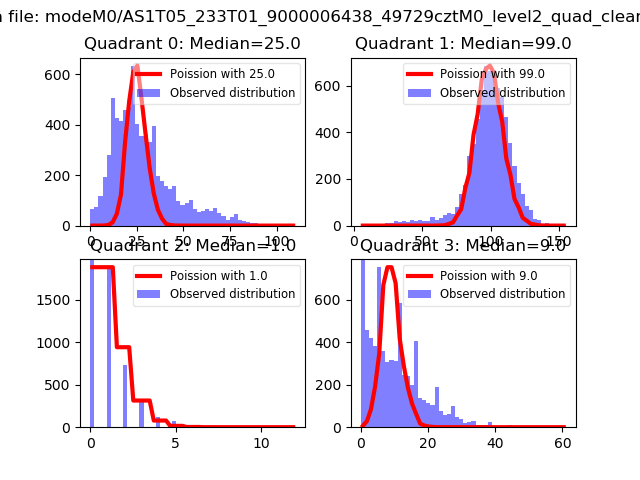 |
 |
| Quadrant-wise count rates Data is divided into 100 sec bins |
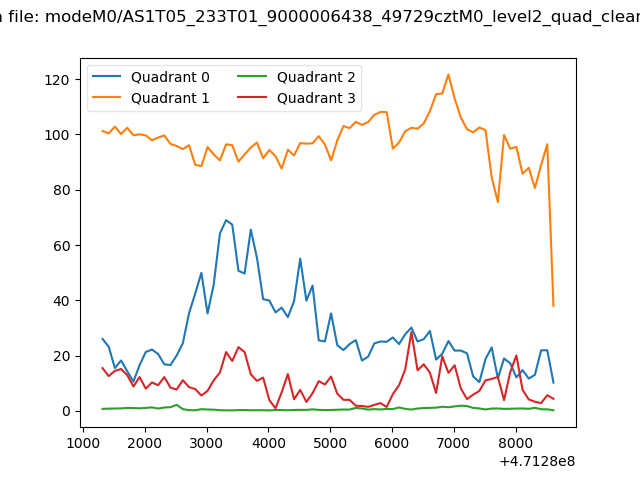 |
|
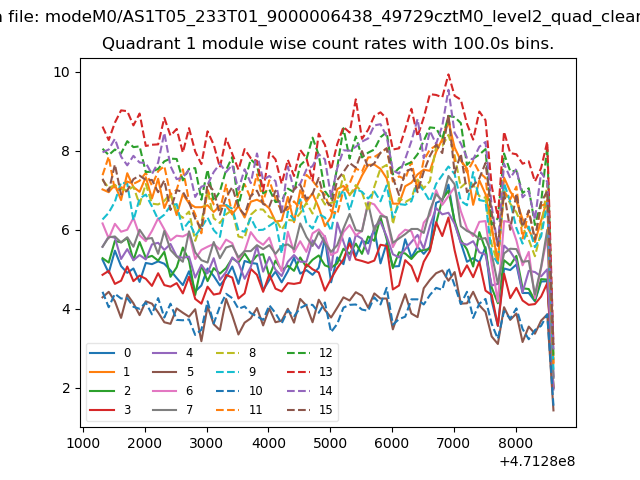
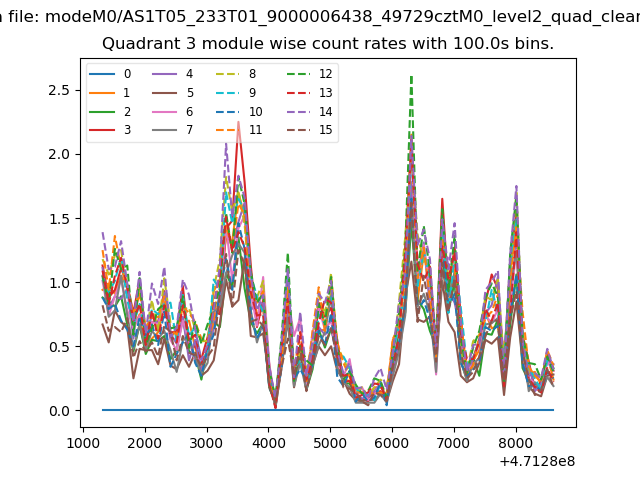
| Module-wise count rates for Quadrant A Data is divided into 100 sec bins |
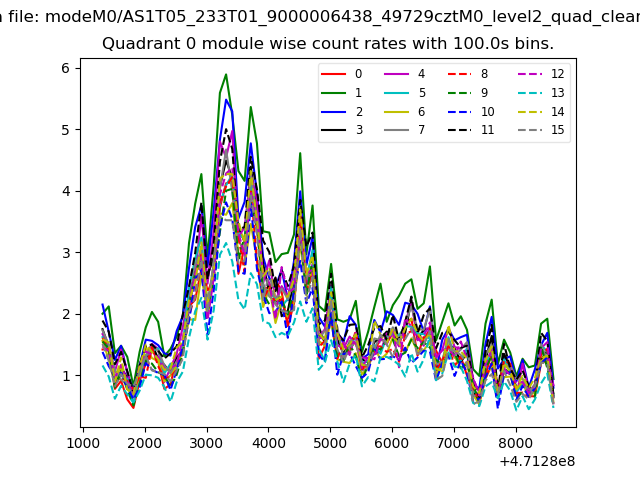 |
 |
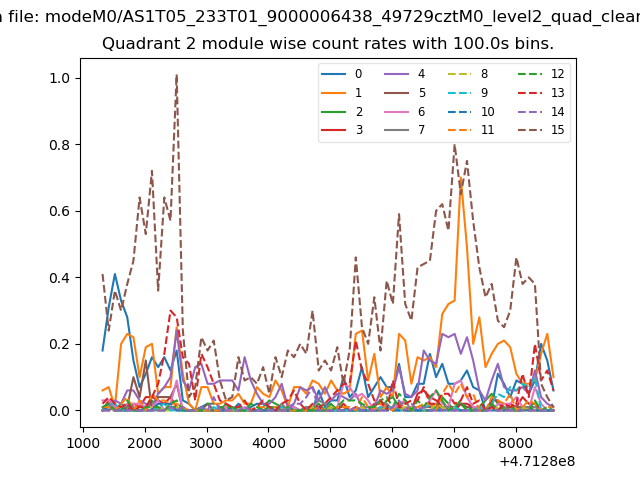
| Module-wise count rates for Quadrant B Data is divided into 100 sec bins |
 |
 |
| Module-wise count rates for Quadrant C Data is divided into 100 sec bins |
 |
 |
| Module-wise count rates for Quadrant D Data is divided into 100 sec bins |
 |
 |
| Parameter | Plot |
|---|---|
| CZT HV Monitor | 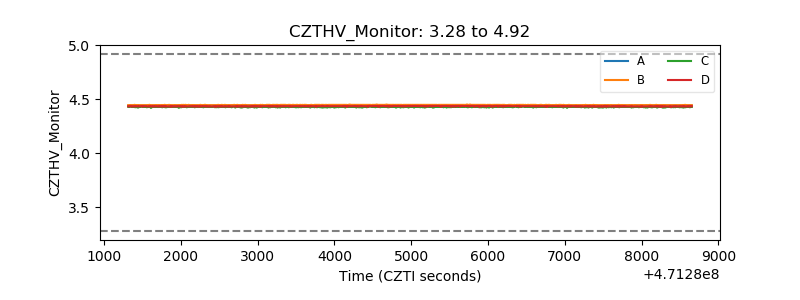 |
| D_VDD | 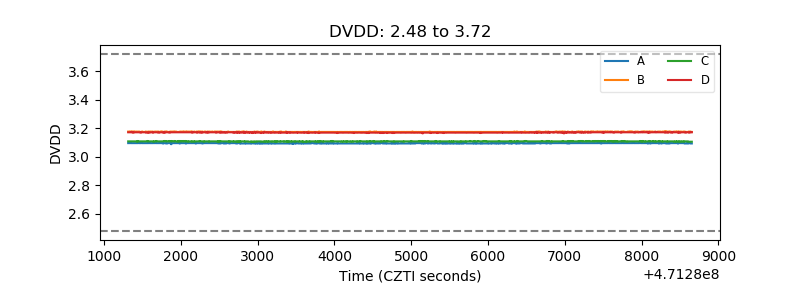 |
| Temperature 1 | 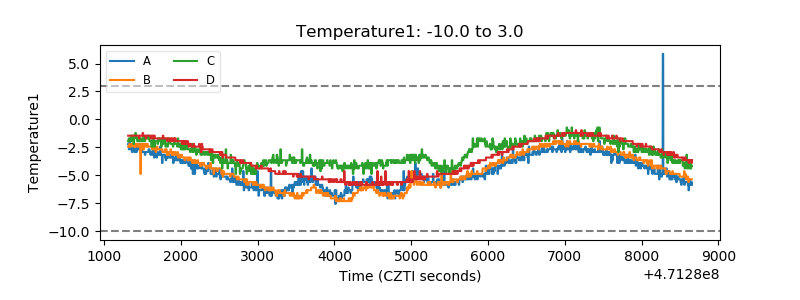 |
| Veto HV Monitor | 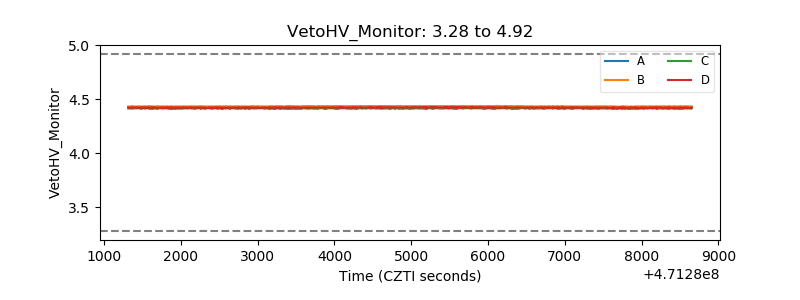 |
| Veto LLD | 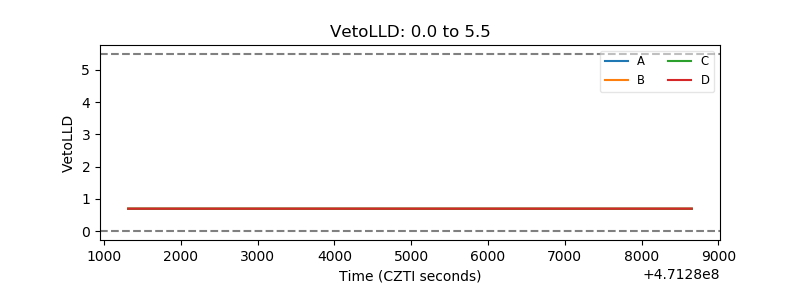 |
| Alpha Counter | 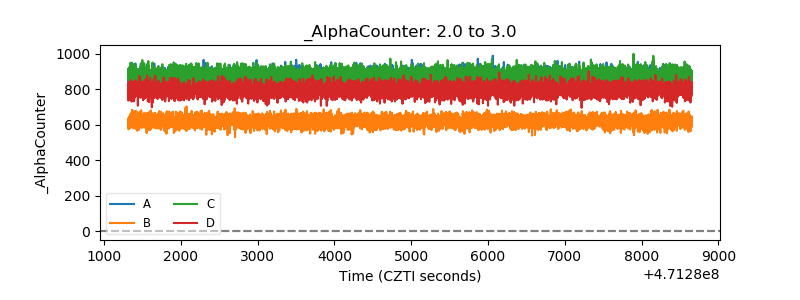 |
| _CPM_Rate | 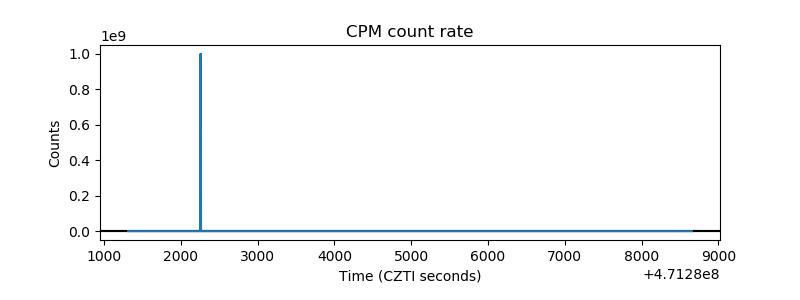 |
| CZT Counter | 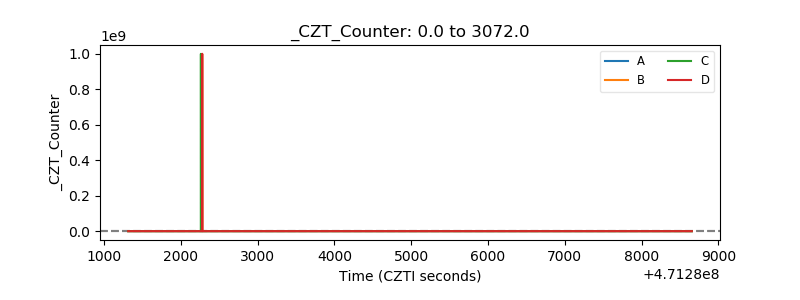 |
| +2.5 Volts monitor | 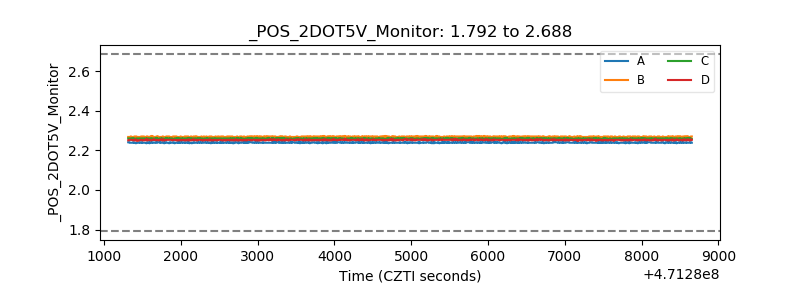 |
| +5 Volts monitor | 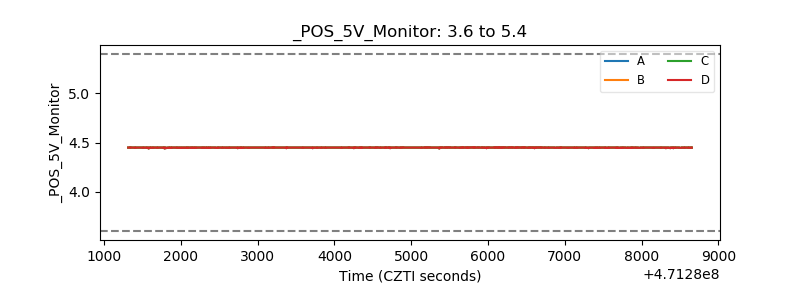 |
| _ROLL_ROT | 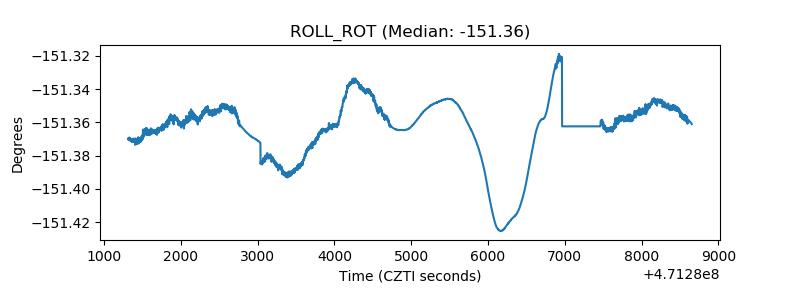 |
| _Roll_DEC | 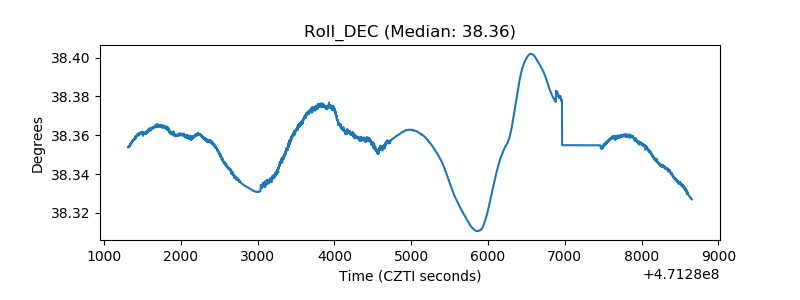 |
| _Roll_RA | 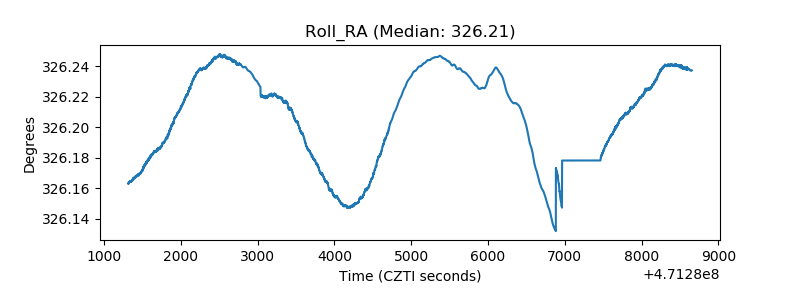 |
| Veto Counter | 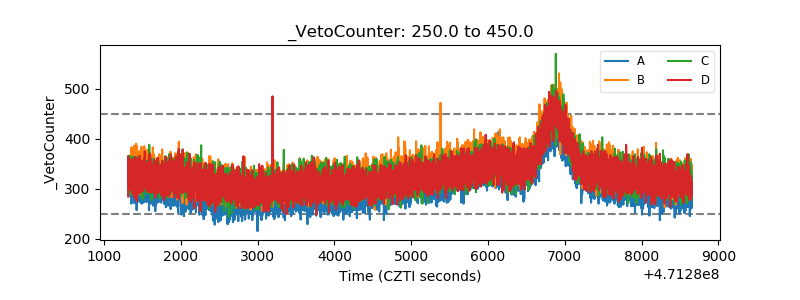 |