| Param | Original file | Final file |
|---|---|---|
| Filename | modeM0/AS1T05_233T01_9000006438_49732cztM0_level2.fits | modeM0/AS1T05_233T01_9000006438_49732cztM0_level2_quad_clean.evt |
| Size (bytes) | 3,020,774,400 | 90,515,520 |
| Size | 2.8 GB | 86.3 MB |
| Events in quadrant A | 42,225,804 | 32,285 |
| Events in quadrant B | 11,498,477 | 1,548,348 |
| Events in quadrant C | 19,452,444 | 515 |
| Events in quadrant D | 37,373,351 | 25,535 |
| Mode M9 | |||
|---|---|---|---|
| Quadrant | BADHDUFLAG | Total packets | Discarded packets |
| A | 0 | 5 | 0 |
| B | 0 | 5 | 0 |
| C | 0 | 5 | 0 |
| D | 0 | 5 | 0 |
| Mode SS | |||
|---|---|---|---|
| Quadrant | BADHDUFLAG | Total packets | Discarded packets |
| A | 0 | 332 | 0 |
| B | 0 | 332 | 0 |
| C | 0 | 332 | 0 |
| D | 0 | 332 | 0 |
| Mode M0 | |||
|---|---|---|---|
| Quadrant | BADHDUFLAG | Total packets | Discarded packets |
| A | 0 | 136779 | 2 |
| B | 0 | 45412 | 2 |
| C | 0 | 69462 | 2 |
| D | 0 | 122283 | 2 |
| Quadrant | Total seconds | Saturated seconds | Saturation percentage |
|---|---|---|---|
| A | 16429 | 16201 | 98.612210% |
| B | 16429 | 932 | 5.672895% |
| C | 16430 | 16427 | 99.981741% |
| D | 16430 | 16212 | 98.673159% |
Noise dominated data is calculated using 1-second bins in cleaned event files. If a bin has >2000 counts, and if more than 50% of those come from <1% of pixels, then it is considered to be noise-dominated and hence unusable.
| Quadrant | # 1 sec bins | Bins with >0 counts | Bins with >2000 counts | High rate bins dominated by noise | Noise dominated (total time) | Noise dominated (detector-on time) | Marked lightcurve |
|---|---|---|---|---|---|---|---|
| A | 16928 | 16430 | 15275 | 15275 | 90.24% | 92.97% | 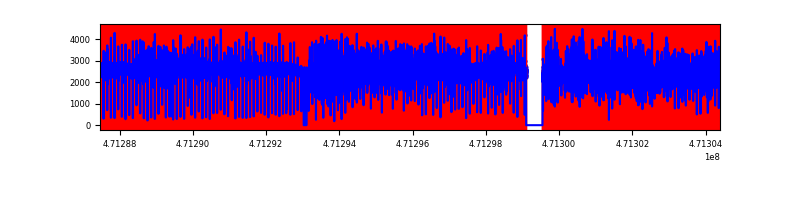 |
| B | 16929 | 16433 | 685 | 685 | 4.05% | 4.17% | 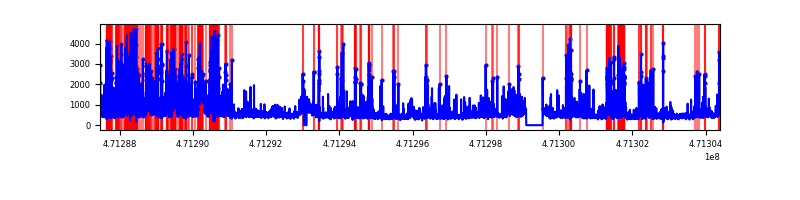 |
| C | 16929 | 16431 | 898 | 898 | 5.30% | 5.47% | 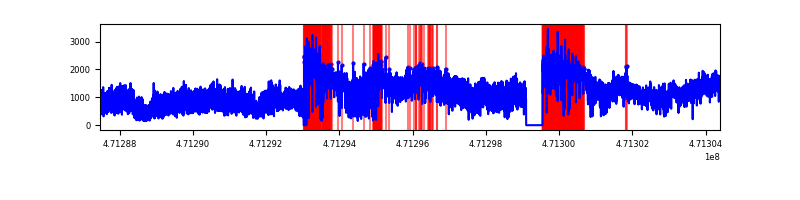 |
| D | 16929 | 16431 | 12378 | 12378 | 73.12% | 75.33% | 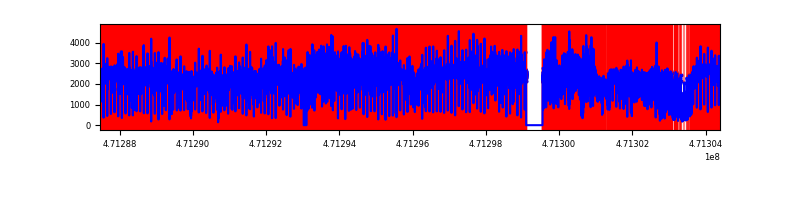 |
Top three noisy pixels from each quadrant. If the there are fewer than three noisy pixels in the level2.evt file, extra rows are filled as -1
| Pixel properties | Quadrant properties | ||||||
|---|---|---|---|---|---|---|---|
| Quadrant | DetID | PixID | Counts | Sigma | Mean | Median | Sigma |
| A | 10 | 83 | 12780041 | 56634.72 | 726 | 697 | 225.6 |
| A | 0 | 99 | 9118386 | 40407.22 | 726 | 697 | 225.6 |
| A | 12 | 50 | 3539566 | 15683.34 | 726 | 697 | 225.6 |
| B | 10 | 128 | 1713075 | 4781.14 | 1692 | 1641 | 358.0 |
| B | 7 | 0 | 430887 | 1199.16 | 1692 | 1641 | 358.0 |
| B | 10 | 45 | 365004 | 1015.11 | 1692 | 1641 | 358.0 |
| C | 15 | 180 | 4377190 | 59417.61 | 87 | 78 | 73.7 |
| C | 15 | 190 | 3744297 | 50826.33 | 87 | 78 | 73.7 |
| C | 15 | 181 | 1696125 | 23023.18 | 87 | 78 | 73.7 |
| D | 7 | 61 | 5652127 | 29952.79 | 412 | 384 | 188.7 |
| D | 15 | 40 | 3825431 | 20271.77 | 412 | 384 | 188.7 |
| D | 15 | 168 | 3753620 | 19891.19 | 412 | 384 | 188.7 |
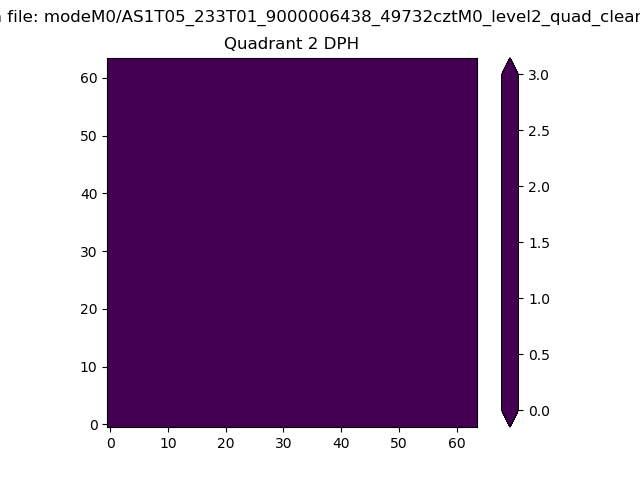
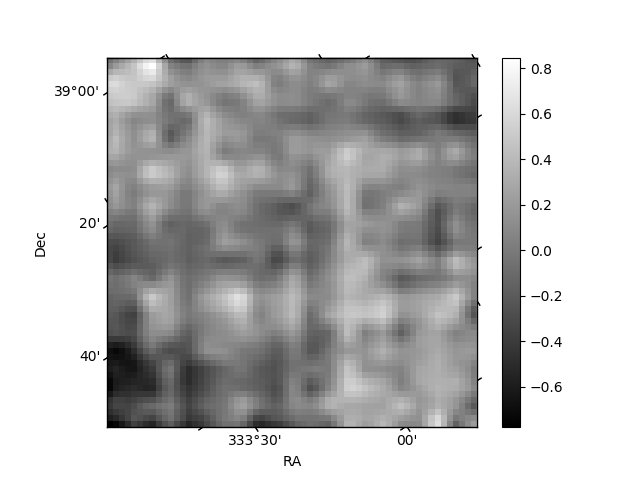
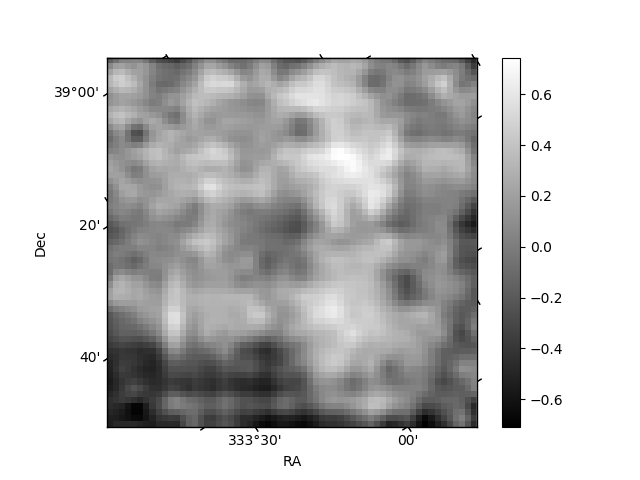
Histogram calculated using DETX and DETY for each event in the final _common_clean file
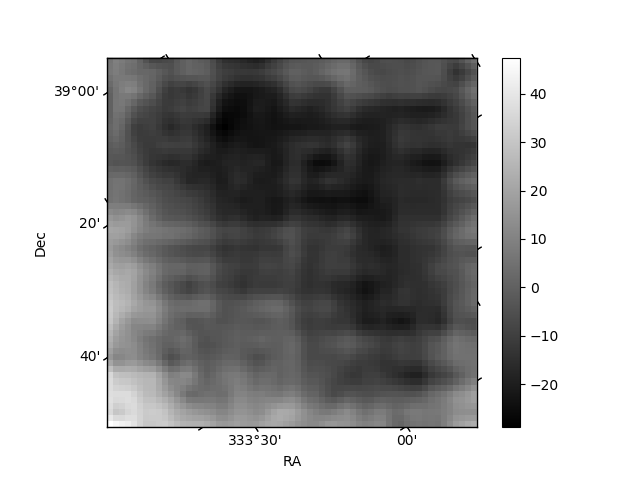
| Quadrant A | 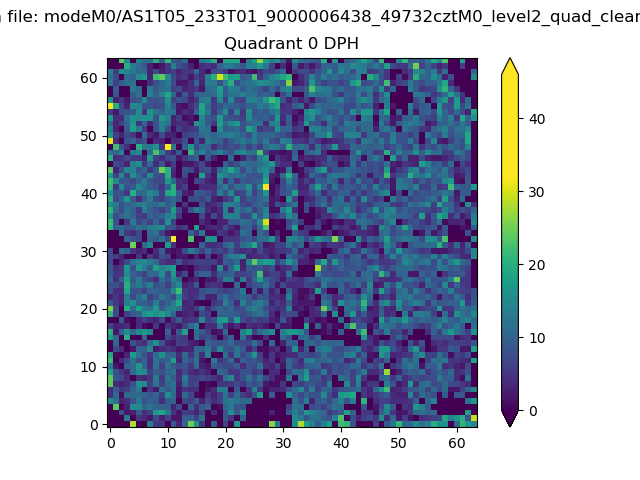 |
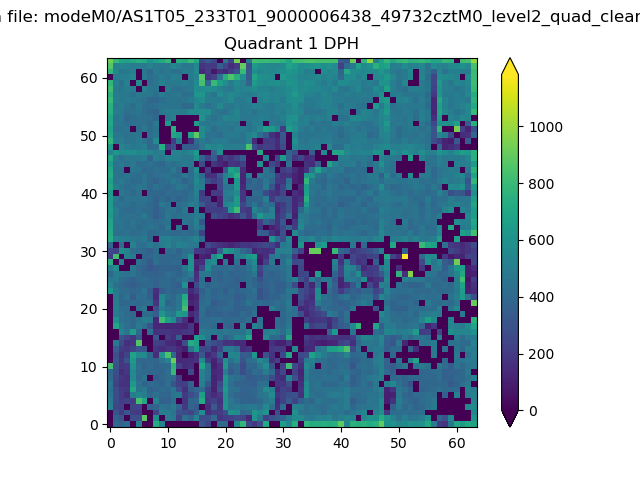 |
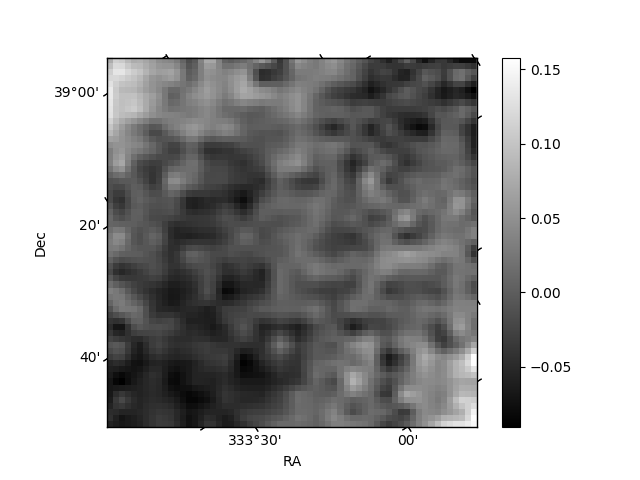
Quadrant B |
|---|---|---|---|
| Quadrant D | 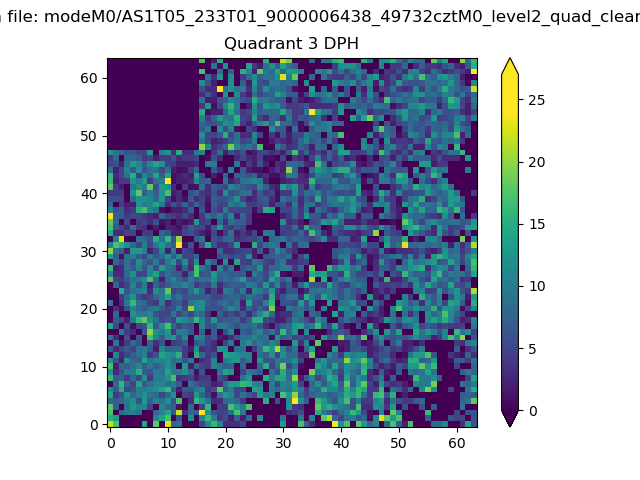 |
 |
Quadrant C |
| Plot type | Count rate plots | Images |
|---|---|---|
| Comparison with Poisson distribution Blue bars denote a histogram of data divided into 1 sec bins. Red curve is a Poisson curve with rate = median count rate of data. |
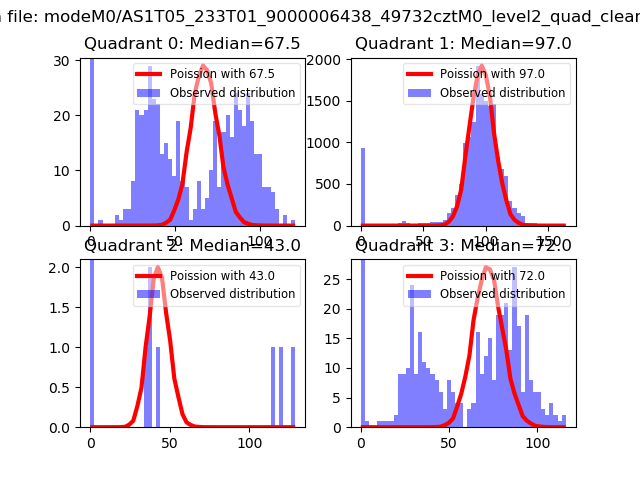 |
 |
| Quadrant-wise count rates Data is divided into 100 sec bins |
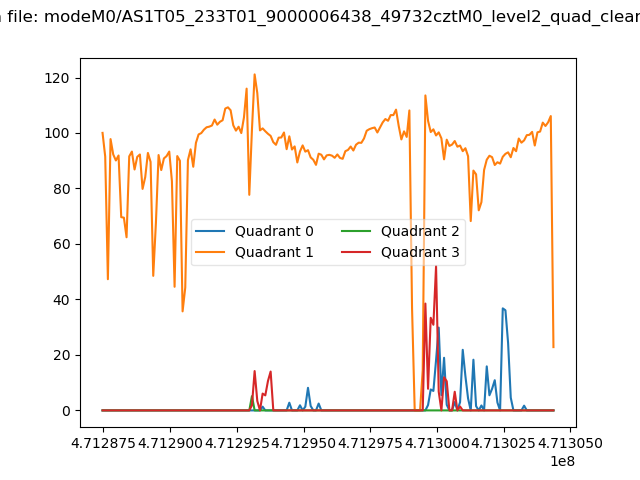 |
|
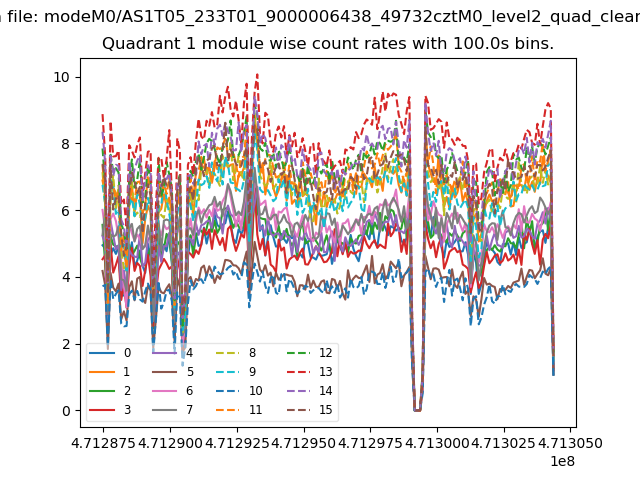
| Module-wise count rates for Quadrant A Data is divided into 100 sec bins |
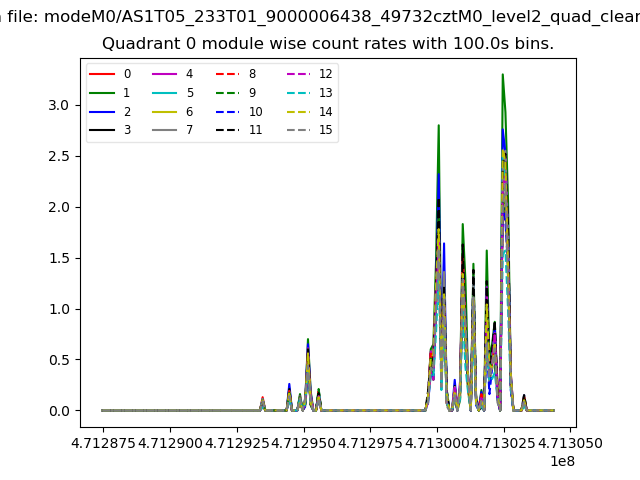 |
 |
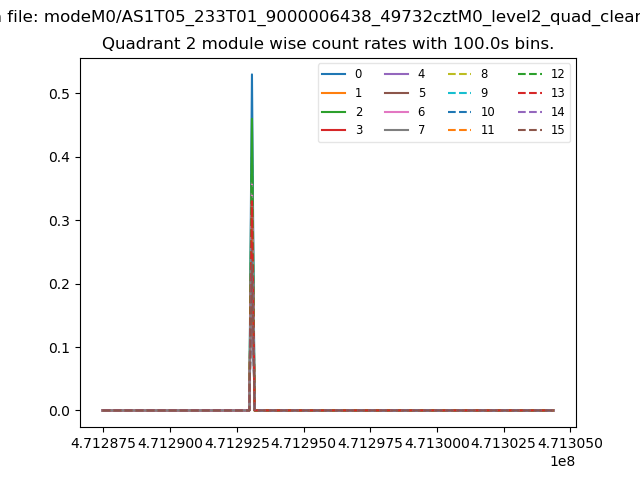
| Module-wise count rates for Quadrant B Data is divided into 100 sec bins |
 |
 |
| Module-wise count rates for Quadrant C Data is divided into 100 sec bins |
 |
 |
| Module-wise count rates for Quadrant D Data is divided into 100 sec bins |
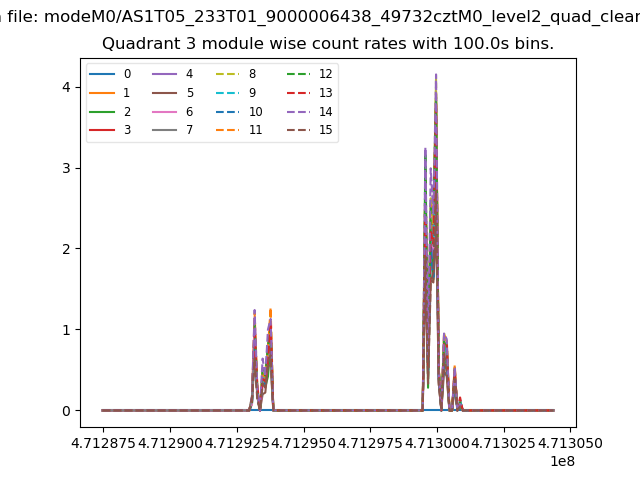 |
 |
| Parameter | Plot |
|---|---|
| CZT HV Monitor | 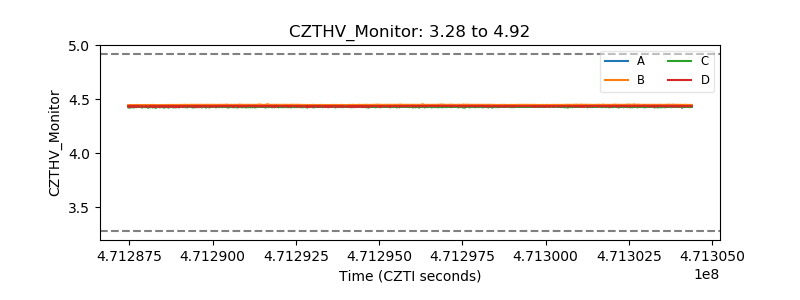 |
| D_VDD | 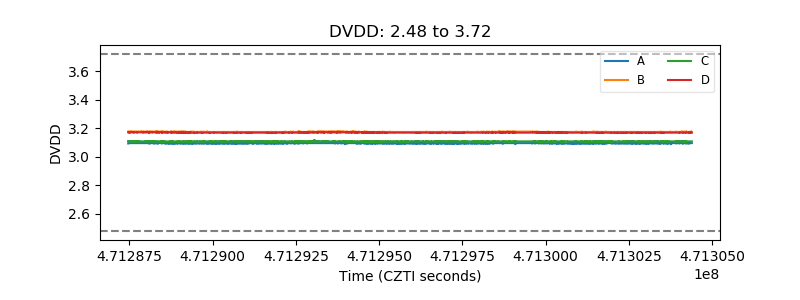 |
| Temperature 1 | 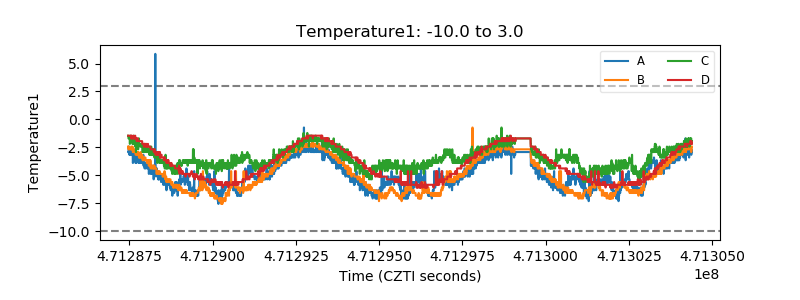 |
| Veto HV Monitor | 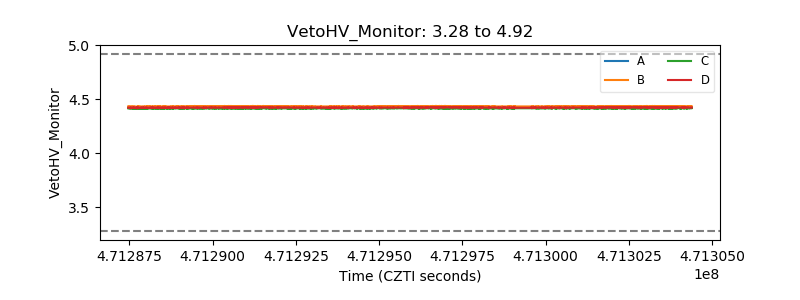 |
| Veto LLD | 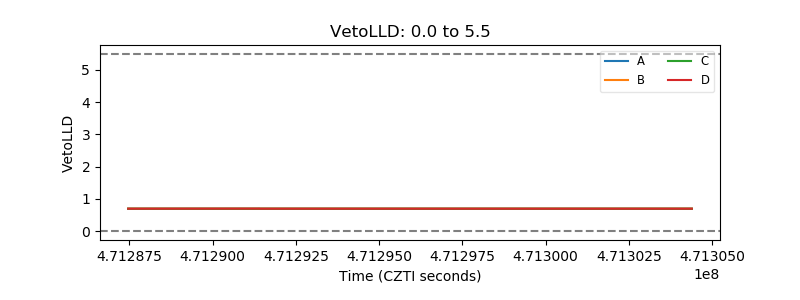 |
| Alpha Counter | 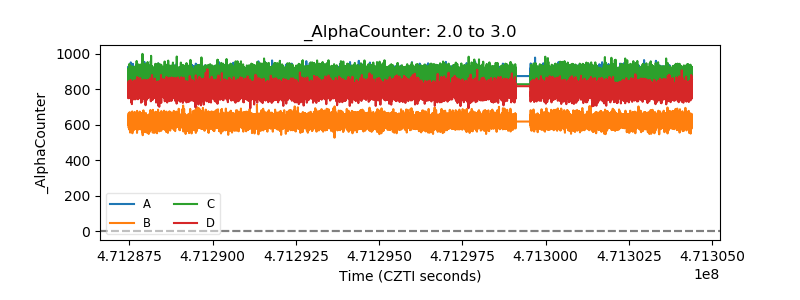 |
| _CPM_Rate | 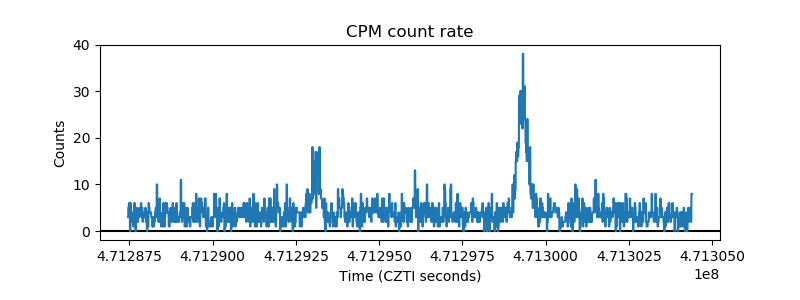 |
| CZT Counter | 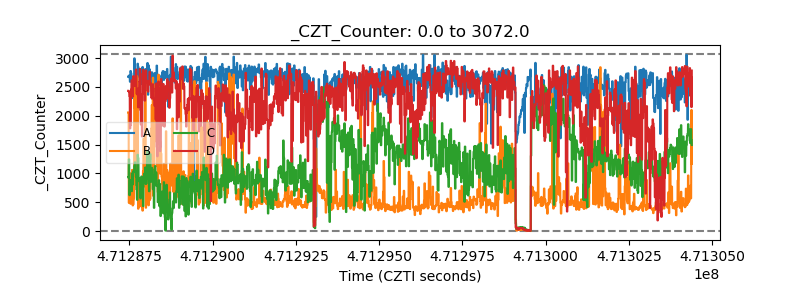 |
| +2.5 Volts monitor | 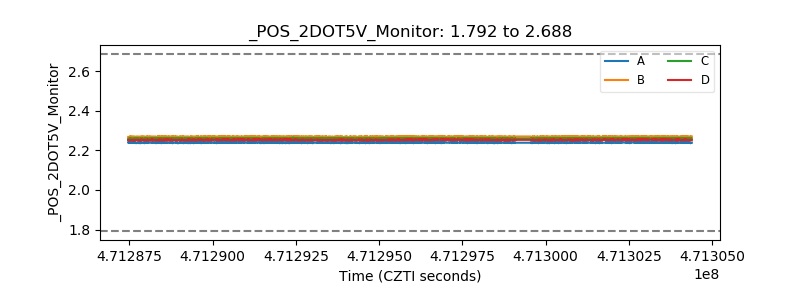 |
| +5 Volts monitor | 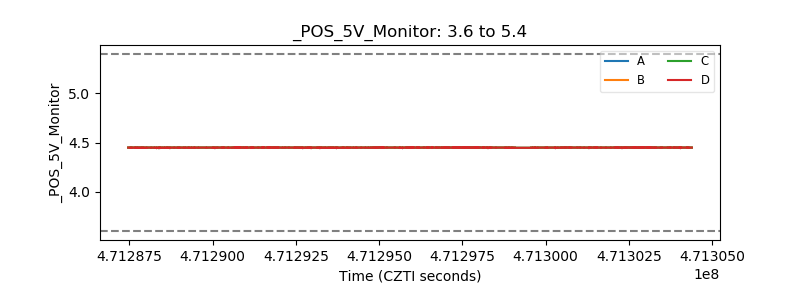 |
| _ROLL_ROT | 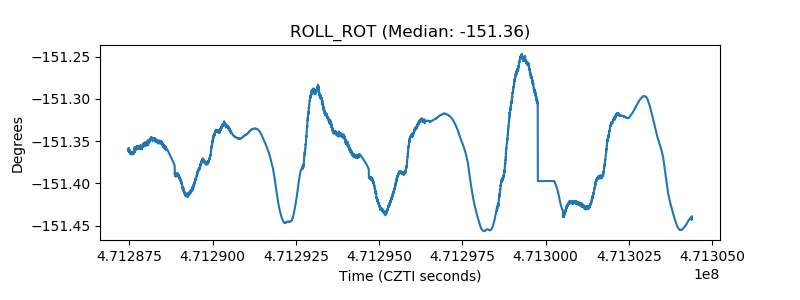 |
| _Roll_DEC | 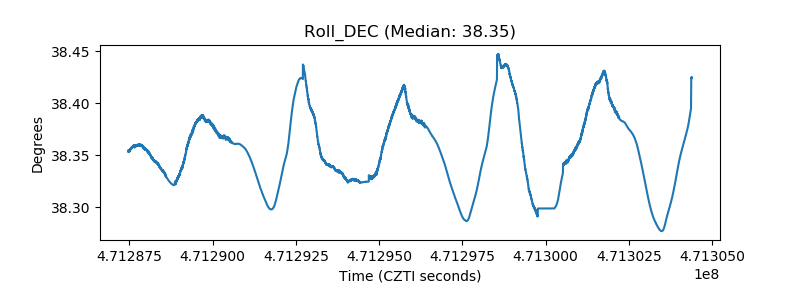 |
| _Roll_RA | 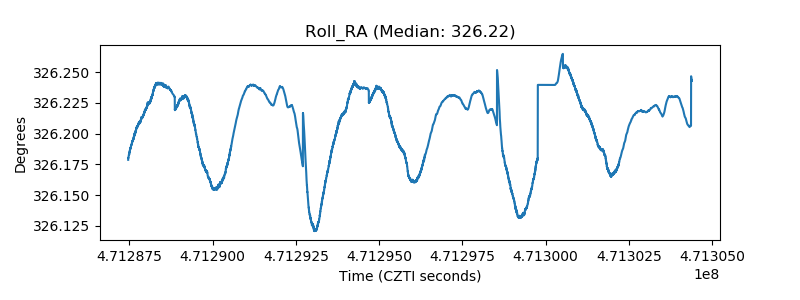 |
| Veto Counter | 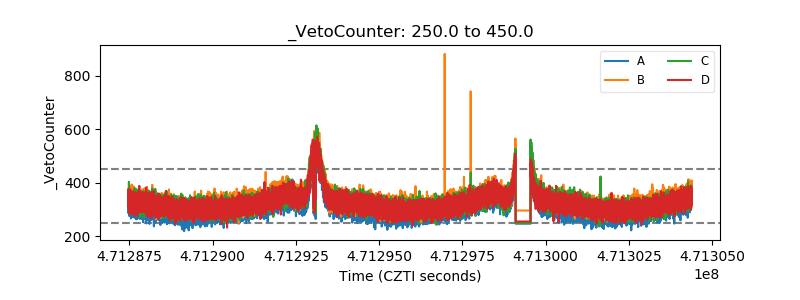 |