| Param | Original file | Final file |
|---|---|---|
| Filename | modeM0/AS1T05_233T01_9000006438_49733cztM0_level2.fits | modeM0/AS1T05_233T01_9000006438_49733cztM0_level2_quad_clean.evt |
| Size (bytes) | 1,576,226,880 | 52,790,400 |
| Size | 1.5 GB | 50.3 MB |
| Events in quadrant A | 19,514,896 | 197,341 |
| Events in quadrant B | 6,100,933 | 807,615 |
| Events in quadrant C | 13,059,447 | 4,820 |
| Events in quadrant D | 19,031,467 | 12,601 |
| Mode M9 | |||
|---|---|---|---|
| Quadrant | BADHDUFLAG | Total packets | Discarded packets |
| A | 0 | 16 | 0 |
| B | 0 | 16 | 0 |
| C | 0 | 16 | 0 |
| D | 0 | 16 | 0 |
| Mode SS | |||
|---|---|---|---|
| Quadrant | BADHDUFLAG | Total packets | Discarded packets |
| A | 0 | 168 | 0 |
| B | 0 | 168 | 0 |
| C | 0 | 168 | 0 |
| D | 0 | 168 | 0 |
| Mode M0 | |||
|---|---|---|---|
| Quadrant | BADHDUFLAG | Total packets | Discarded packets |
| A | 0 | 63646 | 2 |
| B | 0 | 23878 | 2 |
| C | 0 | 44601 | 4 |
| D | 0 | 62245 | 2 |
| Quadrant | Total seconds | Saturated seconds | Saturation percentage |
|---|---|---|---|
| A | 8286 | 6642 | 80.159305% |
| B | 8287 | 455 | 5.490527% |
| C | 8286 | 8251 | 99.577601% |
| D | 8286 | 8175 | 98.660391% |
Noise dominated data is calculated using 1-second bins in cleaned event files. If a bin has >2000 counts, and if more than 50% of those come from <1% of pixels, then it is considered to be noise-dominated and hence unusable.
| Quadrant | # 1 sec bins | Bins with >0 counts | Bins with >2000 counts | High rate bins dominated by noise | Noise dominated (total time) | Noise dominated (detector-on time) | Marked lightcurve |
|---|---|---|---|---|---|---|---|
| A | 9796 | 8286 | 7001 | 7001 | 71.47% | 84.49% | 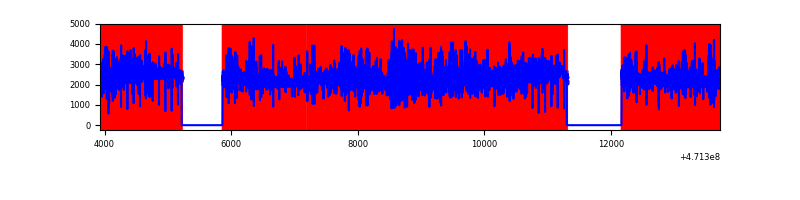 |
| B | 9797 | 8289 | 254 | 254 | 2.59% | 3.06% | 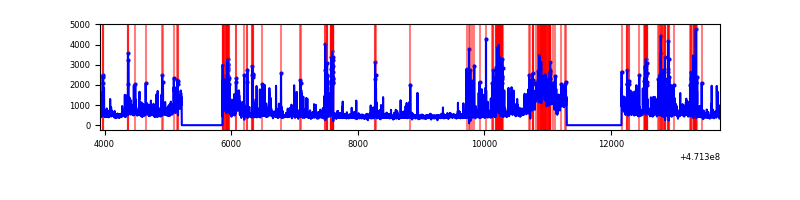 |
| C | 9795 | 8285 | 1446 | 1446 | 14.76% | 17.45% | 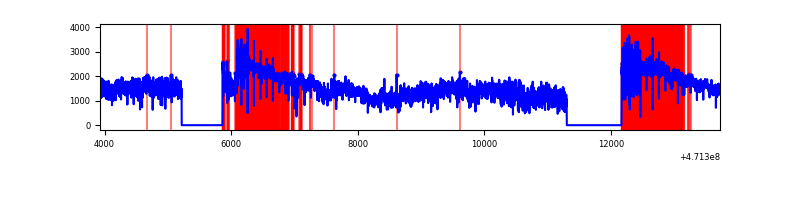 |
| D | 9795 | 8285 | 6369 | 6369 | 65.02% | 76.87% | 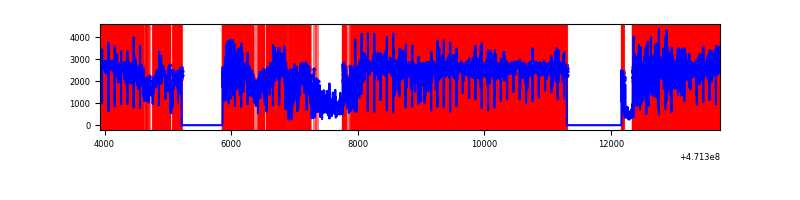 |
Top three noisy pixels from each quadrant. If the there are fewer than three noisy pixels in the level2.evt file, extra rows are filled as -1
| Pixel properties | Quadrant properties | ||||||
|---|---|---|---|---|---|---|---|
| Quadrant | DetID | PixID | Counts | Sigma | Mean | Median | Sigma |
| A | 10 | 83 | 9450410 | 55900.07 | 608 | 590 | 169.0 |
| A | 0 | 98 | 1335618 | 7897.31 | 608 | 590 | 169.0 |
| A | 3 | 130 | 1179078 | 6971.3 | 608 | 590 | 169.0 |
| B | 10 | 128 | 1104682 | 5992.11 | 878 | 850 | 184.2 |
| B | 5 | 49 | 345935 | 1873.28 | 878 | 850 | 184.2 |
| B | 10 | 251 | 248136 | 1342.38 | 878 | 850 | 184.2 |
| C | 15 | 180 | 4279196 | 59457.42 | 95 | 86 | 72.0 |
| C | 15 | 190 | 2055498 | 28559.56 | 95 | 86 | 72.0 |
| C | 15 | 163 | 762901 | 10599.17 | 95 | 86 | 72.0 |
| D | 15 | 40 | 3910199 | 46813.5 | 217 | 206 | 83.5 |
| D | 7 | 61 | 3353073 | 40143.15 | 217 | 206 | 83.5 |
| D | 15 | 168 | 1696096 | 20304.53 | 217 | 206 | 83.5 |
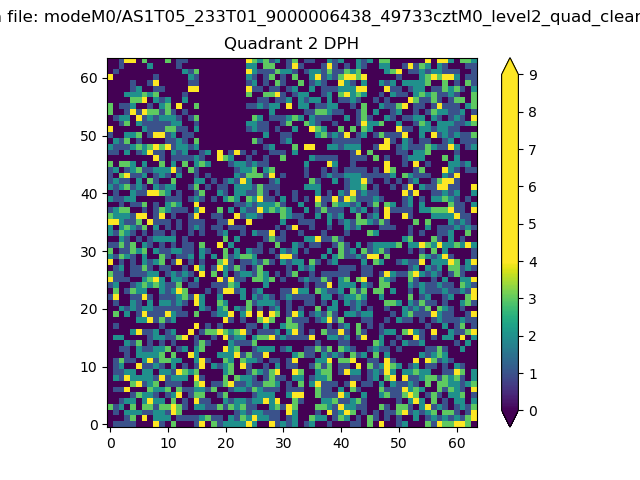
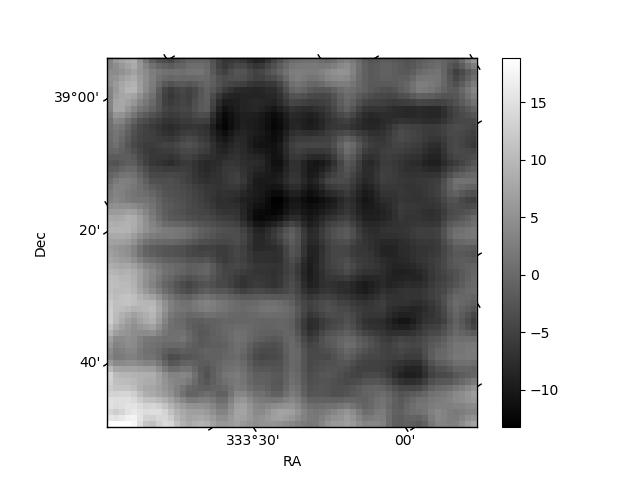
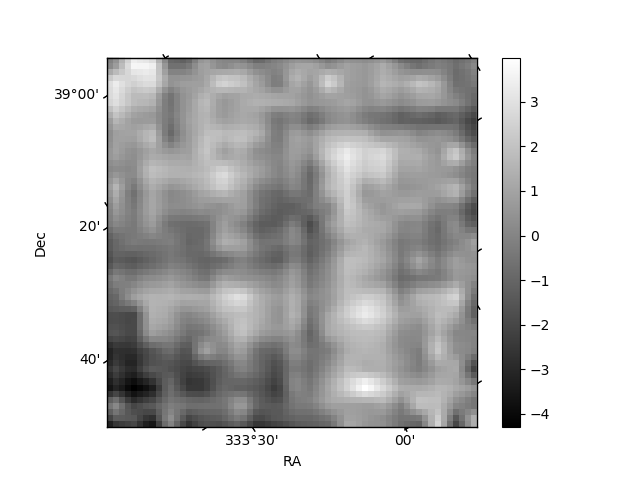
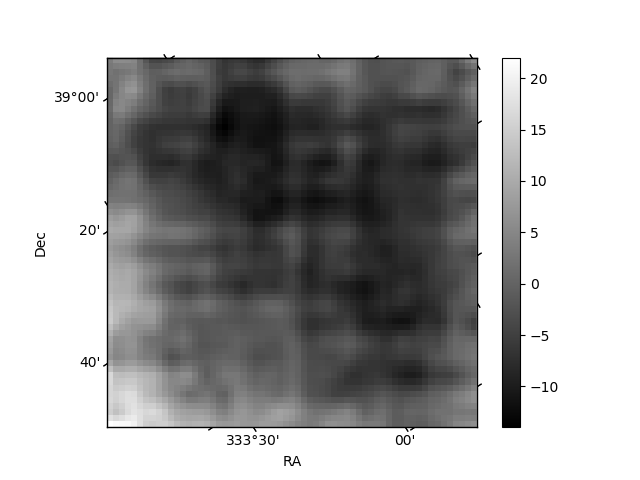
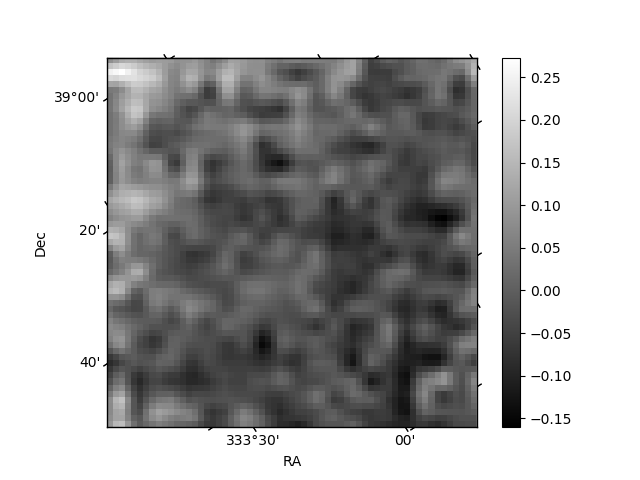
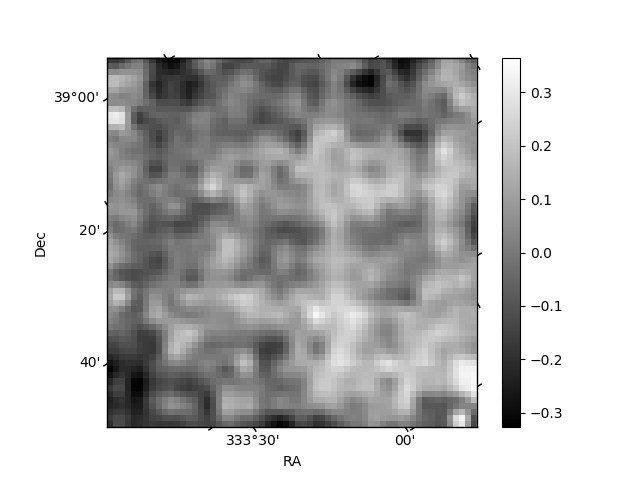
Histogram calculated using DETX and DETY for each event in the final _common_clean file
| Quadrant A | 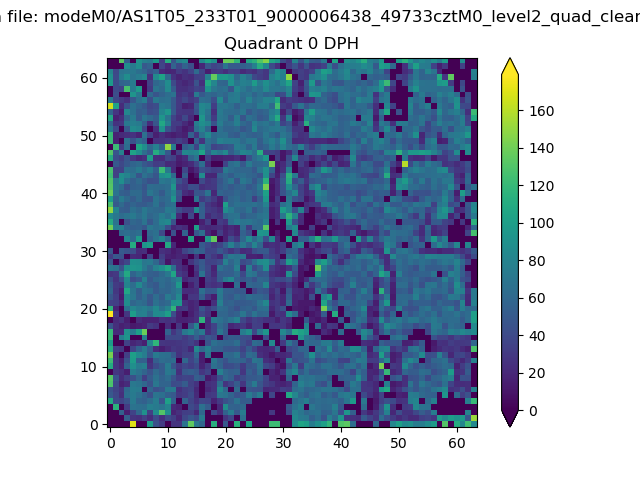 |
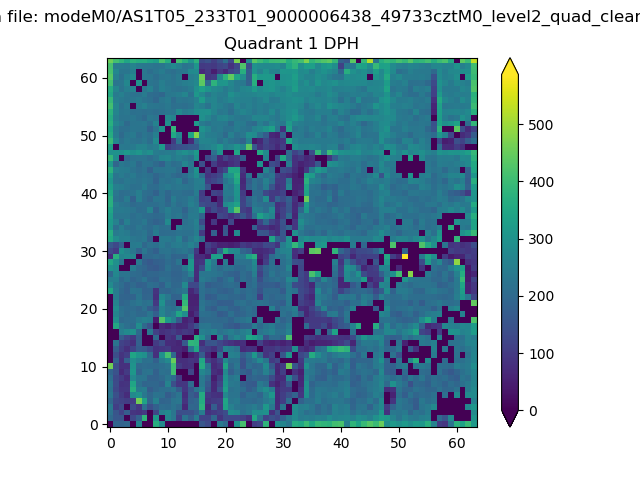 |
Quadrant B |
|---|---|---|---|
| Quadrant D | 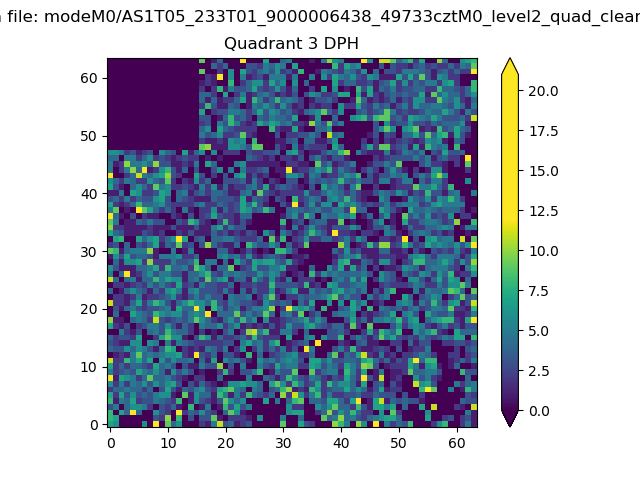 |
 |
Quadrant C |
| Plot type | Count rate plots | Images |
|---|---|---|
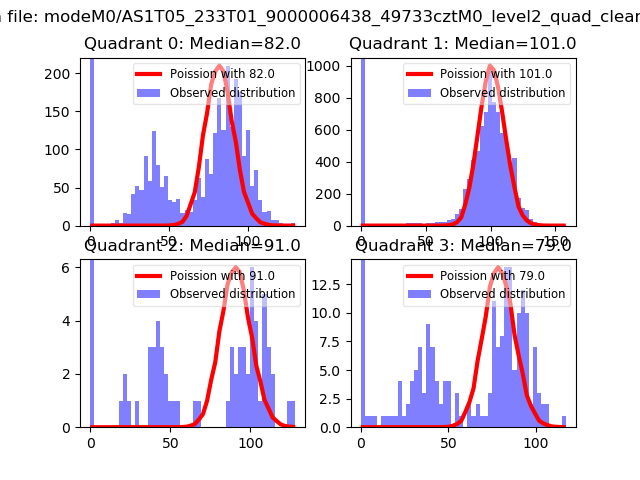
| Comparison with Poisson distribution Blue bars denote a histogram of data divided into 1 sec bins. Red curve is a Poisson curve with rate = median count rate of data. |
 |
 |
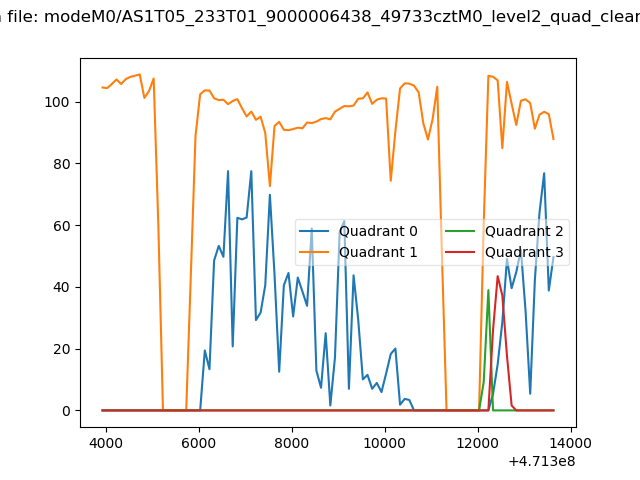
| Quadrant-wise count rates Data is divided into 100 sec bins |
 |
|
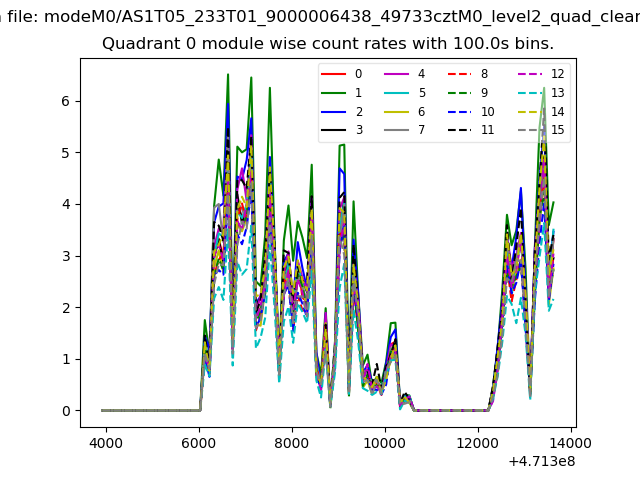
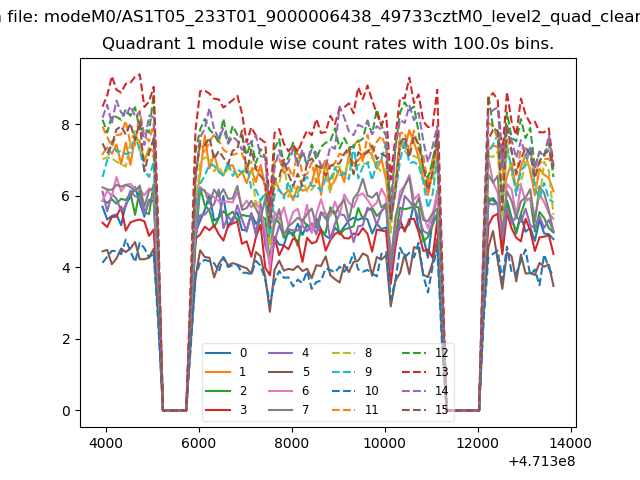
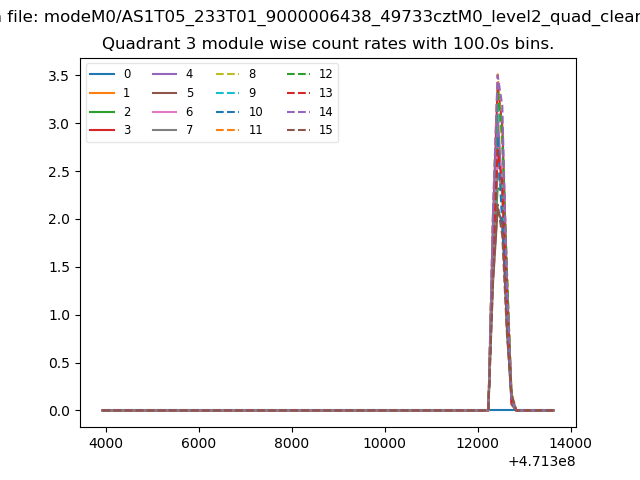
| Module-wise count rates for Quadrant A Data is divided into 100 sec bins |
 |
 |
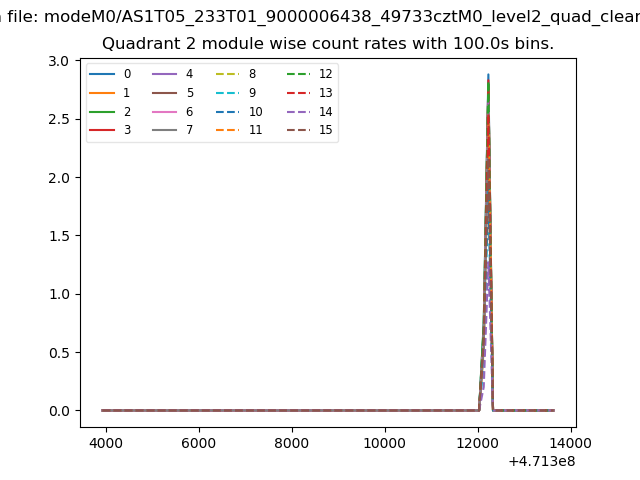
| Module-wise count rates for Quadrant B Data is divided into 100 sec bins |
 |
 |
| Module-wise count rates for Quadrant C Data is divided into 100 sec bins |
 |
 |
| Module-wise count rates for Quadrant D Data is divided into 100 sec bins |
 |
 |
| Parameter | Plot |
|---|---|
| CZT HV Monitor | 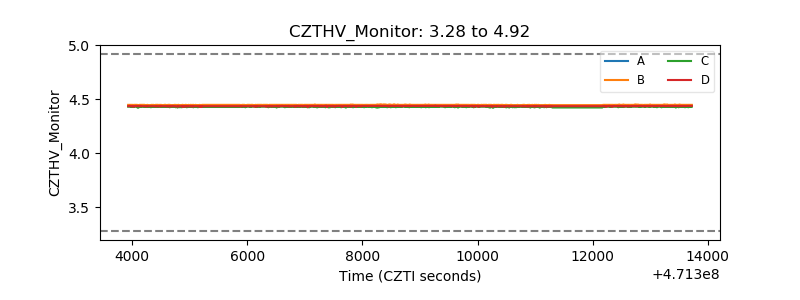 |
| D_VDD | 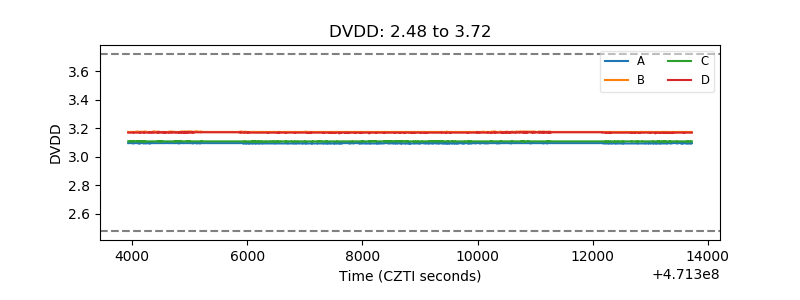 |
| Temperature 1 | 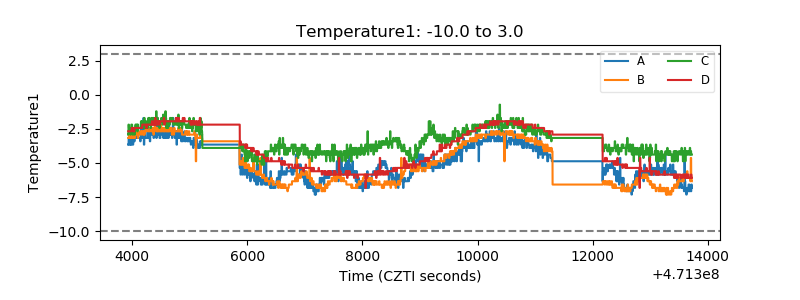 |
| Veto HV Monitor | 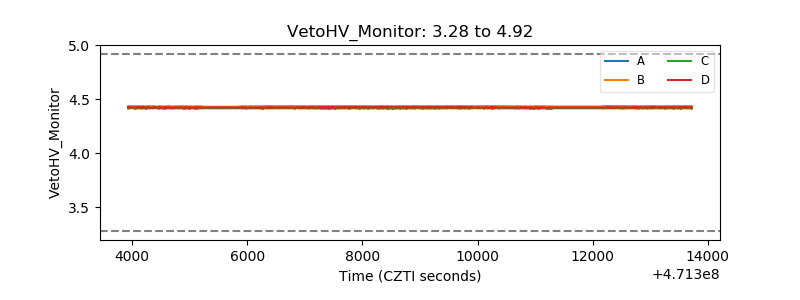 |
| Veto LLD | 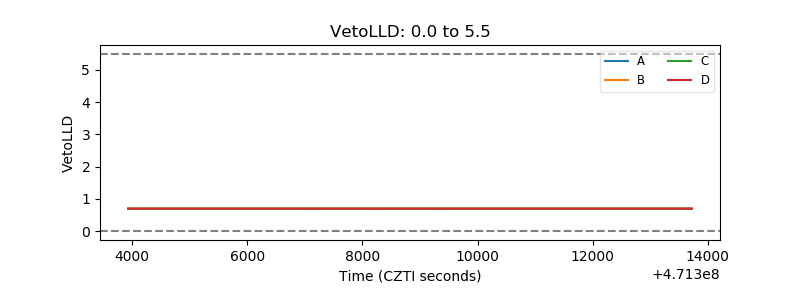 |
| Alpha Counter | 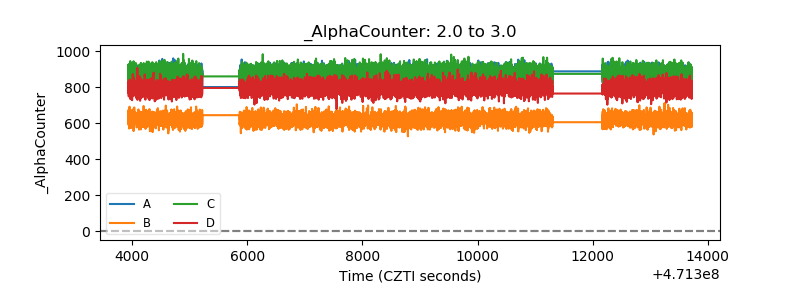 |
| _CPM_Rate | 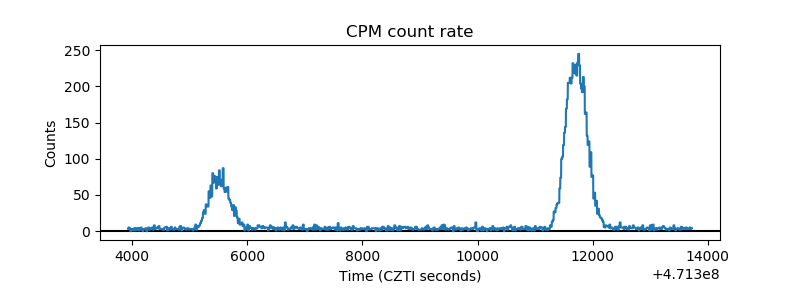 |
| CZT Counter |  |
| +2.5 Volts monitor | 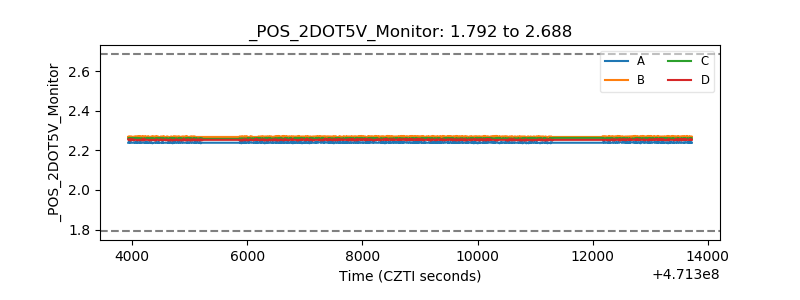 |
| +5 Volts monitor | 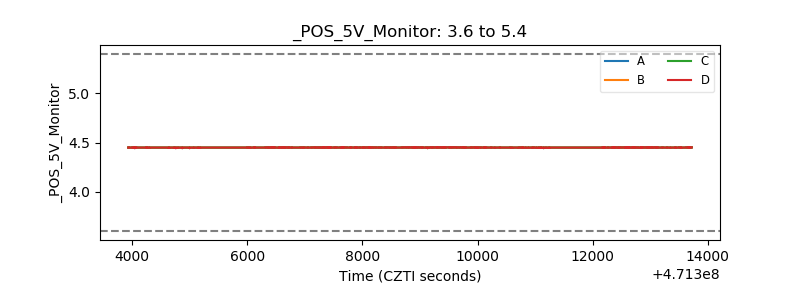 |
| _ROLL_ROT | 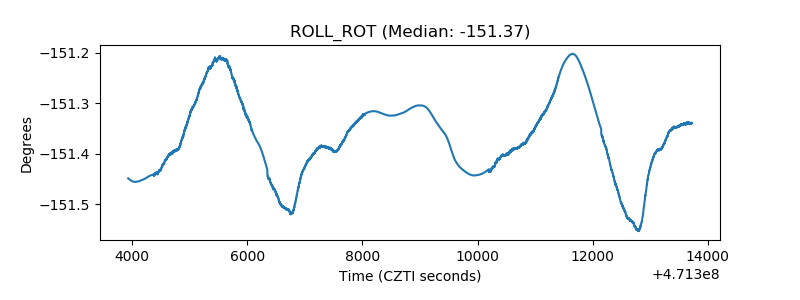 |
| _Roll_DEC | 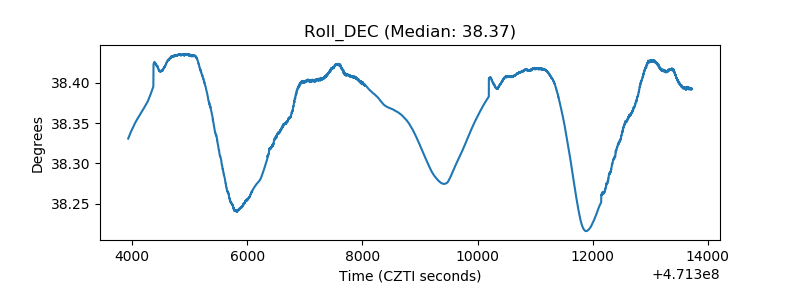 |
| _Roll_RA | 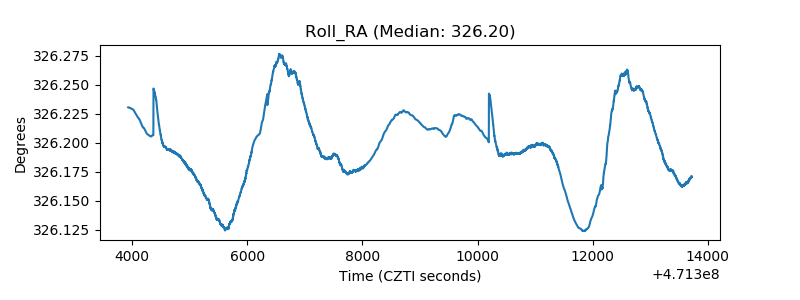 |
| Veto Counter | 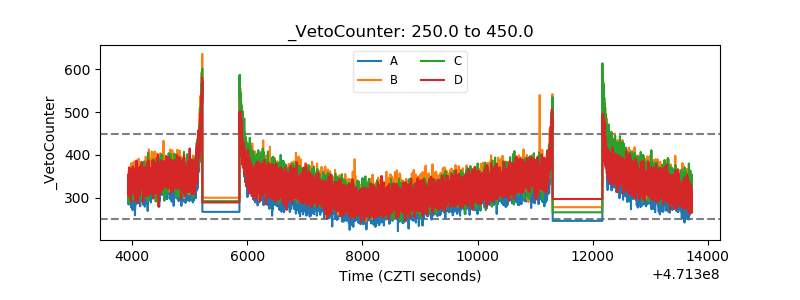 |