| Param | Original file | Final file |
|---|---|---|
| Filename | modeM0/AS1T05_233T01_9000006438_49734cztM0_level2.fits | modeM0/AS1T05_233T01_9000006438_49734cztM0_level2_quad_clean.evt |
| Size (bytes) | 1,232,740,800 | 40,155,840 |
| Size | 1.1 GB | 38.3 MB |
| Events in quadrant A | 13,748,507 | 227,194 |
| Events in quadrant B | 6,909,622 | 548,511 |
| Events in quadrant C | 9,033,083 | 2,880 |
| Events in quadrant D | 15,466,080 | 7,281 |
| Mode M9 | |||
|---|---|---|---|
| Quadrant | BADHDUFLAG | Total packets | Discarded packets |
| A | 0 | 10 | 0 |
| B | 0 | 10 | 0 |
| C | 0 | 10 | 0 |
| D | 0 | 10 | 0 |
| Mode SS | |||
|---|---|---|---|
| Quadrant | BADHDUFLAG | Total packets | Discarded packets |
| A | 0 | 124 | 0 |
| B | 0 | 124 | 0 |
| C | 0 | 124 | 0 |
| D | 0 | 124 | 0 |
| Mode M0 | |||
|---|---|---|---|
| Quadrant | BADHDUFLAG | Total packets | Discarded packets |
| A | 0 | 45023 | 1 |
| B | 0 | 24861 | 3 |
| C | 0 | 31159 | 1 |
| D | 0 | 50149 | 1 |
| Quadrant | Total seconds | Saturated seconds | Saturation percentage |
|---|---|---|---|
| A | 6153 | 4226 | 68.681944% |
| B | 6152 | 988 | 16.059818% |
| C | 6152 | 6132 | 99.674902% |
| D | 6152 | 6090 | 98.992198% |
Noise dominated data is calculated using 1-second bins in cleaned event files. If a bin has >2000 counts, and if more than 50% of those come from <1% of pixels, then it is considered to be noise-dominated and hence unusable.
| Quadrant | # 1 sec bins | Bins with >0 counts | Bins with >2000 counts | High rate bins dominated by noise | Noise dominated (total time) | Noise dominated (detector-on time) | Marked lightcurve |
|---|---|---|---|---|---|---|---|
| A | 7123 | 6153 | 4628 | 4628 | 64.97% | 75.22% | 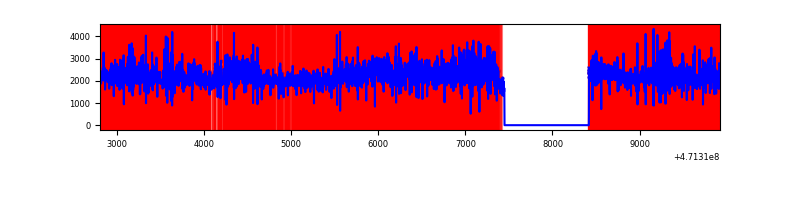 |
| B | 7122 | 6153 | 711 | 711 | 9.98% | 11.56% | 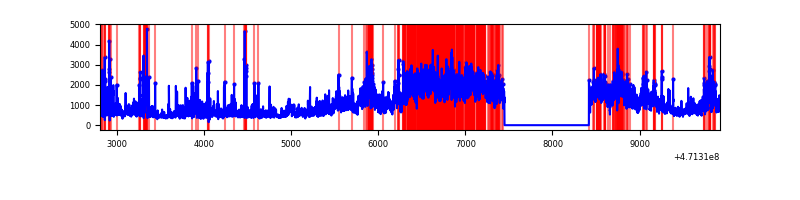 |
| C | 7121 | 6151 | 811 | 811 | 11.39% | 13.18% | 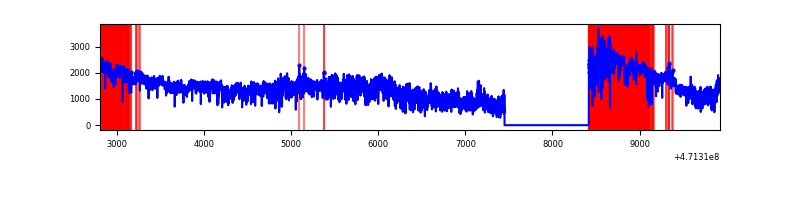 |
| D | 7122 | 6152 | 5541 | 5541 | 77.80% | 90.07% | 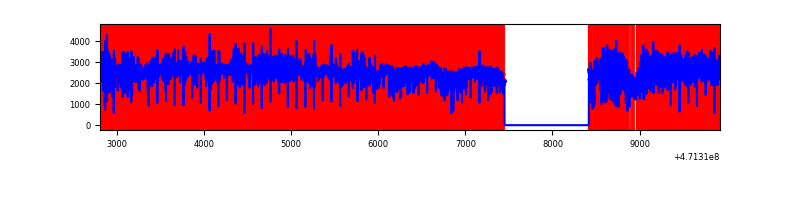 |
Top three noisy pixels from each quadrant. If the there are fewer than three noisy pixels in the level2.evt file, extra rows are filled as -1
| Pixel properties | Quadrant properties | ||||||
|---|---|---|---|---|---|---|---|
| Quadrant | DetID | PixID | Counts | Sigma | Mean | Median | Sigma |
| A | 10 | 83 | 8058989 | 57337.84 | 531 | 516 | 140.5 |
| A | 12 | 50 | 842627 | 5991.8 | 531 | 516 | 140.5 |
| A | 15 | 63 | 509500 | 3621.53 | 531 | 516 | 140.5 |
| B | 10 | 128 | 3724256 | 28177.72 | 629 | 609 | 132.1 |
| B | 4 | 206 | 130047 | 979.49 | 629 | 609 | 132.1 |
| B | 5 | 185 | 106046 | 797.87 | 629 | 609 | 132.1 |
| C | 15 | 180 | 3509278 | 149057.69 | 52 | 50 | 23.5 |
| C | 15 | 190 | 1284051 | 54539.12 | 52 | 50 | 23.5 |
| C | 15 | 181 | 744751 | 31631.86 | 52 | 50 | 23.5 |
| D | 15 | 40 | 3433418 | 46681.88 | 215 | 205 | 73.5 |
| D | 7 | 61 | 1944441 | 26436.05 | 215 | 205 | 73.5 |
| D | 15 | 168 | 1574350 | 21403.87 | 215 | 205 | 73.5 |
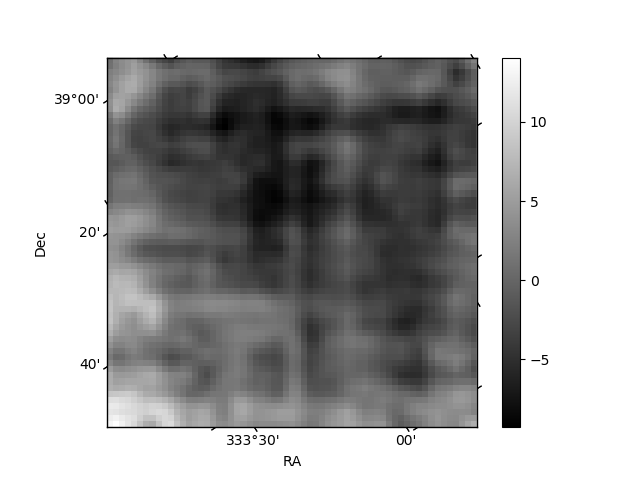
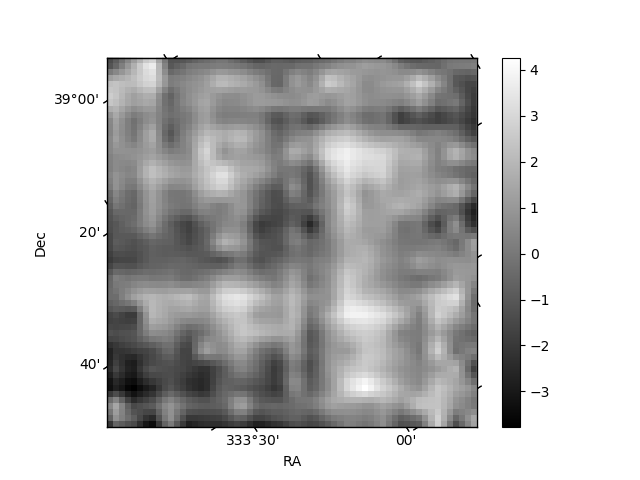
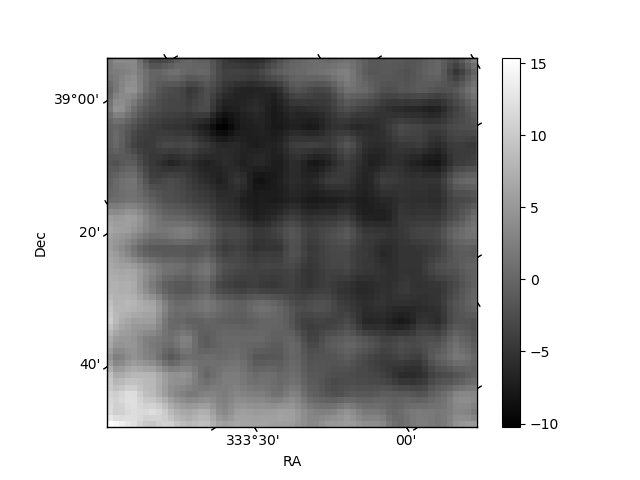
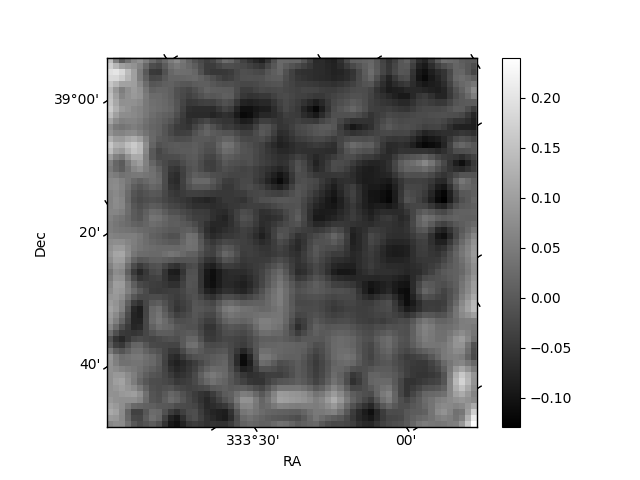
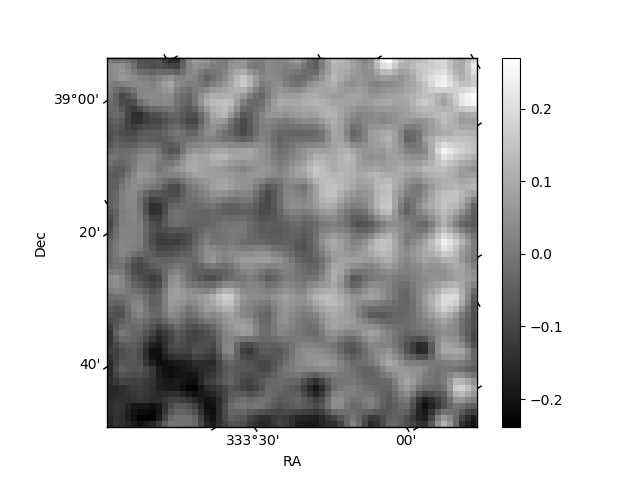
Histogram calculated using DETX and DETY for each event in the final _common_clean file
| Quadrant A | 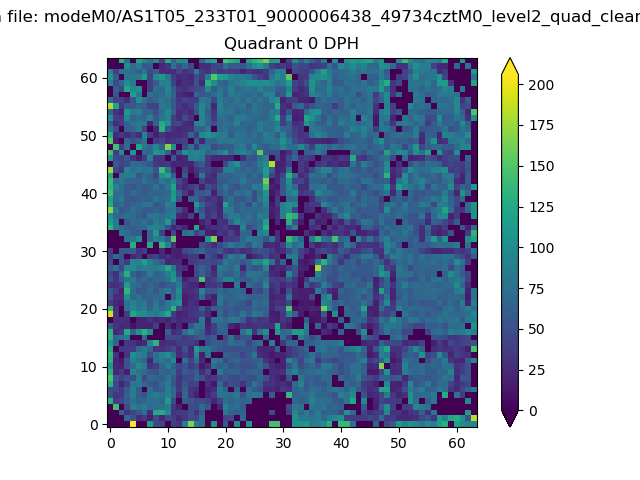 |
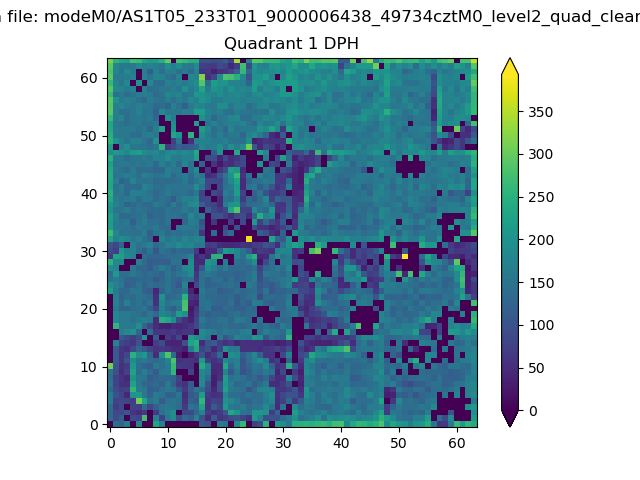 |
Quadrant B |
|---|---|---|---|
| Quadrant D | 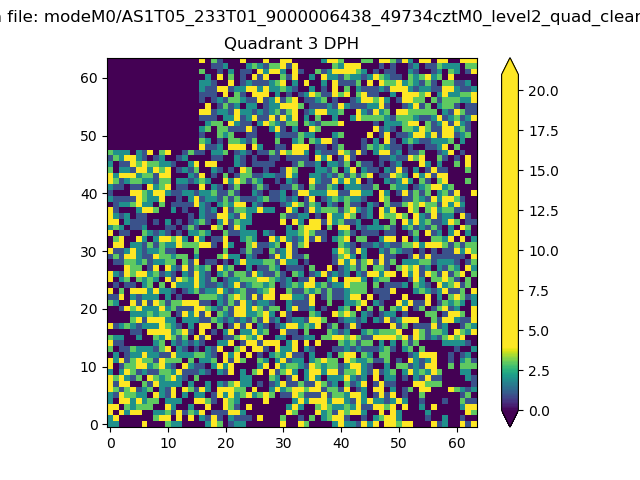 |
 |
Quadrant C |
| Plot type | Count rate plots | Images |
|---|---|---|
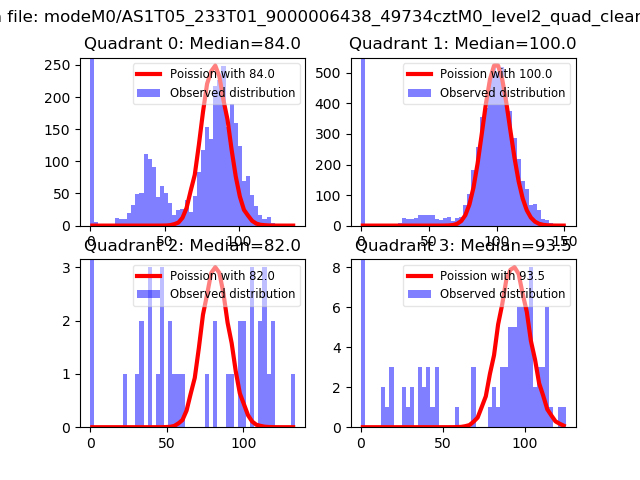
| Comparison with Poisson distribution Blue bars denote a histogram of data divided into 1 sec bins. Red curve is a Poisson curve with rate = median count rate of data. |
 |
 |
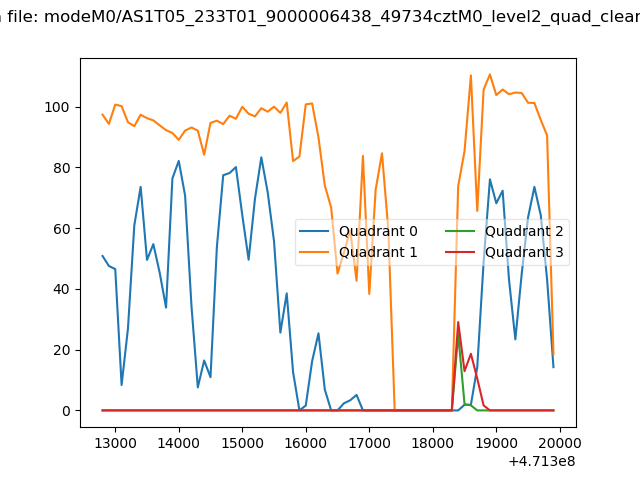
| Quadrant-wise count rates Data is divided into 100 sec bins |
 |
|
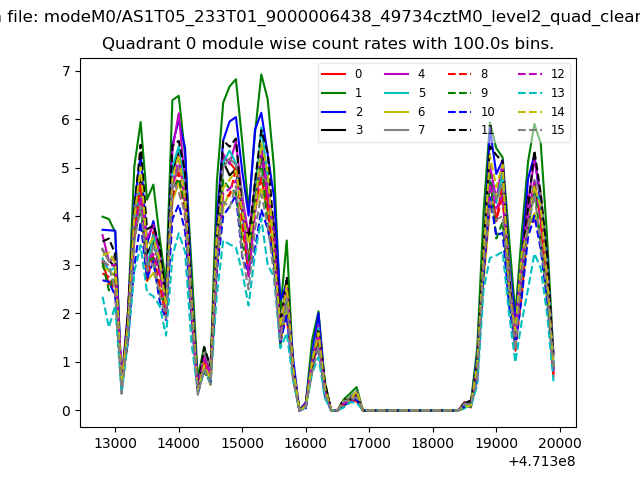
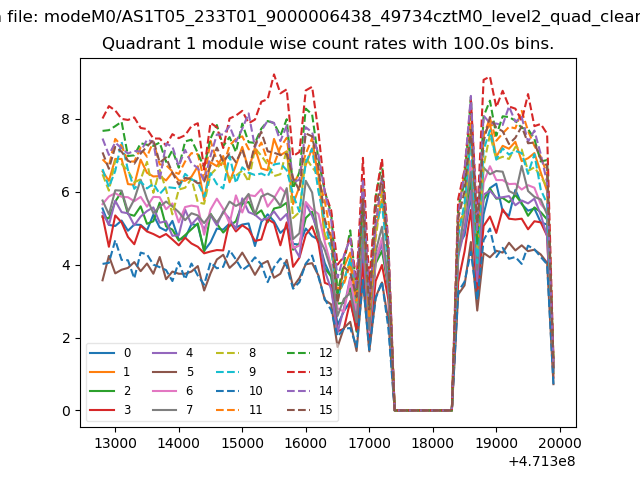
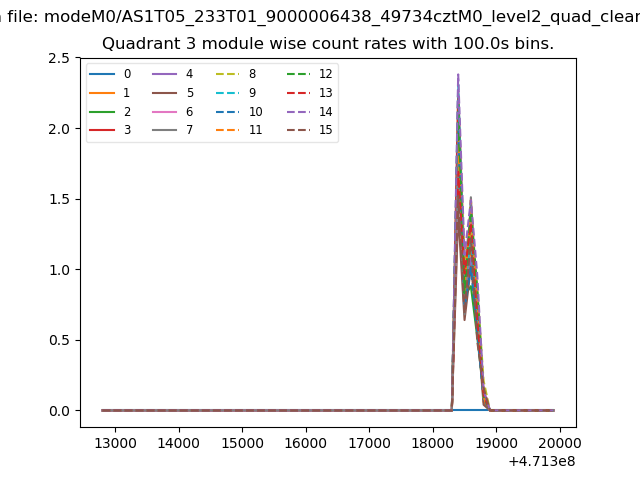
| Module-wise count rates for Quadrant A Data is divided into 100 sec bins |
 |
 |
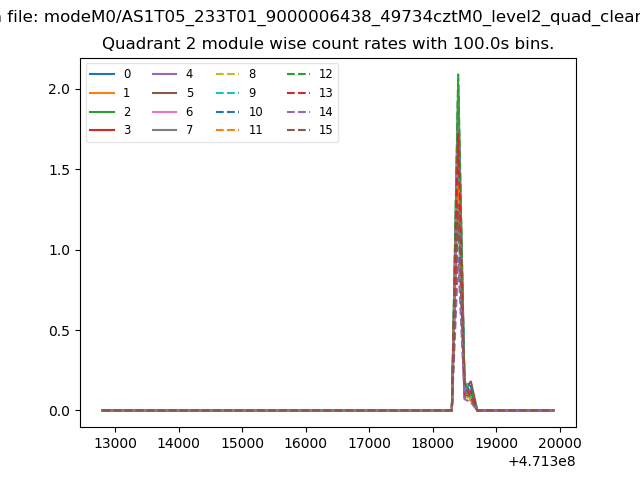
| Module-wise count rates for Quadrant B Data is divided into 100 sec bins |
 |
 |
| Module-wise count rates for Quadrant C Data is divided into 100 sec bins |
 |
 |
| Module-wise count rates for Quadrant D Data is divided into 100 sec bins |
 |
 |
| Parameter | Plot |
|---|---|
| CZT HV Monitor | 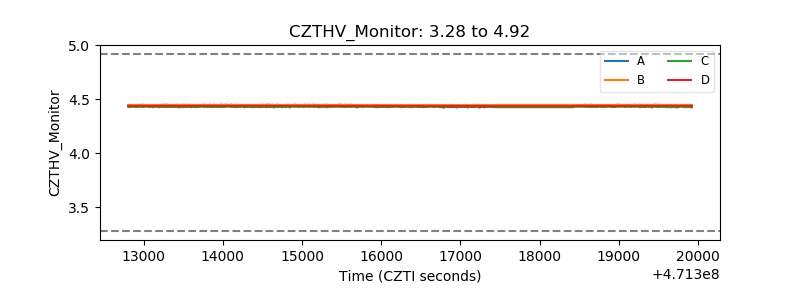 |
| D_VDD | 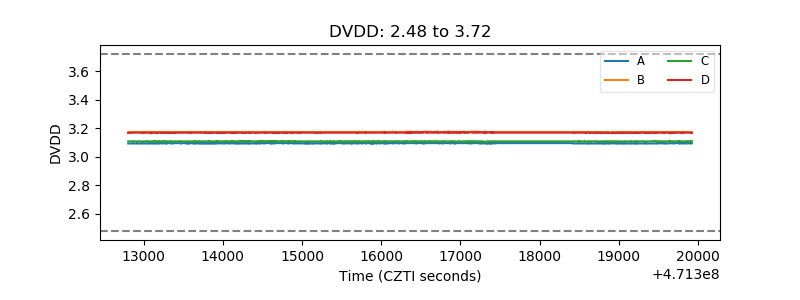 |
| Temperature 1 | 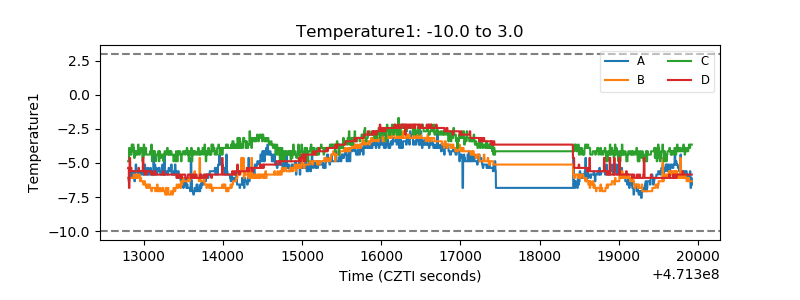 |
| Veto HV Monitor | 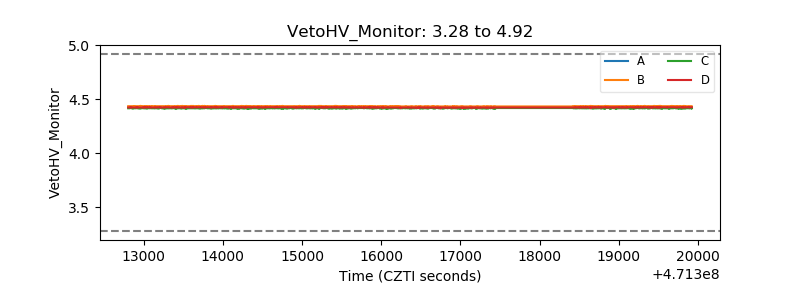 |
| Veto LLD | 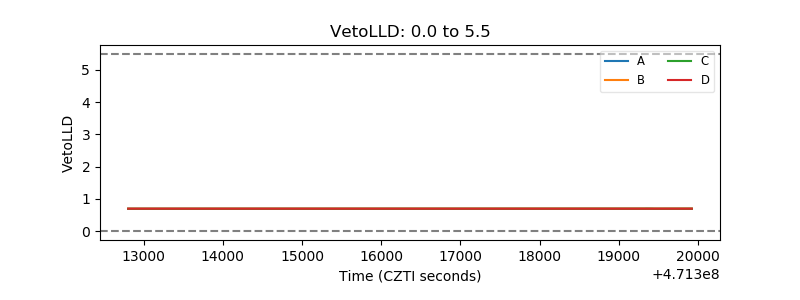 |
| Alpha Counter | 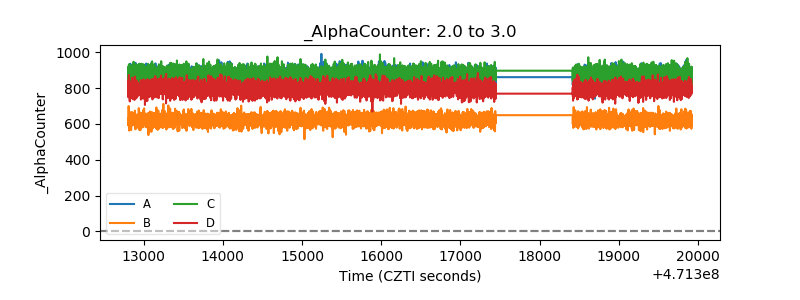 |
| _CPM_Rate | 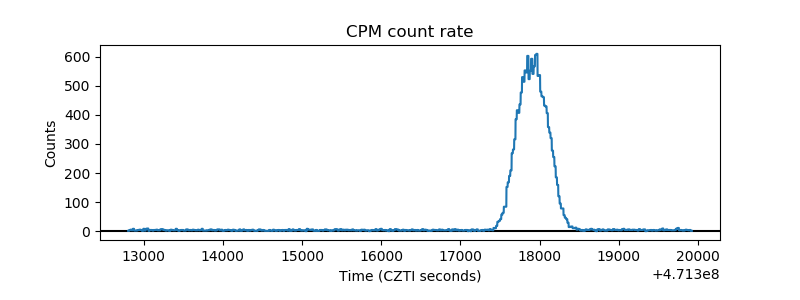 |
| CZT Counter | 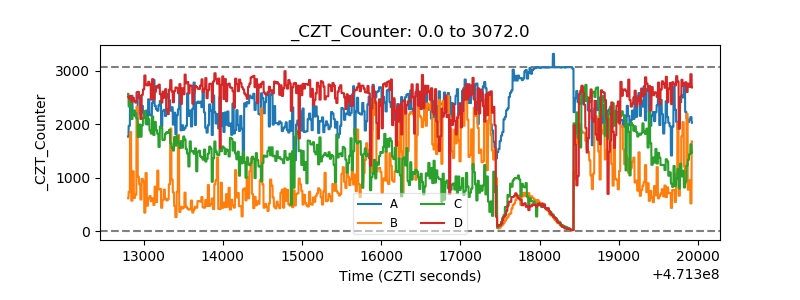 |
| +2.5 Volts monitor | 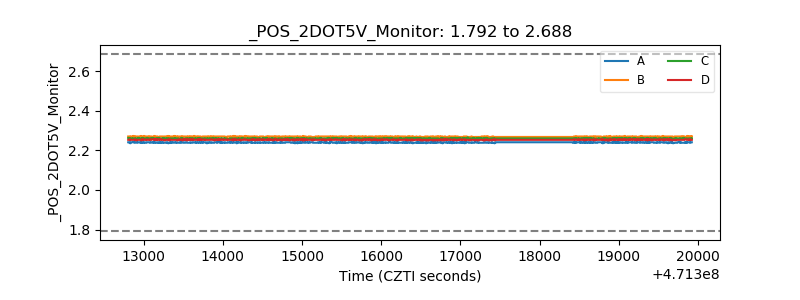 |
| +5 Volts monitor | 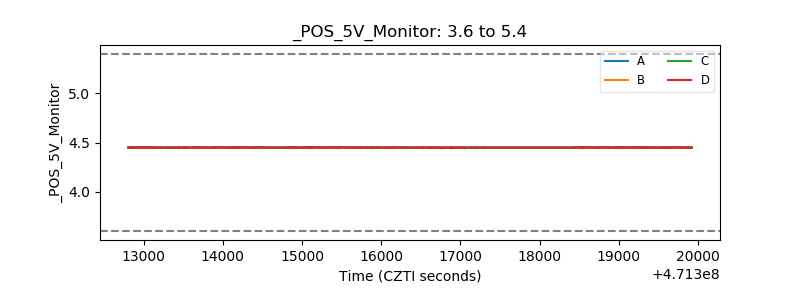 |
| _ROLL_ROT | 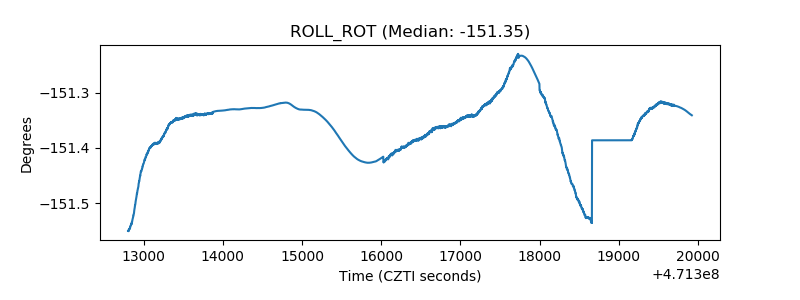 |
| _Roll_DEC | 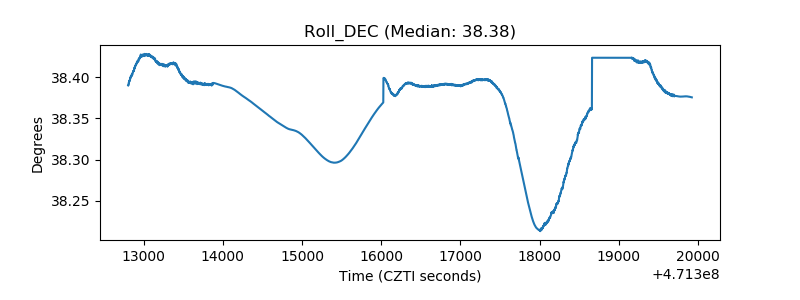 |
| _Roll_RA | 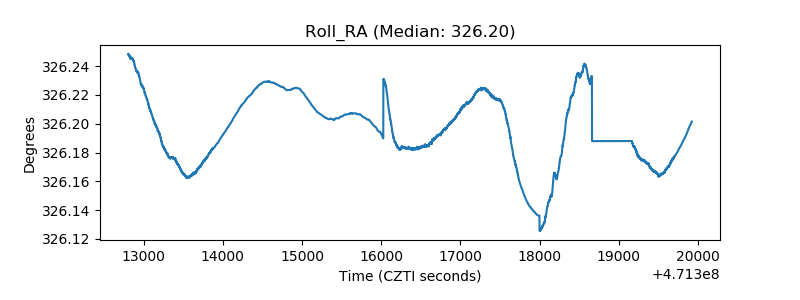 |
| Veto Counter | 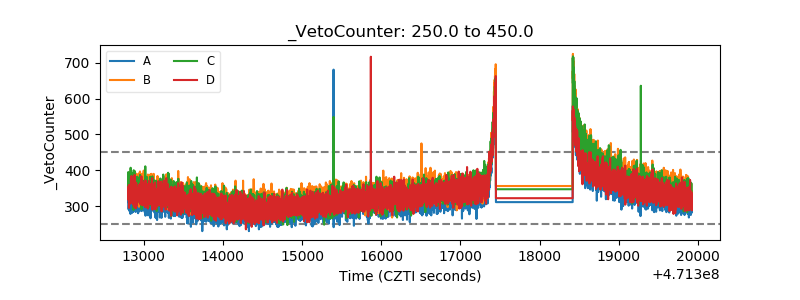 |