| Param | Original file | Final file |
|---|---|---|
| Filename | modeM0/AS1A13_037T01_9000006440cztM0_level2.fits | modeM0/AS1A13_037T01_9000006440cztM0_level2_quad_clean.evt |
| Size (bytes) | 1,890,446,400 | 2,231,320,320 |
| Size | 1.8 GB | 2.1 GB |
| Events in quadrant A | 10,975,430 | 13,601,522 |
| Events in quadrant B | 16,407,878 | 28,567,573 |
| Events in quadrant C | 2,406,994 | 835,639 |
| Events in quadrant D | 3,218,688 | 738,943 |
| Mode M9 | |||
|---|---|---|---|
| Quadrant | BADHDUFLAG | Total packets | Discarded packets |
| A | 0 | 731 | 0 |
| B | 0 | 731 | 0 |
| C | 0 | 731 | 0 |
| D | 0 | 732 | 0 |
| Mode SS | |||
|---|---|---|---|
| Quadrant | BADHDUFLAG | Total packets | Discarded packets |
| A | 0 | 7060 | 0 |
| B | 0 | 7060 | 0 |
| C | 0 | 7060 | 0 |
| D | 0 | 7060 | 0 |
| Mode M0 | |||
|---|---|---|---|
| Quadrant | BADHDUFLAG | Total packets | Discarded packets |
| A | 0 | 2041815 | 0 |
| B | 0 | 883781 | 0 |
| C | 0 | 2106618 | 0 |
| D | 0 | 2500847 | 0 |
| Quadrant | Total seconds | Saturated seconds | Saturation percentage |
|---|---|---|---|
| A | 347709 | 177592 | 51.074893% |
| B | 347711 | 14397 | 4.140507% |
| C | 347711 | 336481 | 96.770306% |
| D | 347711 | 336839 | 96.873265% |
Noise dominated data is calculated using 1-second bins in cleaned event files. If a bin has >2000 counts, and if more than 50% of those come from <1% of pixels, then it is considered to be noise-dominated and hence unusable.
| Quadrant | # 1 sec bins | Bins with >0 counts | Bins with >2000 counts | High rate bins dominated by noise | Noise dominated (total time) | Noise dominated (detector-on time) | Marked lightcurve |
|---|---|---|---|---|---|---|---|
| A | 400887 | 335089 | 0 | 0 | 0.00% | 0.00% | 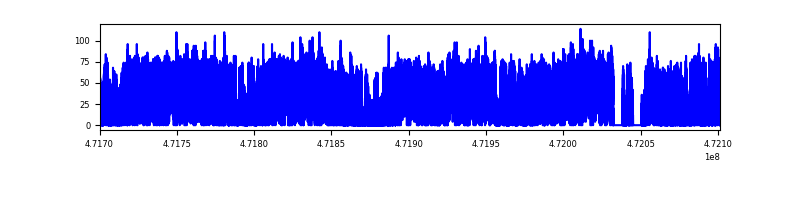 |
| B | 400888 | 347506 | 0 | 0 | 0.00% | 0.00% | 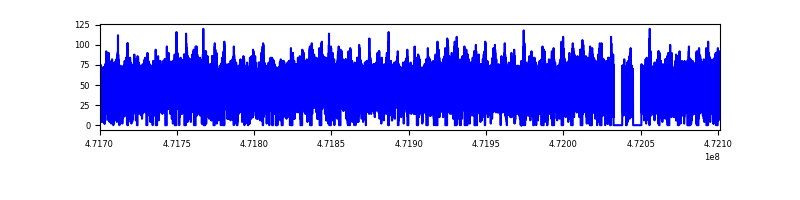 |
| C | 400884 | 210329 | 0 | 0 | 0.00% | 0.00% | 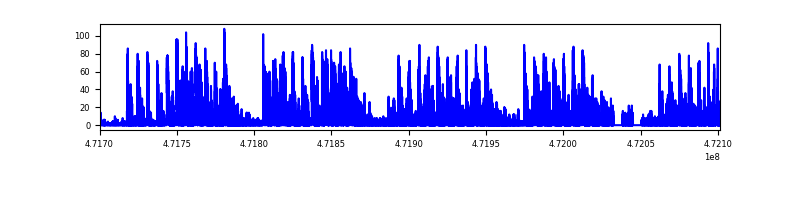 |
| D | 400888 | 286992 | 0 | 0 | 0.00% | 0.00% | 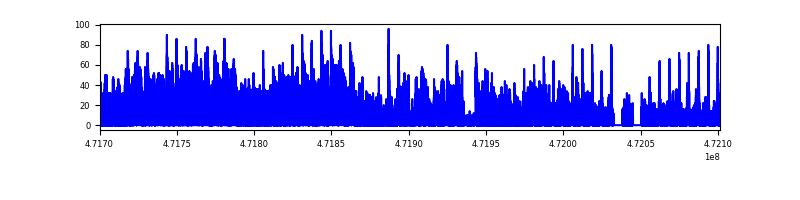 |
Top three noisy pixels from each quadrant. If the there are fewer than three noisy pixels in the level2.evt file, extra rows are filled as -1
| Pixel properties | Quadrant properties | ||||||
|---|---|---|---|---|---|---|---|
| Quadrant | DetID | PixID | Counts | Sigma | Mean | Median | Sigma |
| A | 9 | 255 | 11678 | 9.87 | 2976 | 2768 | 902.8 |
| A | 14 | 188 | 11377 | 9.54 | 2976 | 2768 | 902.8 |
| A | 14 | 95 | 9527 | 7.49 | 2976 | 2768 | 902.8 |
| B | 2 | 9 | 17816 | 13.64 | 4379 | 4151 | 1002.1 |
| B | 2 | 8 | 16207 | 12.03 | 4379 | 4151 | 1002.1 |
| B | 2 | 245 | 13558 | 9.39 | 4379 | 4151 | 1002.1 |
| C | 7 | 221 | 1975 | 6.31 | 667 | 610 | 216.2 |
| C | 2 | 31 | 1959 | 6.24 | 667 | 610 | 216.2 |
| C | 7 | 245 | 1920 | 6.06 | 667 | 610 | 216.2 |
| D | 6 | 218 | 4670 | 12.56 | 952 | 844 | 304.6 |
| D | 3 | 30 | 3317 | 8.12 | 952 | 844 | 304.6 |
| D | 14 | 31 | 2929 | 6.84 | 952 | 844 | 304.6 |
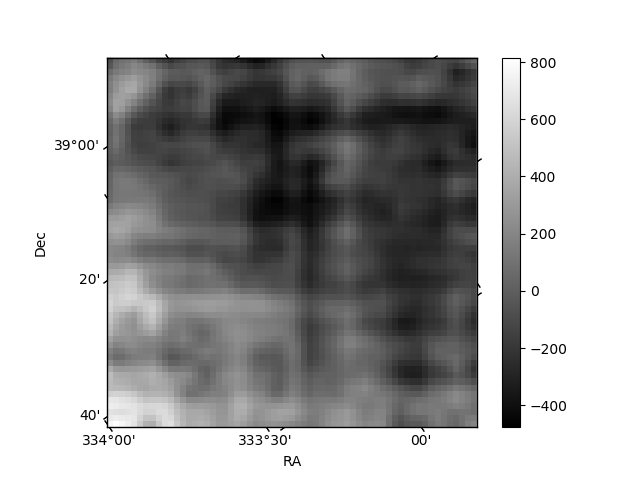
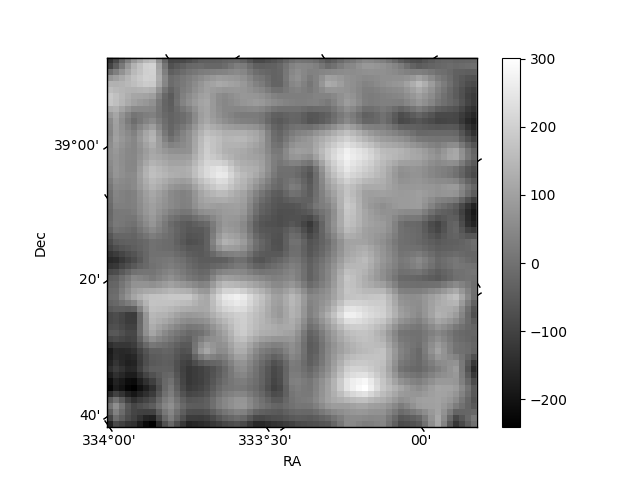
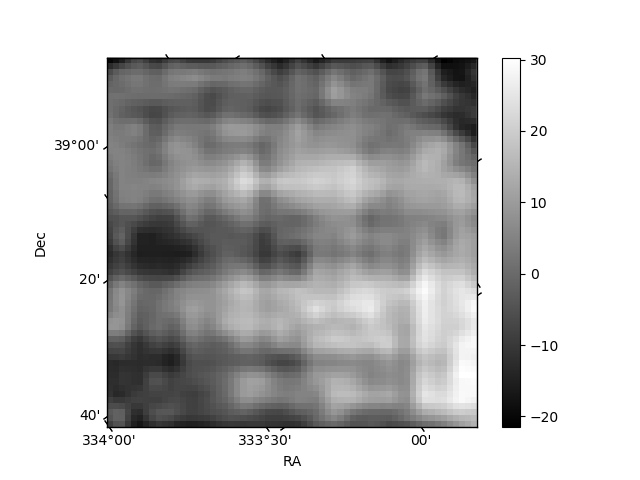
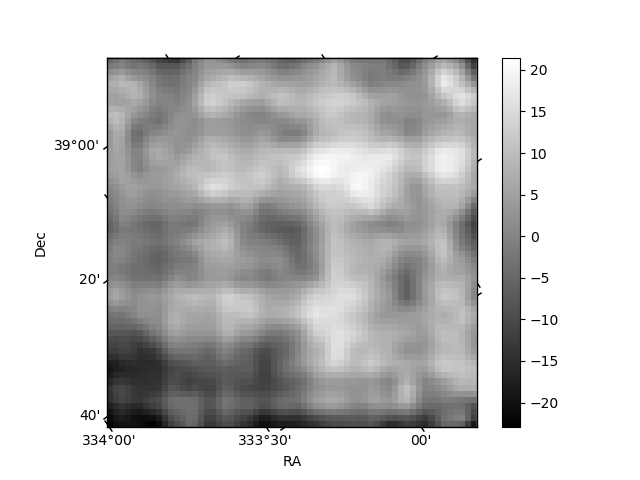
Histogram calculated using DETX and DETY for each event in the final _common_clean file
| Quadrant A | 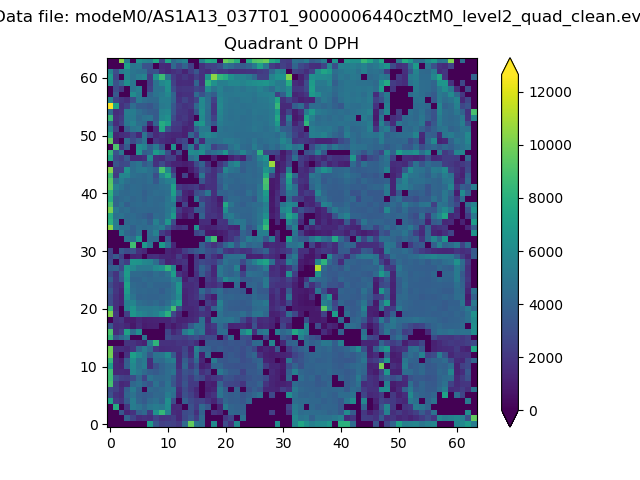 |
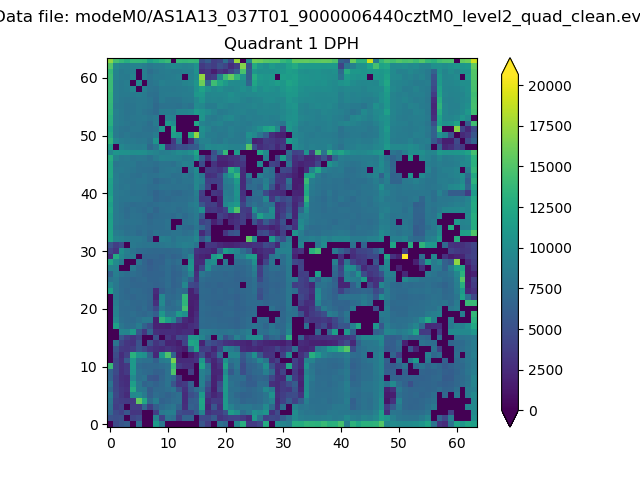 |
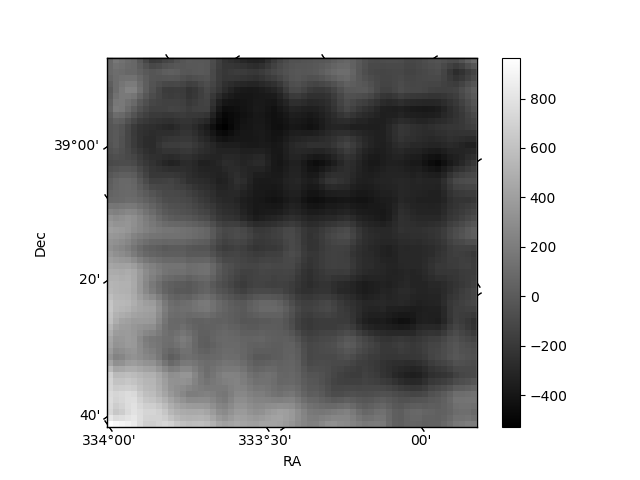
Quadrant B |
|---|---|---|---|
| Quadrant D | 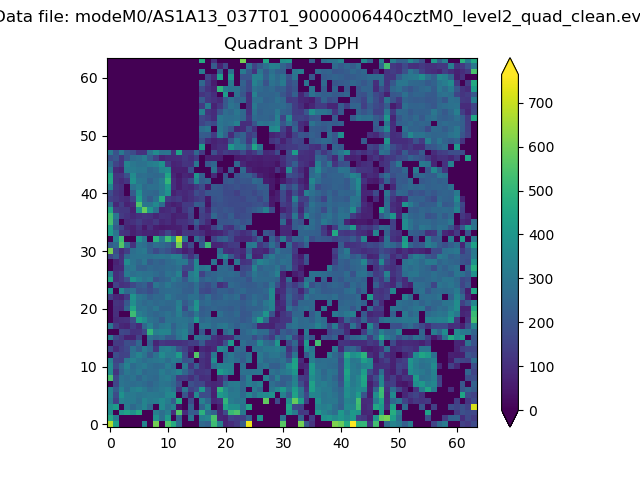 |
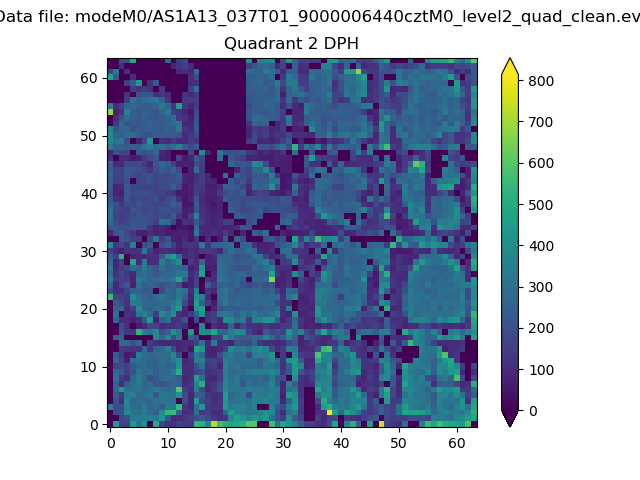 |
Quadrant C |
| Plot type | Count rate plots | Images |
|---|---|---|
| Comparison with Poisson distribution Blue bars denote a histogram of data divided into 1 sec bins. Red curve is a Poisson curve with rate = median count rate of data. |
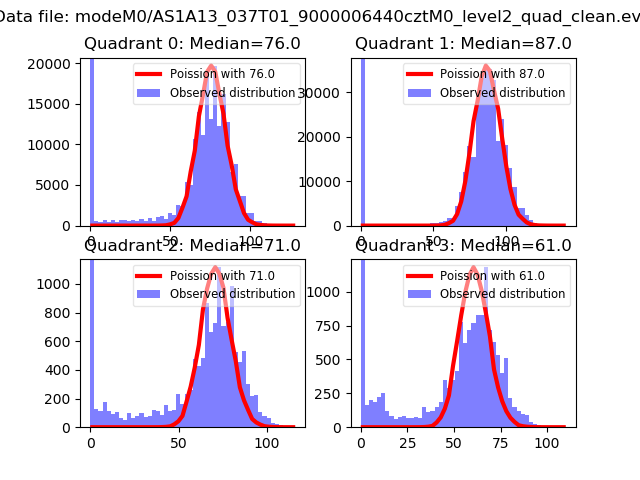 |
 |
| Quadrant-wise count rates Data is divided into 100 sec bins |
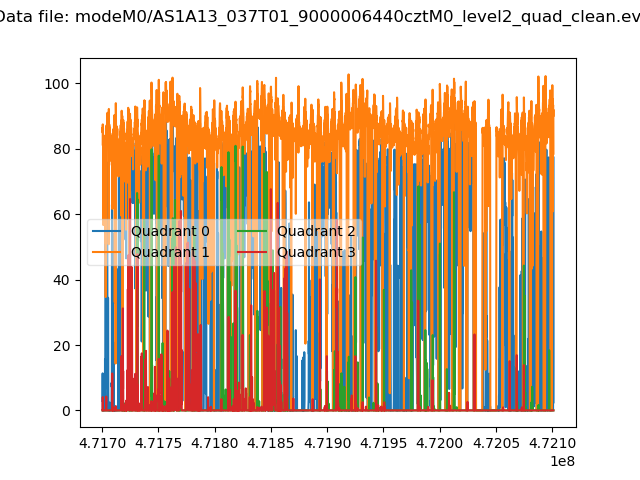 |
|
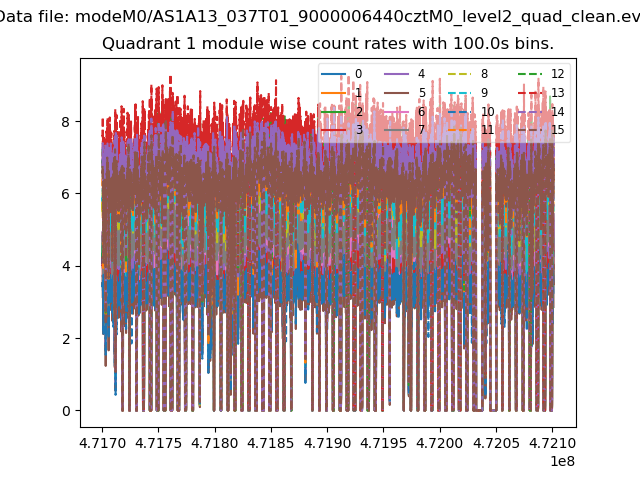
| Module-wise count rates for Quadrant A Data is divided into 100 sec bins |
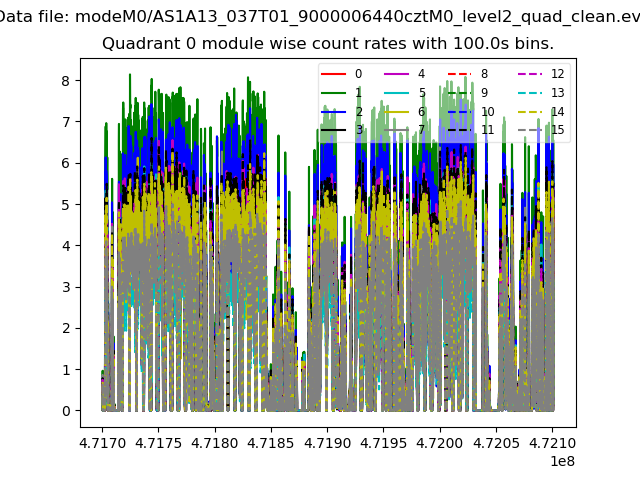 |
 |
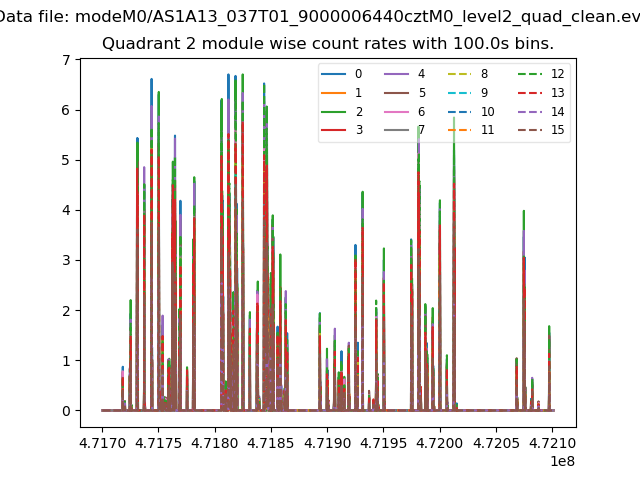
| Module-wise count rates for Quadrant B Data is divided into 100 sec bins |
 |
 |
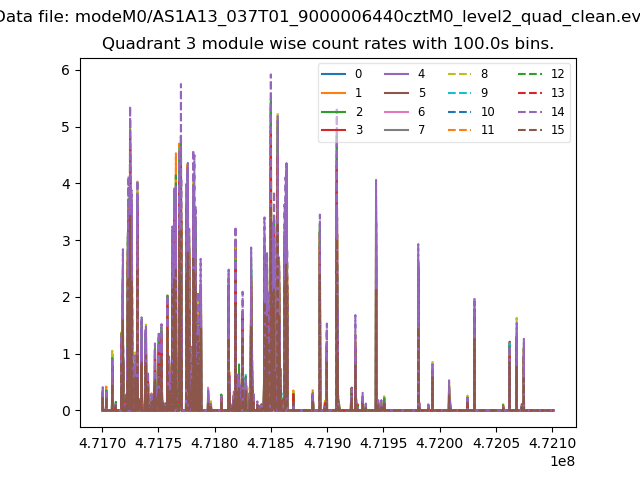
| Module-wise count rates for Quadrant C Data is divided into 100 sec bins |
 |
 |
| Module-wise count rates for Quadrant D Data is divided into 100 sec bins |
 |
 |
| Parameter | Plot |
|---|---|
| CZT HV Monitor | 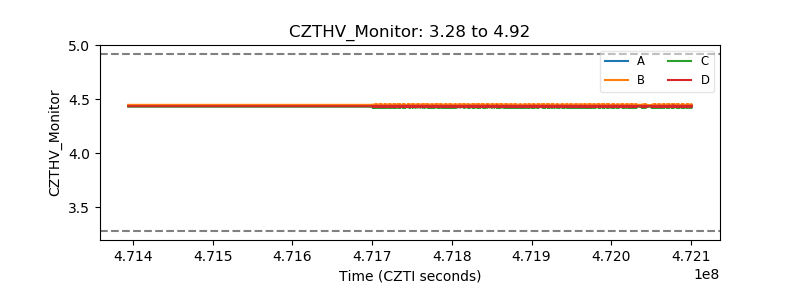 |
| D_VDD | 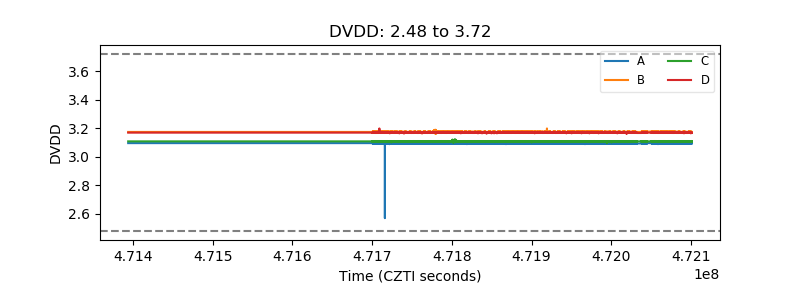 |
| Temperature 1 | 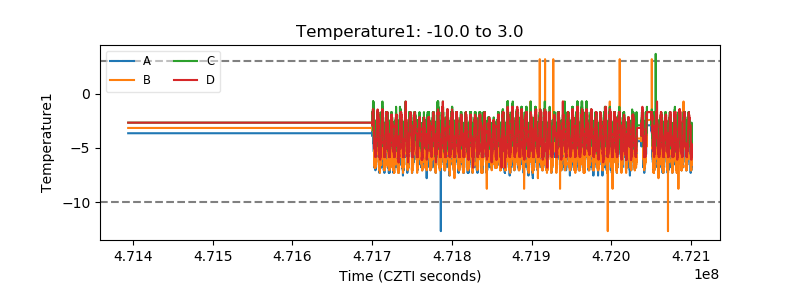 |
| Veto HV Monitor | 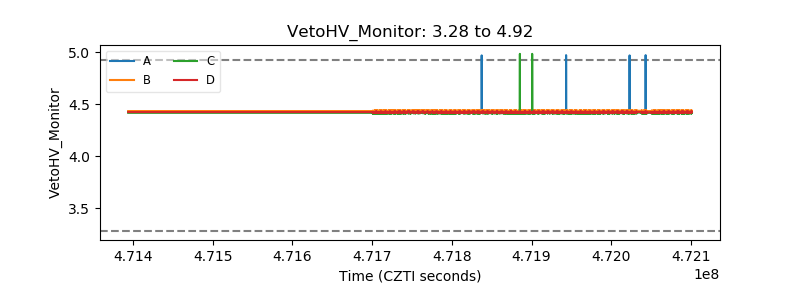 |
| Veto LLD | 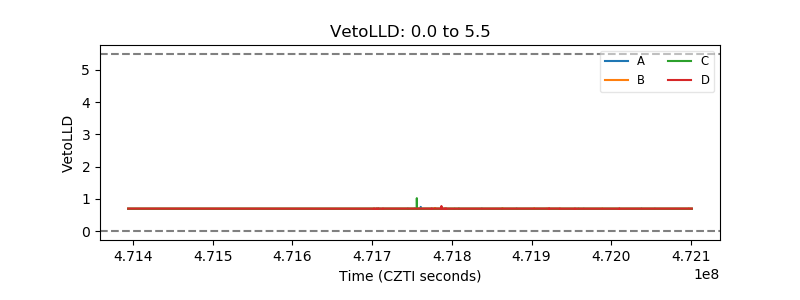 |
| Alpha Counter | 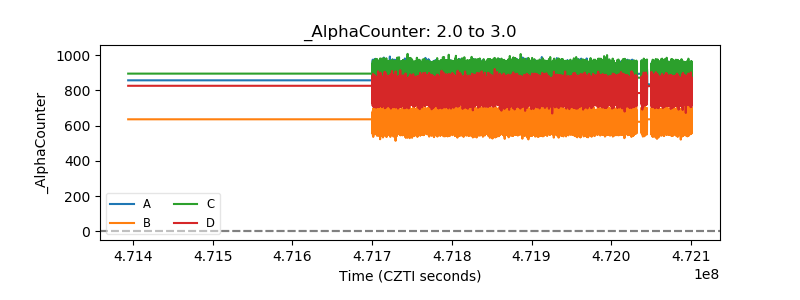 |
| _CPM_Rate | 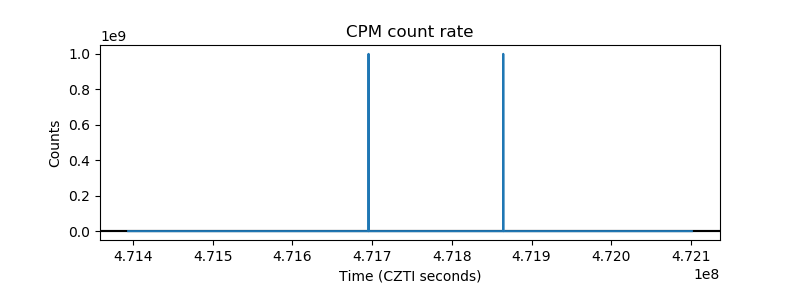 |
| CZT Counter | 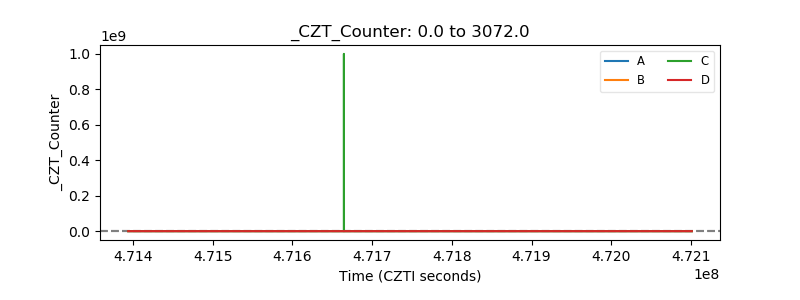 |
| +2.5 Volts monitor | 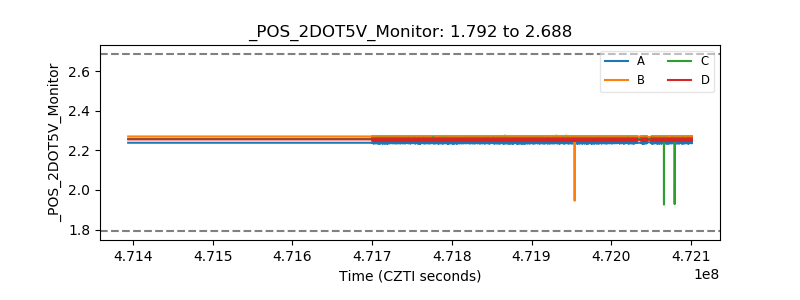 |
| +5 Volts monitor | 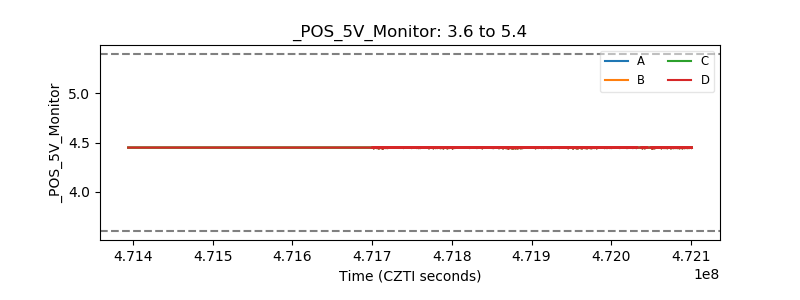 |
| _ROLL_ROT | 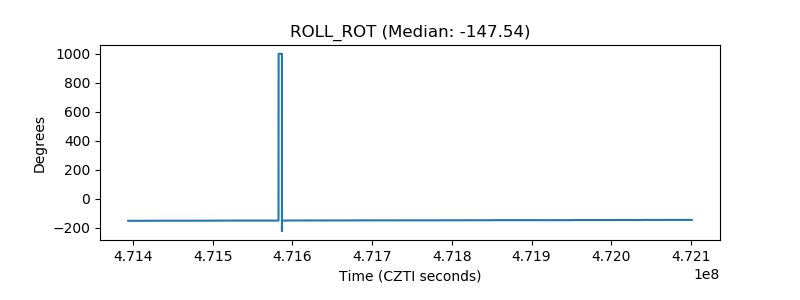 |
| _Roll_DEC | 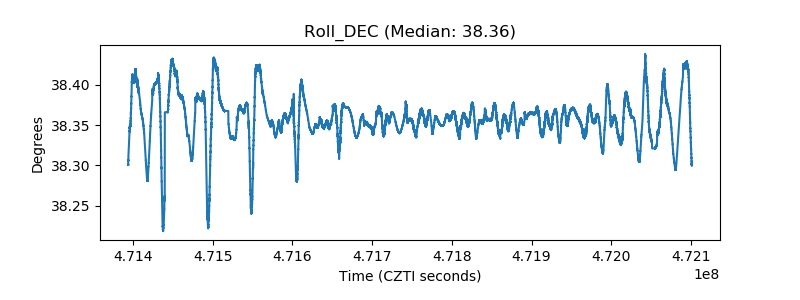 |
| _Roll_RA | 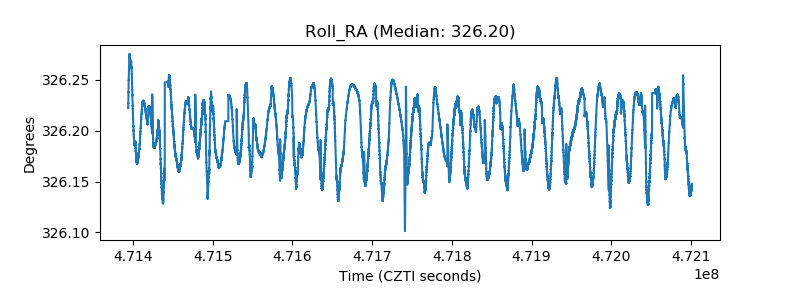 |
| Veto Counter | 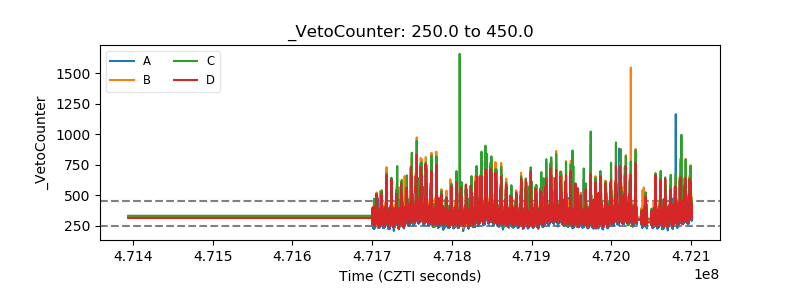 |