| Param | Original file | Final file |
|---|---|---|
| Filename | modeM0/AS1A13_037T01_9000006440_49750cztM0_level2.fits | modeM0/AS1A13_037T01_9000006440_49750cztM0_level2_quad_clean.evt |
| Size (bytes) | 1,236,585,600 | 44,303,040 |
| Size | 1.2 GB | 42.3 MB |
| Events in quadrant A | 14,828,402 | 103,486 |
| Events in quadrant B | 4,757,273 | 631,688 |
| Events in quadrant C | 11,066,005 | 3,326 |
| Events in quadrant D | 14,639,103 | 164,669 |
| Mode M9 | |||
|---|---|---|---|
| Quadrant | BADHDUFLAG | Total packets | Discarded packets |
| A | 0 | 10 | 0 |
| B | 0 | 10 | 0 |
| C | 0 | 10 | 0 |
| D | 0 | 10 | 0 |
| Mode SS | |||
|---|---|---|---|
| Quadrant | BADHDUFLAG | Total packets | Discarded packets |
| A | 0 | 128 | 0 |
| B | 0 | 128 | 0 |
| C | 0 | 128 | 0 |
| D | 0 | 128 | 0 |
| Mode M0 | |||
|---|---|---|---|
| Quadrant | BADHDUFLAG | Total packets | Discarded packets |
| A | 0 | 48273 | 1 |
| B | 0 | 18412 | 1 |
| C | 0 | 37255 | 1 |
| D | 0 | 47768 | 1 |
| Quadrant | Total seconds | Saturated seconds | Saturation percentage |
|---|---|---|---|
| A | 6270 | 5509 | 87.862839% |
| B | 6270 | 226 | 3.604466% |
| C | 6270 | 6247 | 99.633174% |
| D | 6270 | 4768 | 76.044657% |
Noise dominated data is calculated using 1-second bins in cleaned event files. If a bin has >2000 counts, and if more than 50% of those come from <1% of pixels, then it is considered to be noise-dominated and hence unusable.
| Quadrant | # 1 sec bins | Bins with >0 counts | Bins with >2000 counts | High rate bins dominated by noise | Noise dominated (total time) | Noise dominated (detector-on time) | Marked lightcurve |
|---|---|---|---|---|---|---|---|
| A | 7300 | 6270 | 5468 | 5468 | 74.90% | 87.21% |  |
| B | 7300 | 6270 | 129 | 129 | 1.77% | 2.06% | 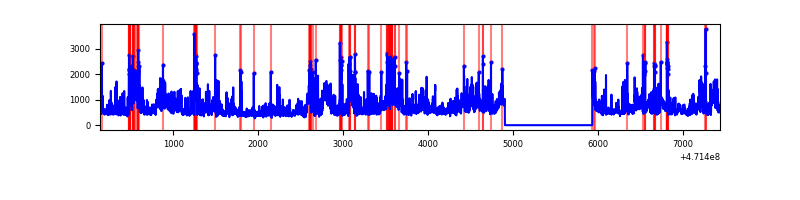 |
| C | 7299 | 6269 | 1852 | 1852 | 25.37% | 29.54% | 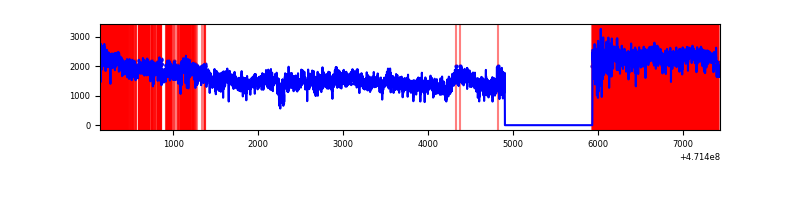 |
| D | 7299 | 6269 | 4742 | 4742 | 64.97% | 75.64% | 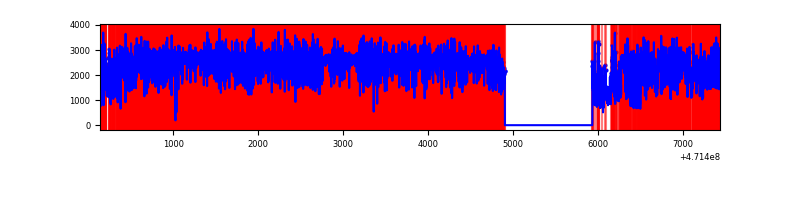 |
Top three noisy pixels from each quadrant. If the there are fewer than three noisy pixels in the level2.evt file, extra rows are filled as -1
| Pixel properties | Quadrant properties | ||||||
|---|---|---|---|---|---|---|---|
| Quadrant | DetID | PixID | Counts | Sigma | Mean | Median | Sigma |
| A | 10 | 83 | 7103044 | 52345.05 | 484 | 470 | 135.7 |
| A | 12 | 50 | 1093080 | 8052.39 | 484 | 470 | 135.7 |
| A | 3 | 84 | 653640 | 4813.78 | 484 | 470 | 135.7 |
| B | 1 | 207 | 641815 | 4519.08 | 667 | 646 | 141.9 |
| B | 10 | 128 | 477537 | 3361.22 | 667 | 646 | 141.9 |
| B | 4 | 206 | 349375 | 2457.91 | 667 | 646 | 141.9 |
| C | 15 | 180 | 3840071 | 96322.01 | 87 | 84 | 39.9 |
| C | 15 | 181 | 1689321 | 42372.72 | 87 | 84 | 39.9 |
| C | 15 | 163 | 1145509 | 28731.77 | 87 | 84 | 39.9 |
| D | 15 | 168 | 2800258 | 20254.85 | 457 | 440 | 138.2 |
| D | 15 | 185 | 1580813 | 11432.96 | 457 | 440 | 138.2 |
| D | 8 | 129 | 1575964 | 11397.88 | 457 | 440 | 138.2 |
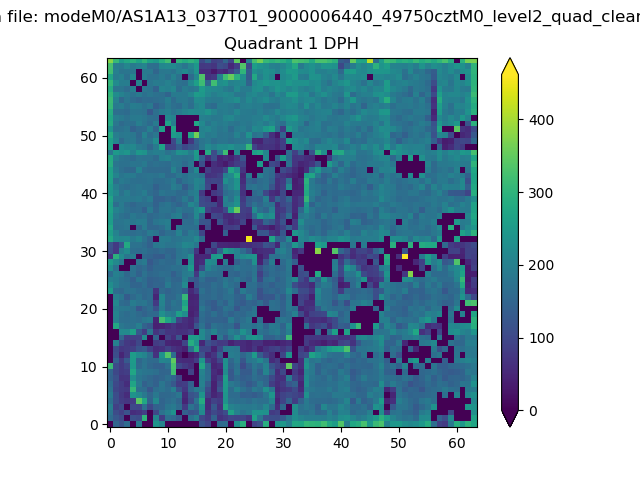
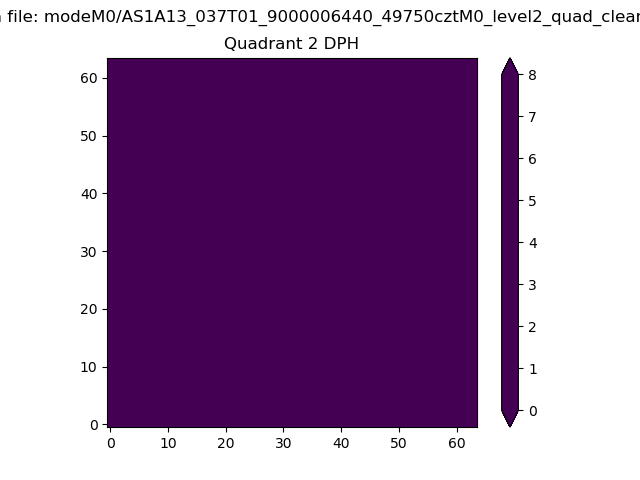
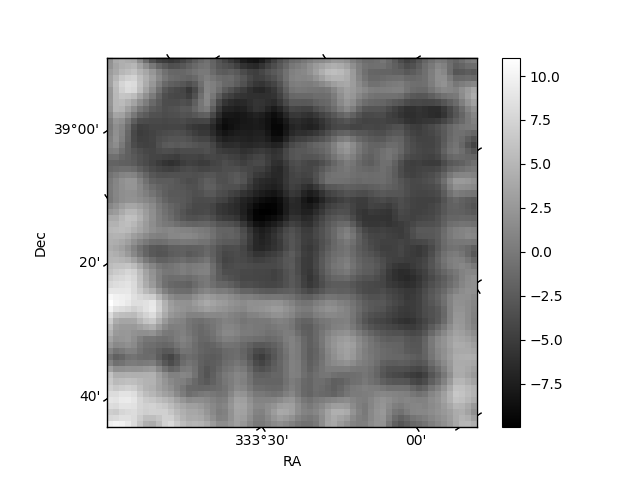
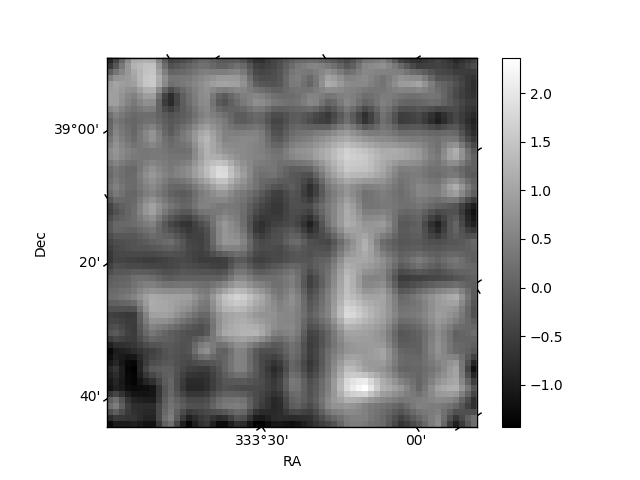
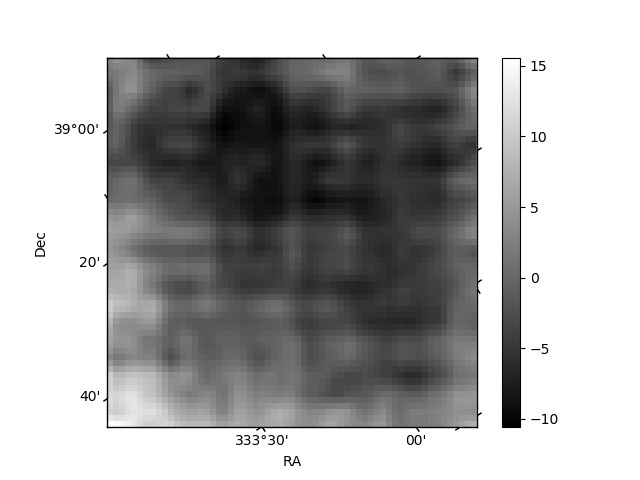
Histogram calculated using DETX and DETY for each event in the final _common_clean file
| Quadrant A | 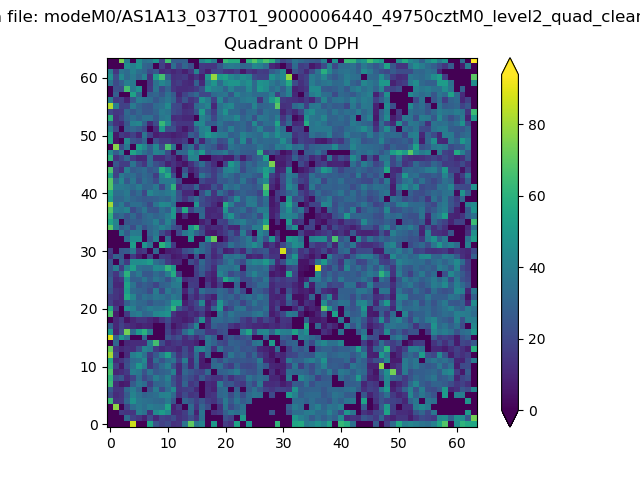 |
 |
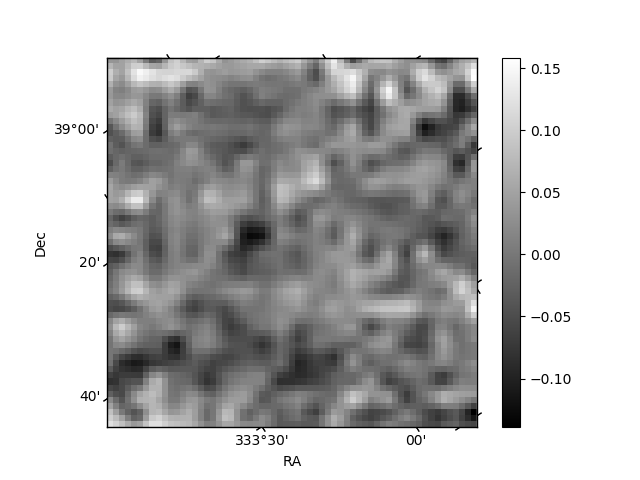
Quadrant B |
|---|---|---|---|
| Quadrant D | 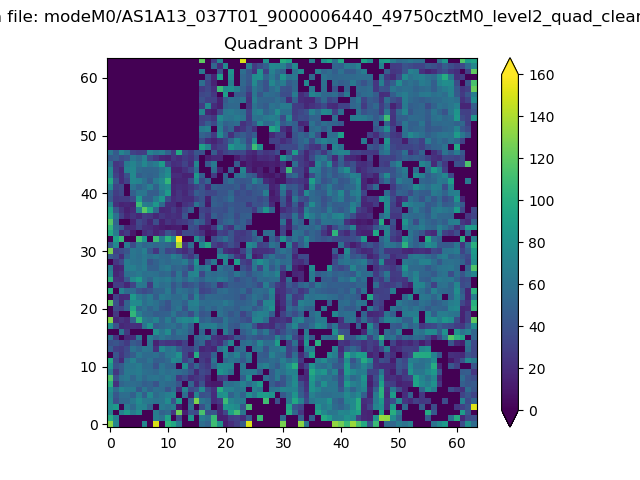 |
 |
Quadrant C |
| Plot type | Count rate plots | Images |
|---|---|---|
| Comparison with Poisson distribution Blue bars denote a histogram of data divided into 1 sec bins. Red curve is a Poisson curve with rate = median count rate of data. |
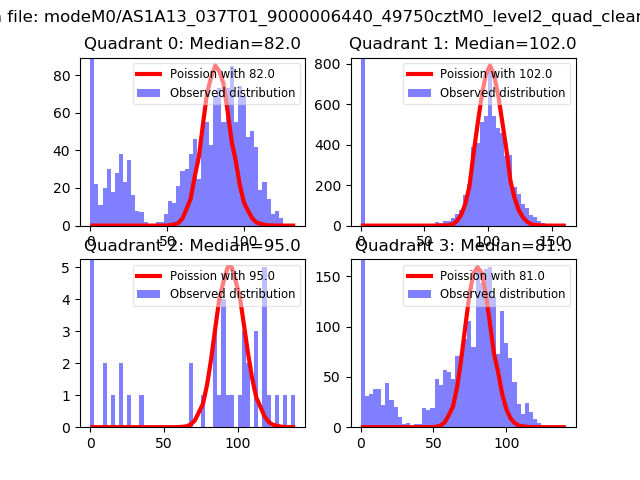 |
 |
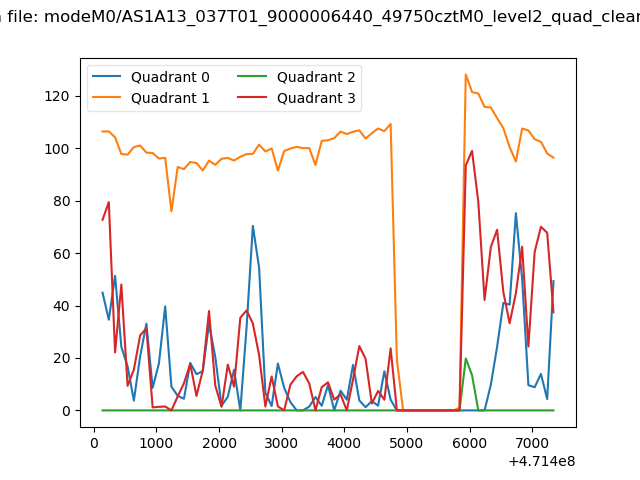
| Quadrant-wise count rates Data is divided into 100 sec bins |
 |
|
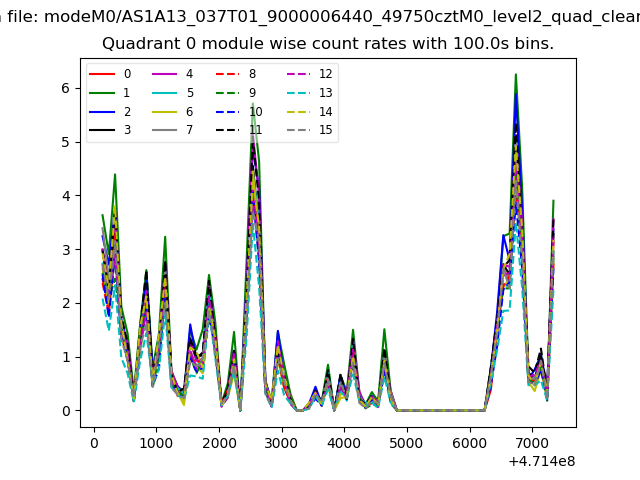
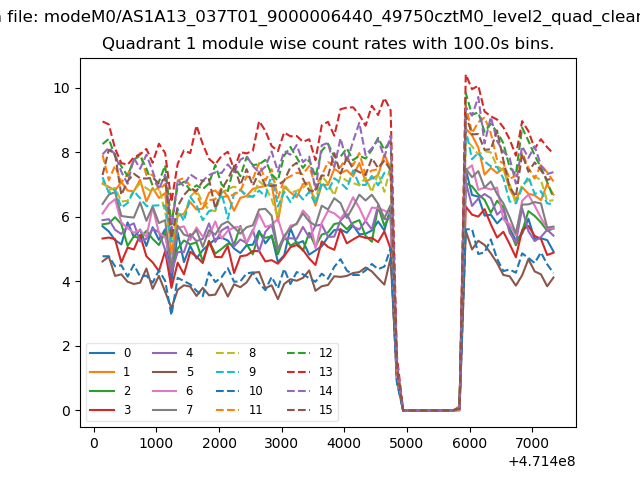
| Module-wise count rates for Quadrant A Data is divided into 100 sec bins |
 |
 |
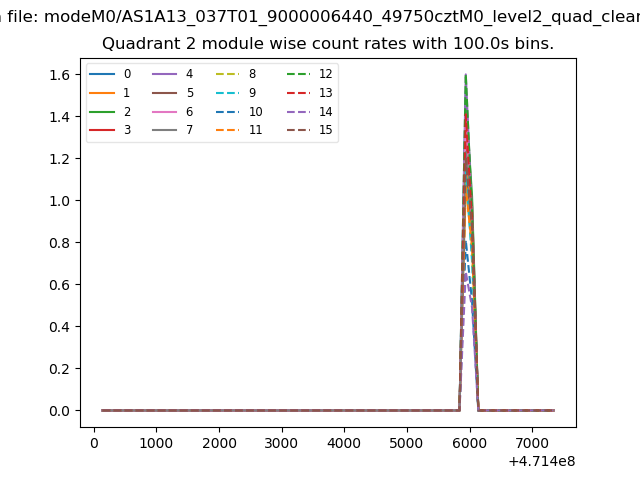
| Module-wise count rates for Quadrant B Data is divided into 100 sec bins |
 |
 |
| Module-wise count rates for Quadrant C Data is divided into 100 sec bins |
 |
 |
| Module-wise count rates for Quadrant D Data is divided into 100 sec bins |
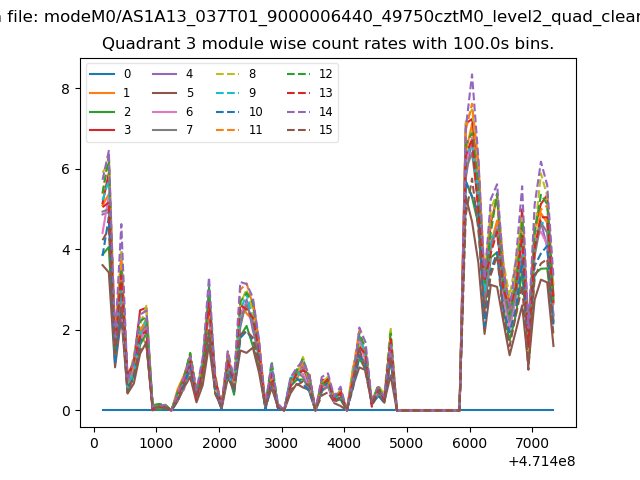 |
 |
| Parameter | Plot |
|---|---|
| CZT HV Monitor | 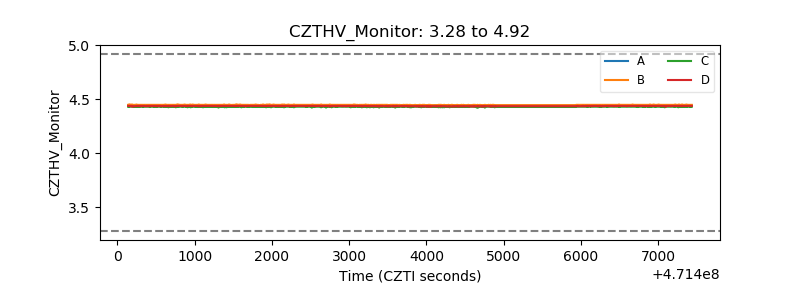 |
| D_VDD | 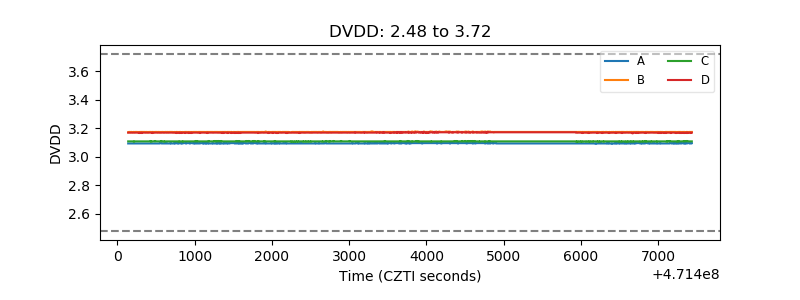 |
| Temperature 1 | 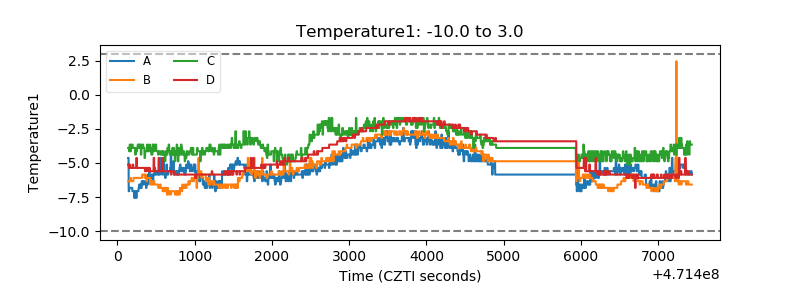 |
| Veto HV Monitor | 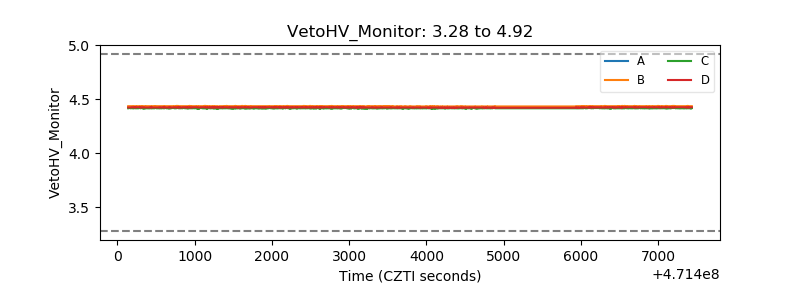 |
| Veto LLD | 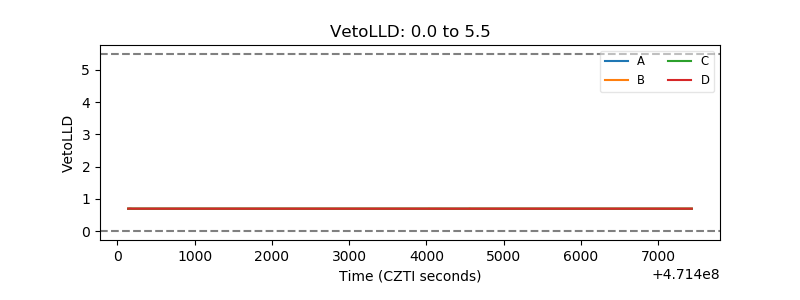 |
| Alpha Counter |  |
| _CPM_Rate | 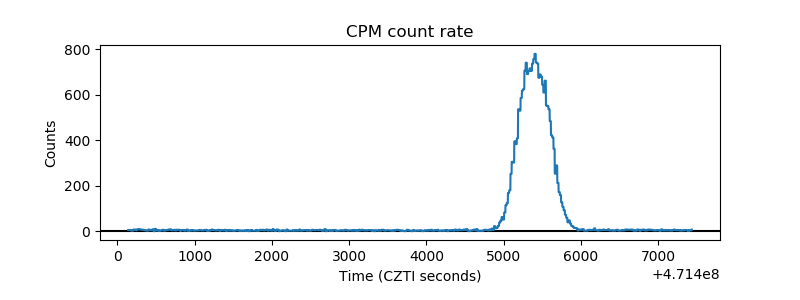 |
| CZT Counter | 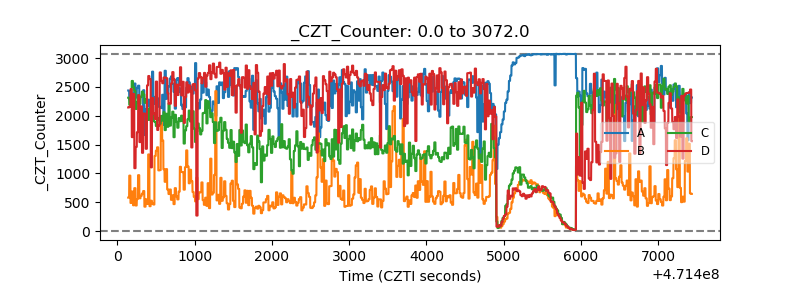 |
| +2.5 Volts monitor | 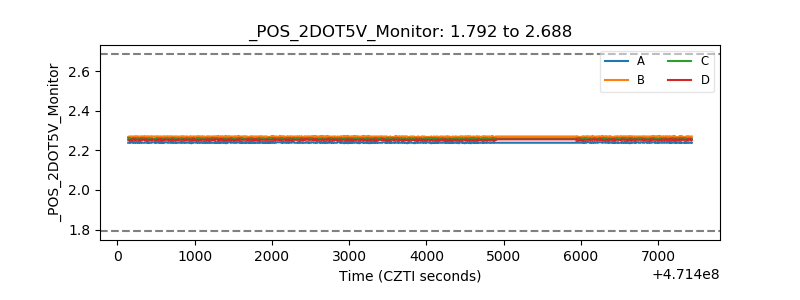 |
| +5 Volts monitor |  |
| _ROLL_ROT | 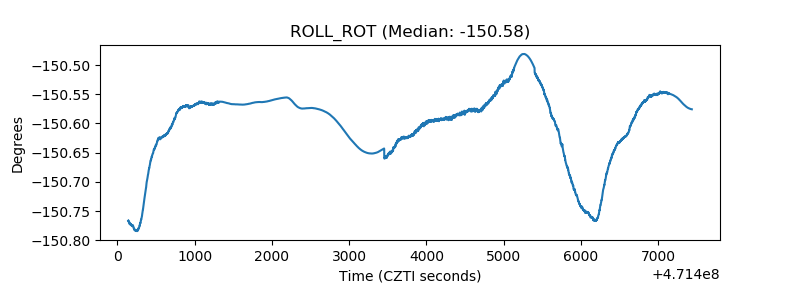 |
| _Roll_DEC | 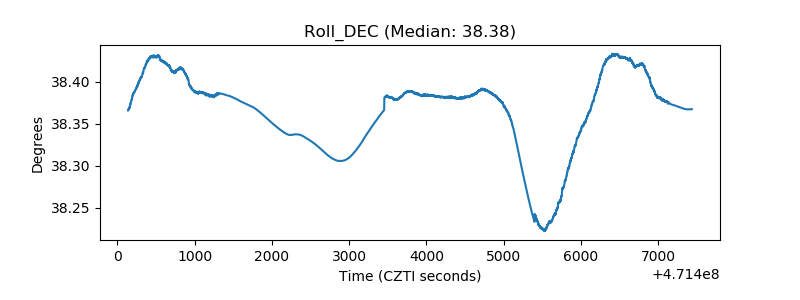 |
| _Roll_RA | 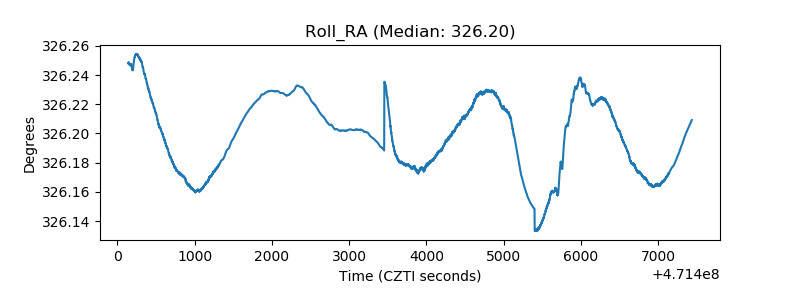 |
| Veto Counter | 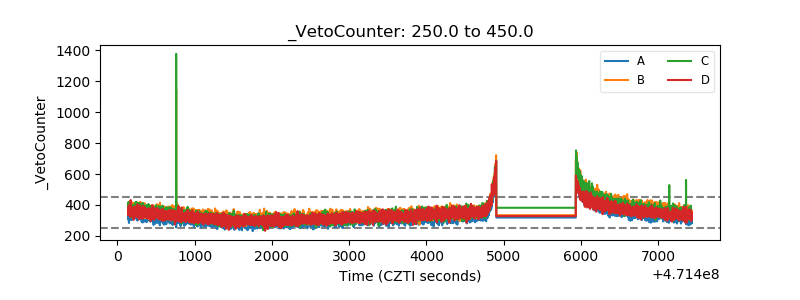 |