| Param | Original file | Final file |
|---|---|---|
| Filename | modeM0/AS1A13_037T01_9000006440_49752cztM0_level2.fits | modeM0/AS1A13_037T01_9000006440_49752cztM0_level2_quad_clean.evt |
| Size (bytes) | 1,127,511,360 | 52,044,480 |
| Size | 1.1 GB | 49.6 MB |
| Events in quadrant A | 14,791,632 | 89,257 |
| Events in quadrant B | 4,036,839 | 675,850 |
| Events in quadrant C | 10,065,634 | 54,961 |
| Events in quadrant D | 12,362,673 | 322,552 |
| Mode M9 | |||
|---|---|---|---|
| Quadrant | BADHDUFLAG | Total packets | Discarded packets |
| A | 0 | 12 | 0 |
| B | 0 | 12 | 0 |
| C | 0 | 12 | 0 |
| D | 0 | 12 | 0 |
| Mode SS | |||
|---|---|---|---|
| Quadrant | BADHDUFLAG | Total packets | Discarded packets |
| A | 0 | 124 | 0 |
| B | 0 | 124 | 0 |
| C | 0 | 124 | 0 |
| D | 0 | 124 | 0 |
| Mode M0 | |||
|---|---|---|---|
| Quadrant | BADHDUFLAG | Total packets | Discarded packets |
| A | 0 | 48139 | 5 |
| B | 0 | 16040 | 1 |
| C | 0 | 34206 | 1 |
| D | 0 | 41001 | 1 |
| Quadrant | Total seconds | Saturated seconds | Saturation percentage |
|---|---|---|---|
| A | 6210 | 5583 | 89.903382% |
| B | 6210 | 240 | 3.864734% |
| C | 6210 | 5781 | 93.091787% |
| D | 6210 | 3044 | 49.017713% |
Noise dominated data is calculated using 1-second bins in cleaned event files. If a bin has >2000 counts, and if more than 50% of those come from <1% of pixels, then it is considered to be noise-dominated and hence unusable.
| Quadrant | # 1 sec bins | Bins with >0 counts | Bins with >2000 counts | High rate bins dominated by noise | Noise dominated (total time) | Noise dominated (detector-on time) | Marked lightcurve |
|---|---|---|---|---|---|---|---|
| A | 7350 | 6210 | 5578 | 5578 | 75.89% | 89.82% | 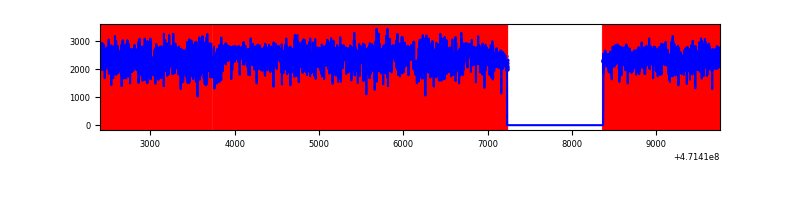 |
| B | 7350 | 6210 | 101 | 101 | 1.37% | 1.63% | 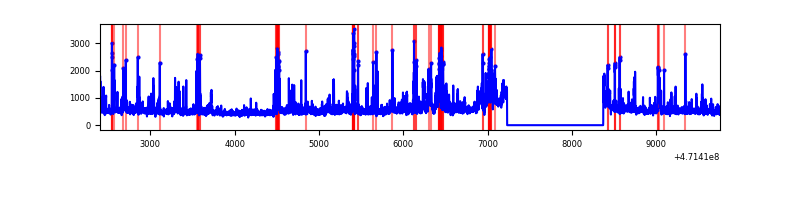 |
| C | 7349 | 6209 | 1265 | 1265 | 17.21% | 20.37% | 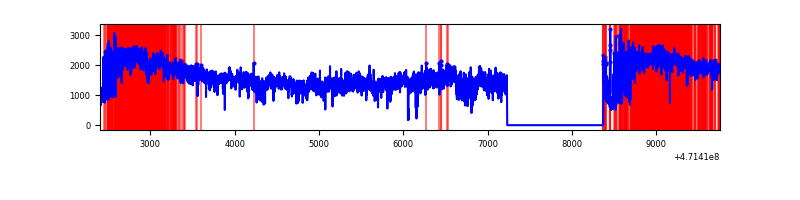 |
| D | 7350 | 6210 | 3133 | 3133 | 42.63% | 50.45% | 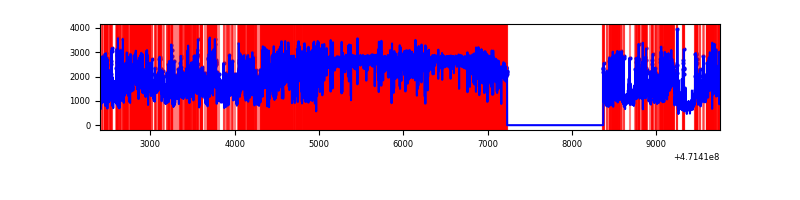 |
Top three noisy pixels from each quadrant. If the there are fewer than three noisy pixels in the level2.evt file, extra rows are filled as -1
| Pixel properties | Quadrant properties | ||||||
|---|---|---|---|---|---|---|---|
| Quadrant | DetID | PixID | Counts | Sigma | Mean | Median | Sigma |
| A | 10 | 83 | 6777707 | 50574.97 | 483 | 469 | 134.0 |
| A | 7 | 64 | 1102805 | 8226.16 | 483 | 469 | 134.0 |
| A | 15 | 191 | 912912 | 6809.08 | 483 | 469 | 134.0 |
| B | 1 | 207 | 306423 | 2069.19 | 697 | 674 | 147.8 |
| B | 4 | 21 | 246846 | 1666.0 | 697 | 674 | 147.8 |
| B | 4 | 206 | 246379 | 1662.83 | 697 | 674 | 147.8 |
| C | 15 | 180 | 5000622 | 107021.44 | 131 | 129 | 46.7 |
| C | 15 | 163 | 806486 | 17257.8 | 131 | 129 | 46.7 |
| C | 15 | 190 | 735039 | 15728.67 | 131 | 129 | 46.7 |
| D | 15 | 168 | 3273842 | 20688.33 | 536 | 517 | 158.2 |
| D | 12 | 6 | 942080 | 5950.94 | 536 | 517 | 158.2 |
| D | 15 | 169 | 731232 | 4618.32 | 536 | 517 | 158.2 |
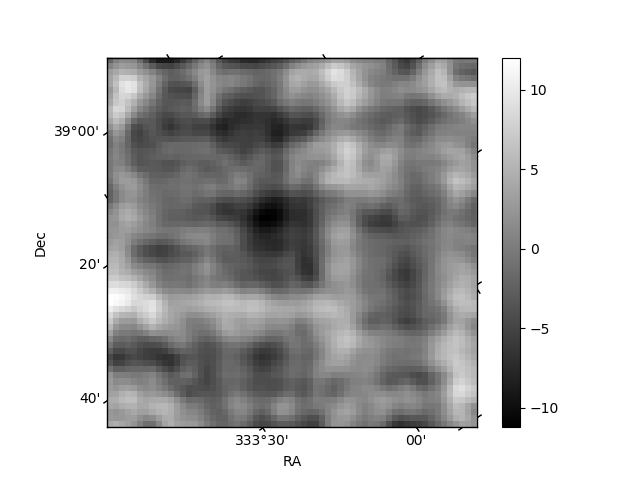
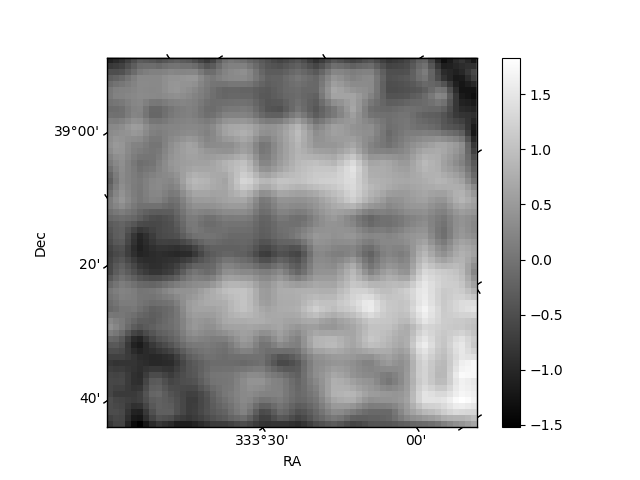
Histogram calculated using DETX and DETY for each event in the final _common_clean file
| Quadrant A | 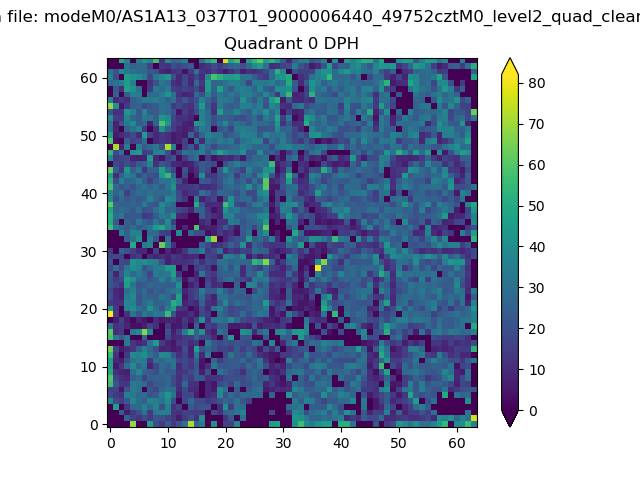 |
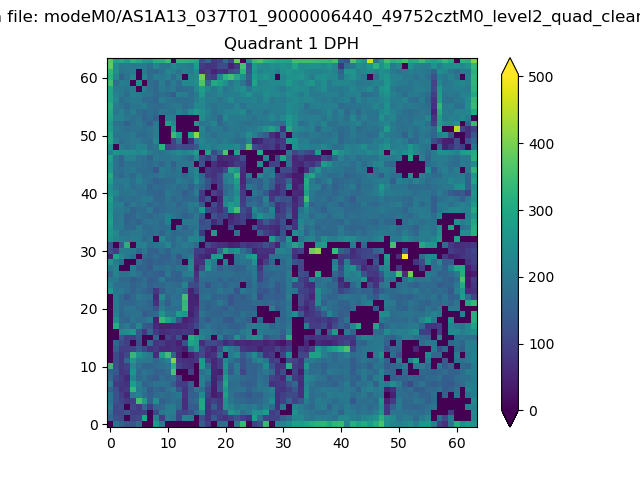 |
Quadrant B |
|---|---|---|---|
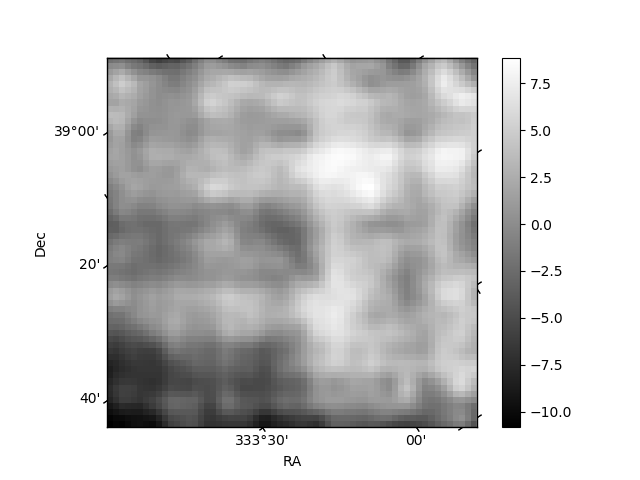
| Quadrant D | 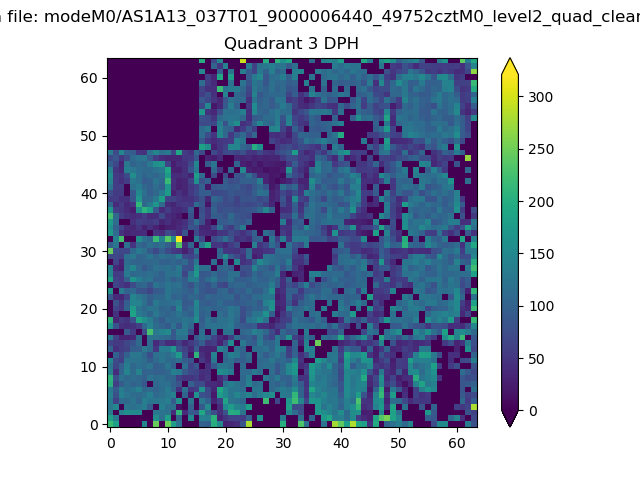 |
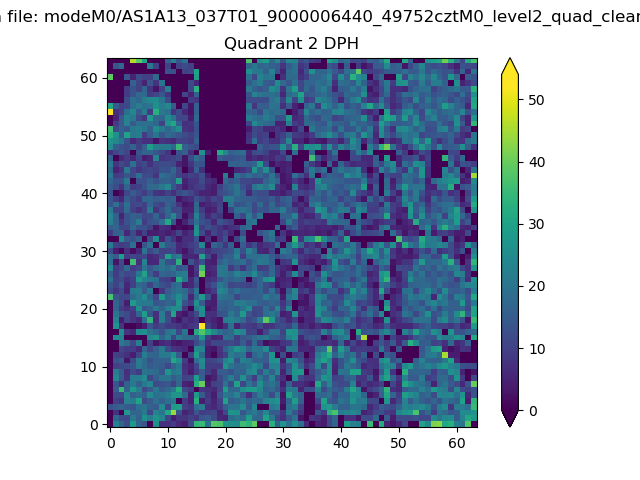 |
Quadrant C |
| Plot type | Count rate plots | Images |
|---|---|---|
| Comparison with Poisson distribution Blue bars denote a histogram of data divided into 1 sec bins. Red curve is a Poisson curve with rate = median count rate of data. |
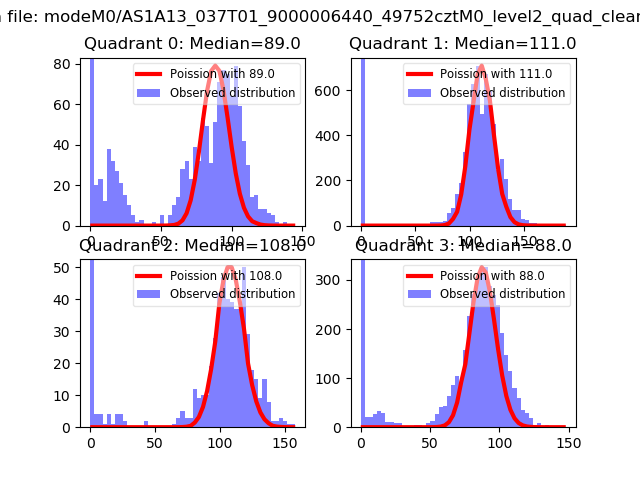 |
 |
| Quadrant-wise count rates Data is divided into 100 sec bins |
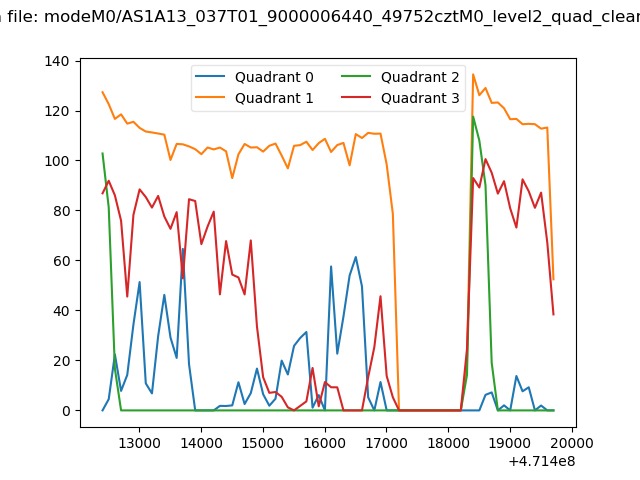 |
|
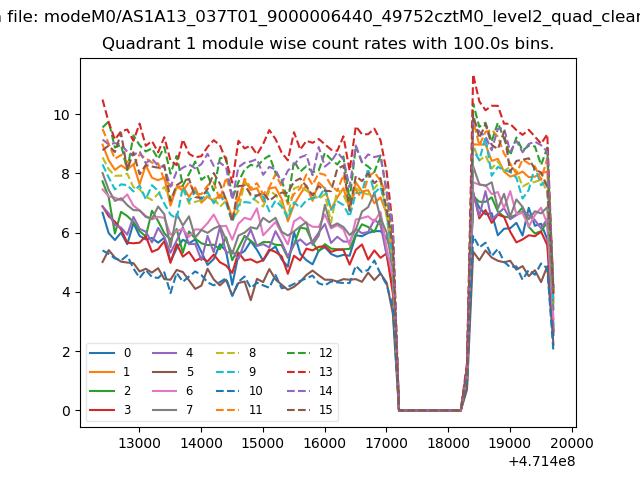
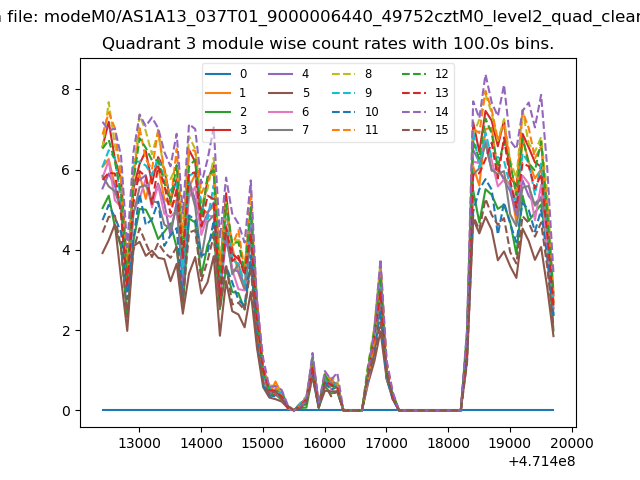
| Module-wise count rates for Quadrant A Data is divided into 100 sec bins |
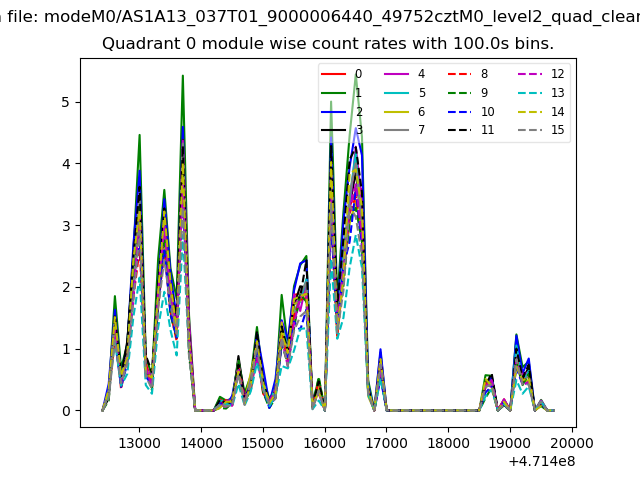 |
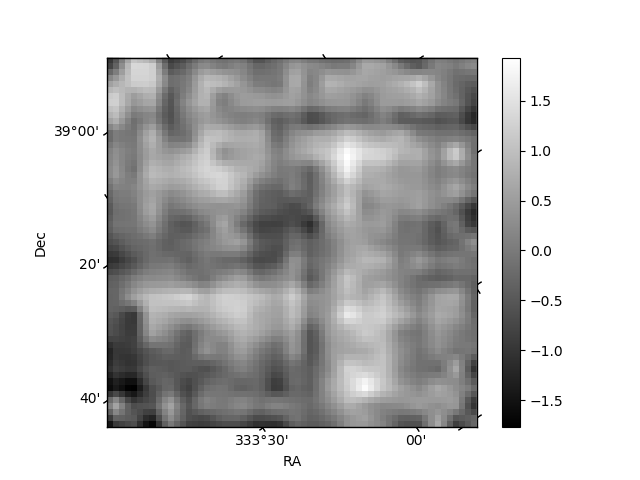 |
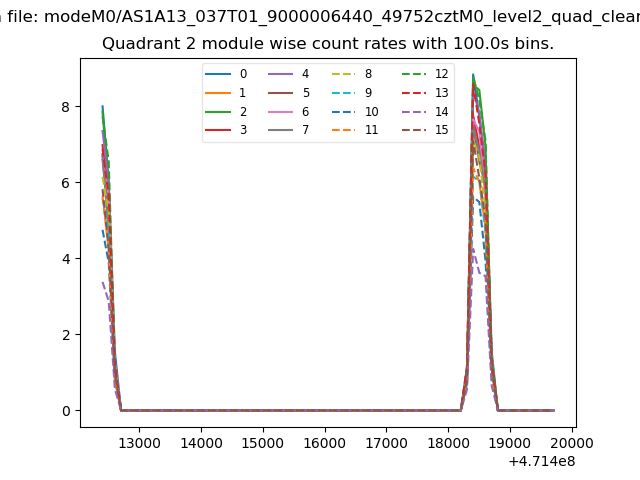
| Module-wise count rates for Quadrant B Data is divided into 100 sec bins |
 |
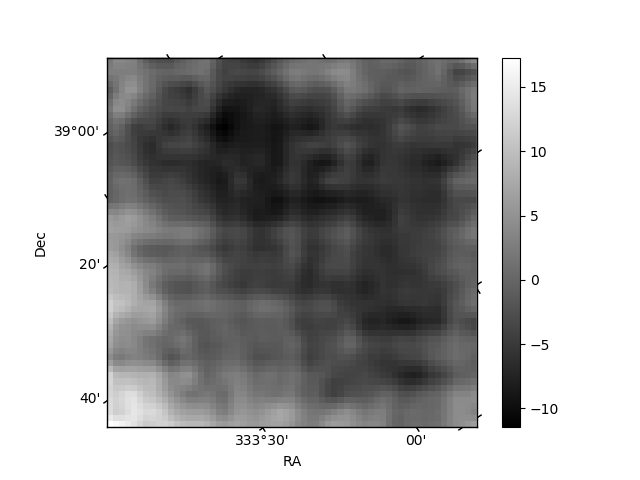 |
| Module-wise count rates for Quadrant C Data is divided into 100 sec bins |
 |
 |
| Module-wise count rates for Quadrant D Data is divided into 100 sec bins |
 |
 |
| Parameter | Plot |
|---|---|
| CZT HV Monitor | 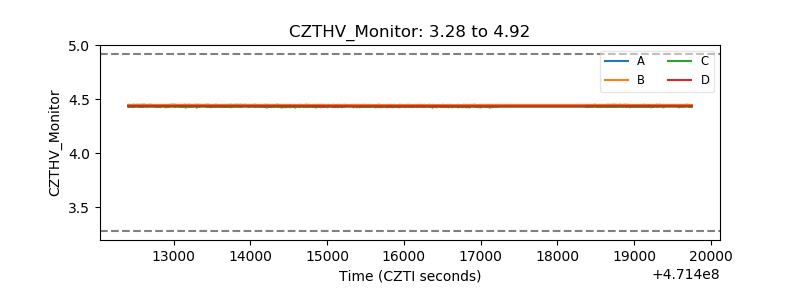 |
| D_VDD | 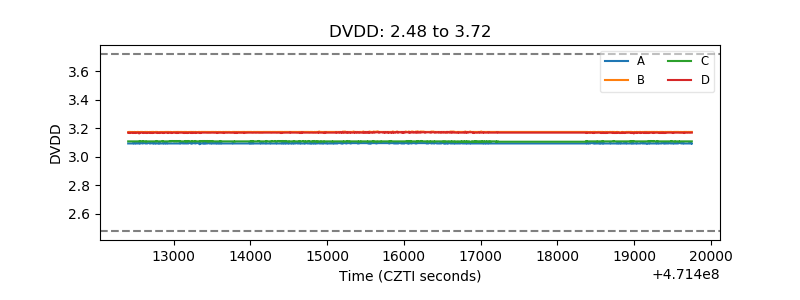 |
| Temperature 1 | 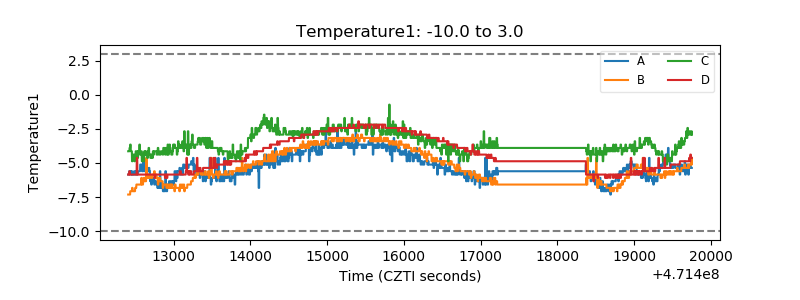 |
| Veto HV Monitor | 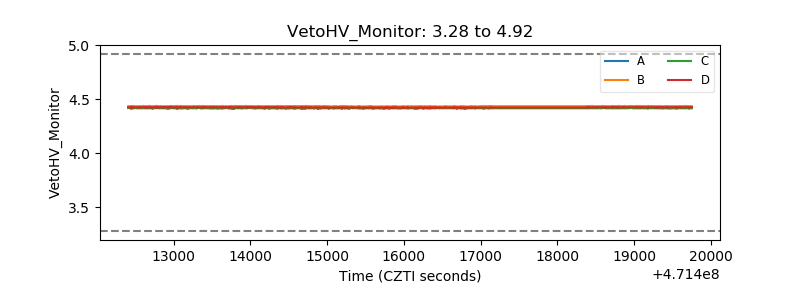 |
| Veto LLD | 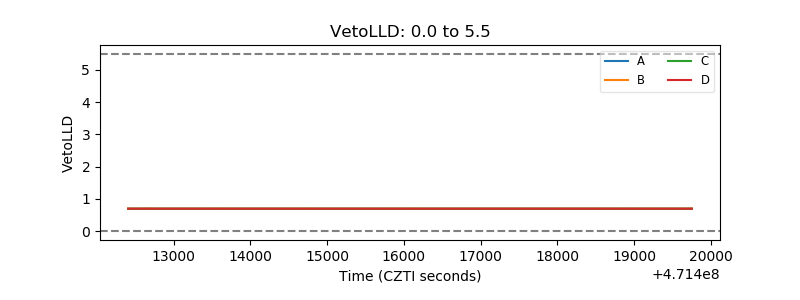 |
| Alpha Counter | 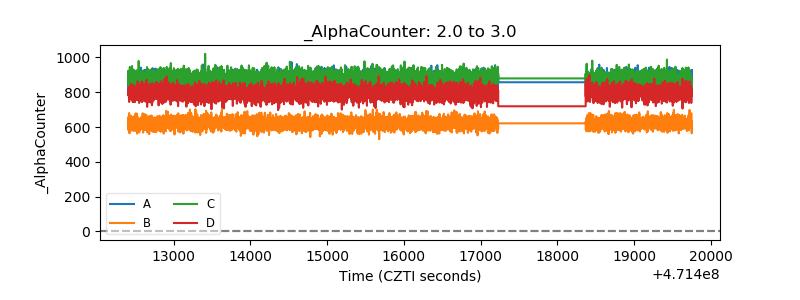 |
| _CPM_Rate | 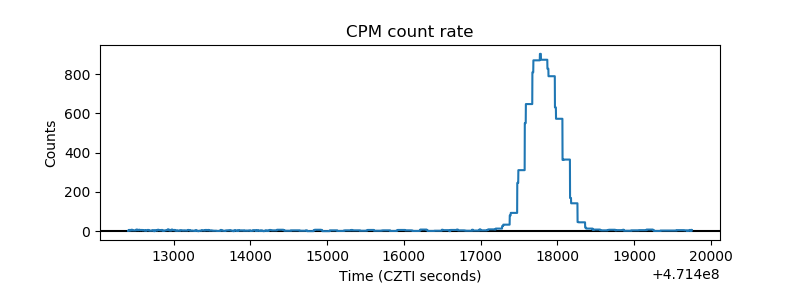 |
| CZT Counter | 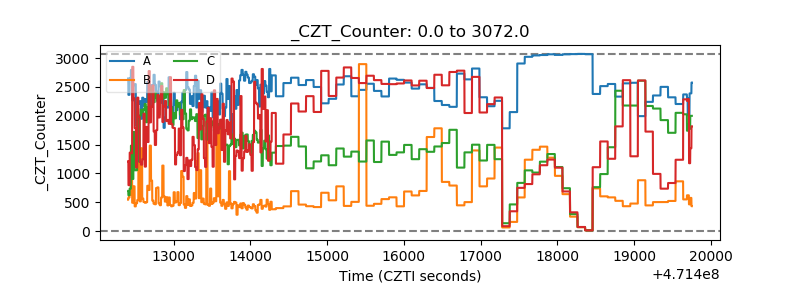 |
| +2.5 Volts monitor | 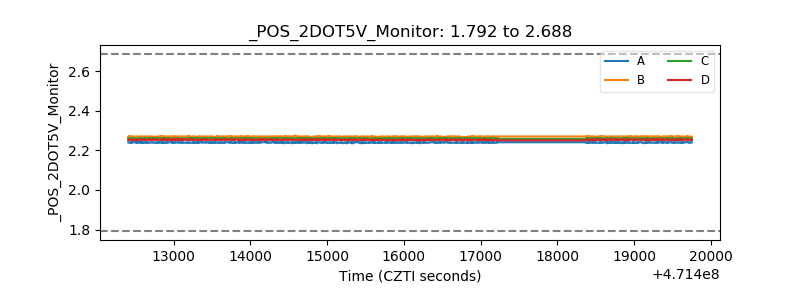 |
| +5 Volts monitor | 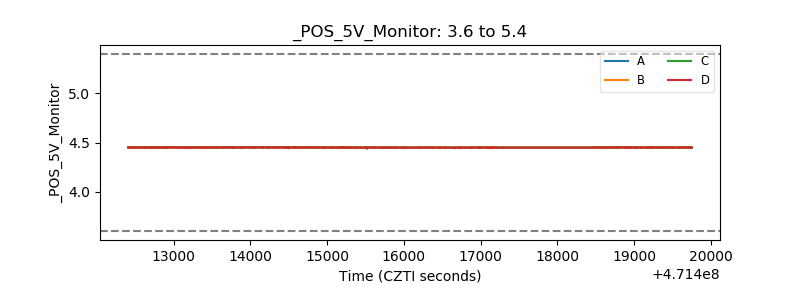 |
| _ROLL_ROT | 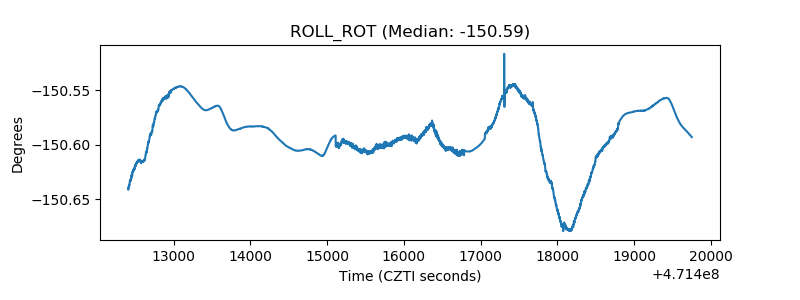 |
| _Roll_DEC | 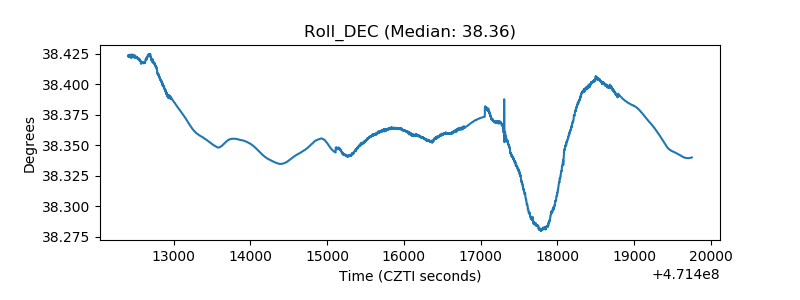 |
| _Roll_RA | 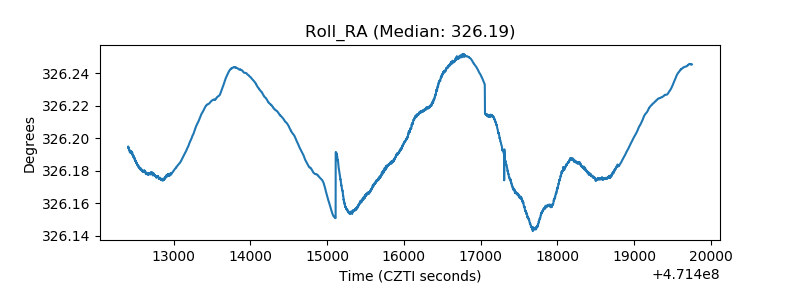 |
| Veto Counter | 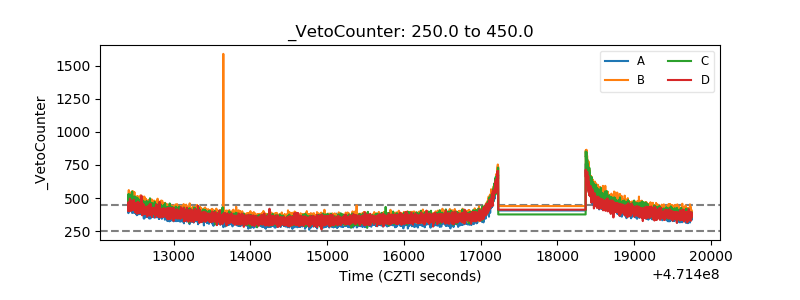 |