| Param | Original file | Final file |
|---|---|---|
| Filename | modeM0/AS1A13_037T01_9000006440_49755cztM0_level2.fits | modeM0/AS1A13_037T01_9000006440_49755cztM0_level2_quad_clean.evt |
| Size (bytes) | 1,255,429,440 | 43,787,520 |
| Size | 1.2 GB | 41.8 MB |
| Events in quadrant A | 15,467,036 | 62,393 |
| Events in quadrant B | 5,171,935 | 635,625 |
| Events in quadrant C | 10,653,029 | 694 |
| Events in quadrant D | 14,680,968 | 176,365 |
| Mode M9 | |||
|---|---|---|---|
| Quadrant | BADHDUFLAG | Total packets | Discarded packets |
| A | 0 | 8 | 0 |
| B | 0 | 8 | 0 |
| C | 0 | 8 | 0 |
| D | 0 | 8 | 0 |
| Mode SS | |||
|---|---|---|---|
| Quadrant | BADHDUFLAG | Total packets | Discarded packets |
| A | 0 | 132 | 0 |
| B | 0 | 132 | 0 |
| C | 0 | 132 | 0 |
| D | 0 | 132 | 0 |
| Mode M0 | |||
|---|---|---|---|
| Quadrant | BADHDUFLAG | Total packets | Discarded packets |
| A | 0 | 50259 | 8 |
| B | 0 | 19761 | 1 |
| C | 0 | 36134 | 1 |
| D | 0 | 48042 | 1 |
| Quadrant | Total seconds | Saturated seconds | Saturation percentage |
|---|---|---|---|
| A | 6460 | 6018 | 93.157895% |
| B | 6460 | 523 | 8.095975% |
| C | 6461 | 6458 | 99.953568% |
| D | 6461 | 4714 | 72.960842% |
Noise dominated data is calculated using 1-second bins in cleaned event files. If a bin has >2000 counts, and if more than 50% of those come from <1% of pixels, then it is considered to be noise-dominated and hence unusable.
| Quadrant | # 1 sec bins | Bins with >0 counts | Bins with >2000 counts | High rate bins dominated by noise | Noise dominated (total time) | Noise dominated (detector-on time) | Marked lightcurve |
|---|---|---|---|---|---|---|---|
| A | 7200 | 6460 | 5913 | 5913 | 82.12% | 91.53% | 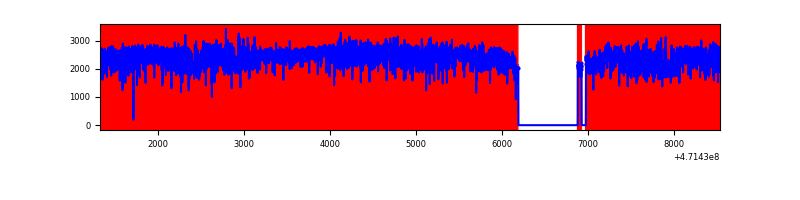 |
| B | 7200 | 6460 | 316 | 316 | 4.39% | 4.89% | 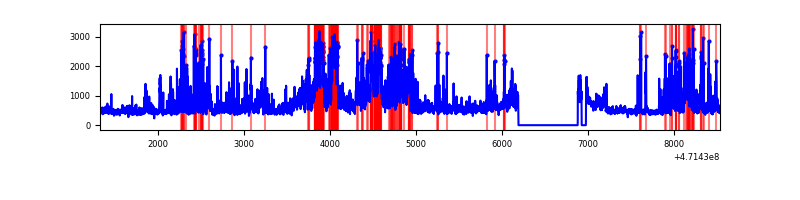 |
| C | 7200 | 6460 | 1157 | 1157 | 16.07% | 17.91% | 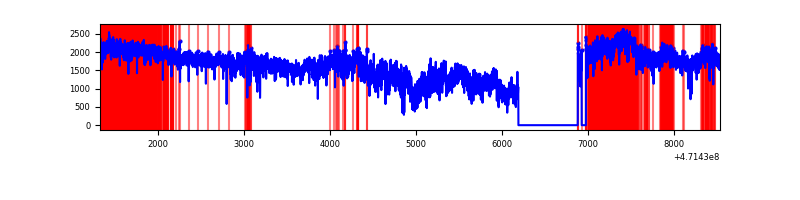 |
| D | 7201 | 6462 | 4699 | 4699 | 65.25% | 72.72% | 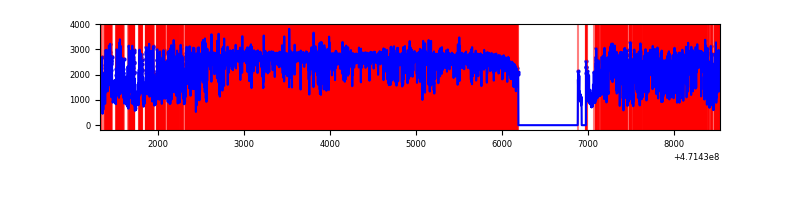 |
Top three noisy pixels from each quadrant. If the there are fewer than three noisy pixels in the level2.evt file, extra rows are filled as -1
| Pixel properties | Quadrant properties | ||||||
|---|---|---|---|---|---|---|---|
| Quadrant | DetID | PixID | Counts | Sigma | Mean | Median | Sigma |
| A | 10 | 83 | 6598732 | 54784.79 | 435 | 422 | 120.4 |
| A | 7 | 64 | 1275398 | 10585.94 | 435 | 422 | 120.4 |
| A | 3 | 99 | 1037826 | 8613.41 | 435 | 422 | 120.4 |
| B | 10 | 28 | 750250 | 5067.48 | 687 | 666 | 147.9 |
| B | 4 | 206 | 447312 | 3019.5 | 687 | 666 | 147.9 |
| B | 4 | 21 | 322392 | 2174.99 | 687 | 666 | 147.9 |
| C | 15 | 180 | 4520229 | 153173.75 | 73 | 70 | 29.5 |
| C | 15 | 190 | 1474245 | 49955.08 | 73 | 70 | 29.5 |
| C | 15 | 163 | 923576 | 31294.67 | 73 | 70 | 29.5 |
| D | 12 | 6 | 2474087 | 16755.75 | 461 | 440 | 147.6 |
| D | 15 | 168 | 2389957 | 16185.88 | 461 | 440 | 147.6 |
| D | 15 | 185 | 1934257 | 13099.1 | 461 | 440 | 147.6 |
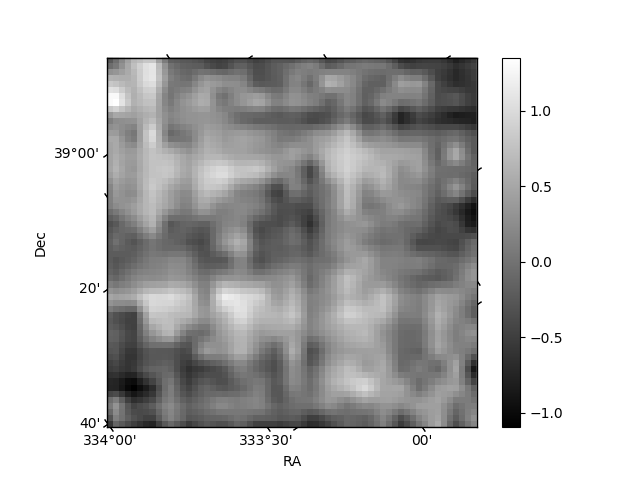
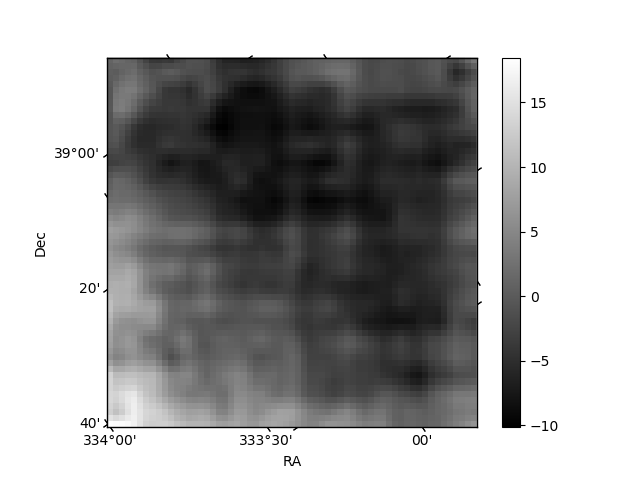
Histogram calculated using DETX and DETY for each event in the final _common_clean file
| Quadrant A | 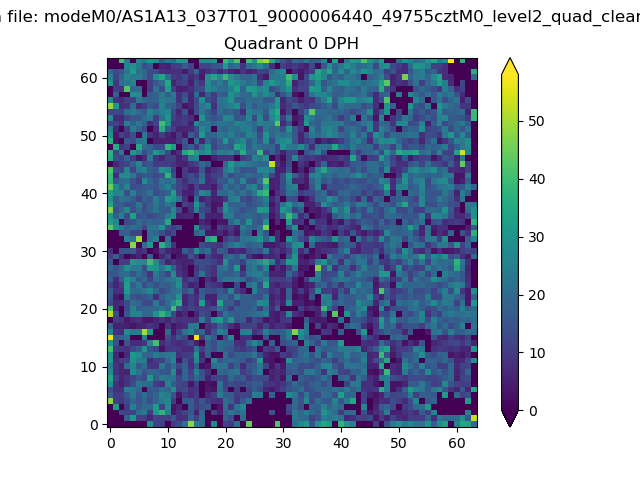 |
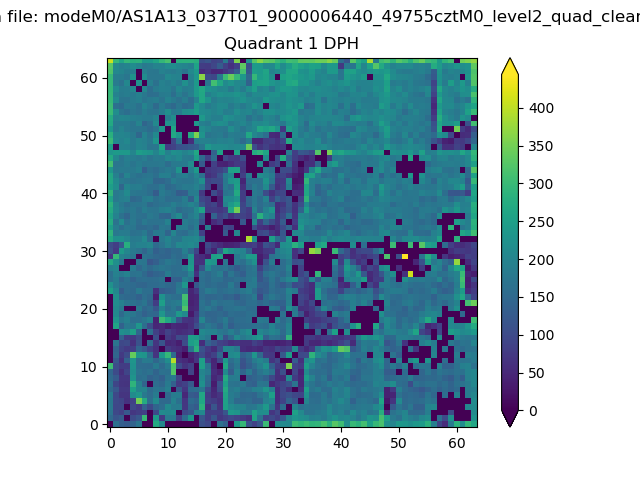 |
Quadrant B |
|---|---|---|---|
| Quadrant D | 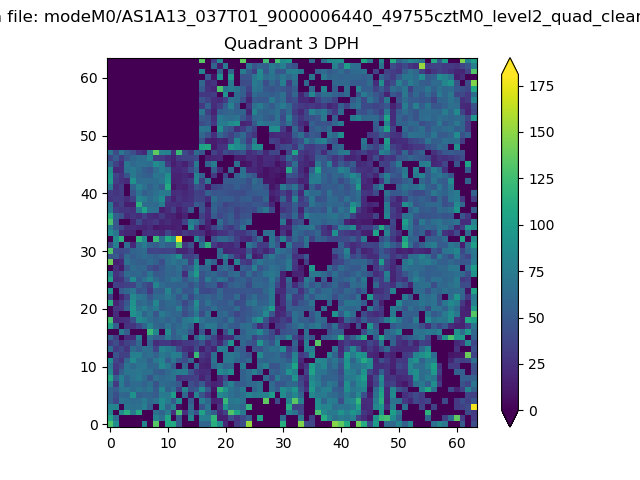 |
 |
Quadrant C |
| Plot type | Count rate plots | Images |
|---|---|---|
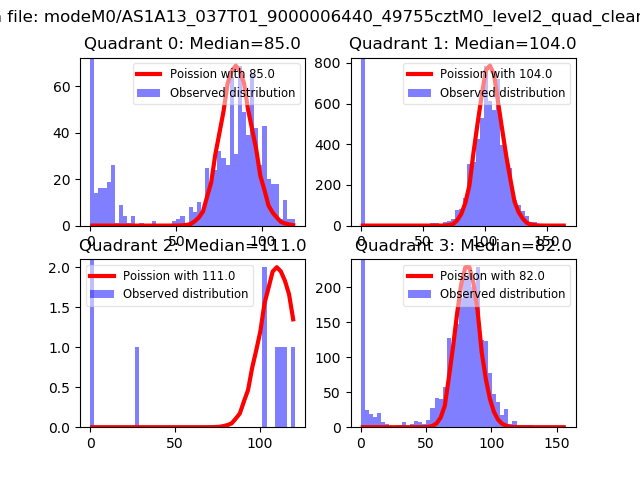
| Comparison with Poisson distribution Blue bars denote a histogram of data divided into 1 sec bins. Red curve is a Poisson curve with rate = median count rate of data. |
 |
 |
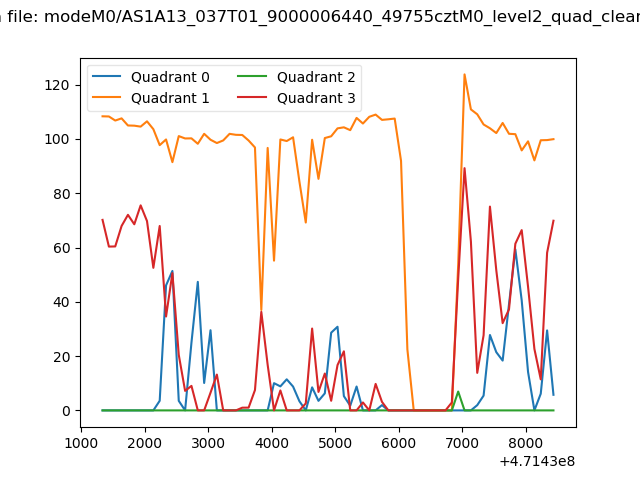
| Quadrant-wise count rates Data is divided into 100 sec bins |
 |
|
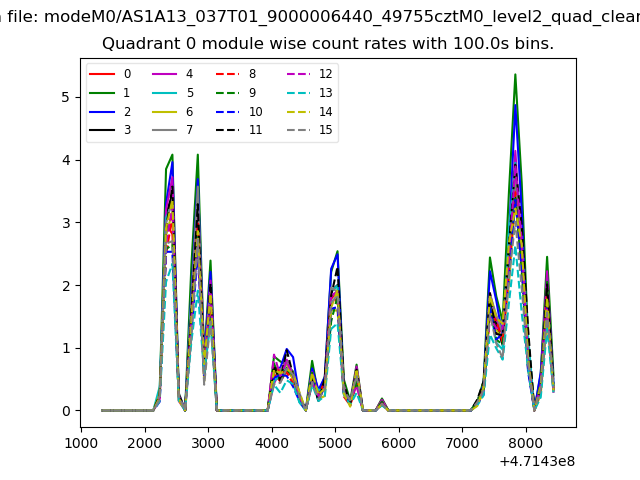
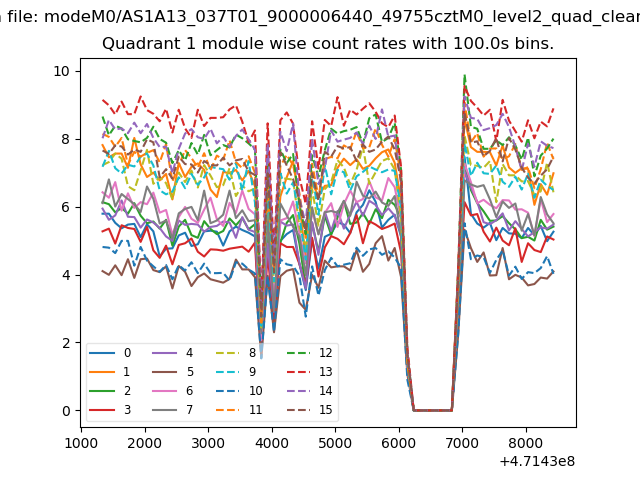
| Module-wise count rates for Quadrant A Data is divided into 100 sec bins |
 |
 |
| Module-wise count rates for Quadrant B Data is divided into 100 sec bins |
 |
 |
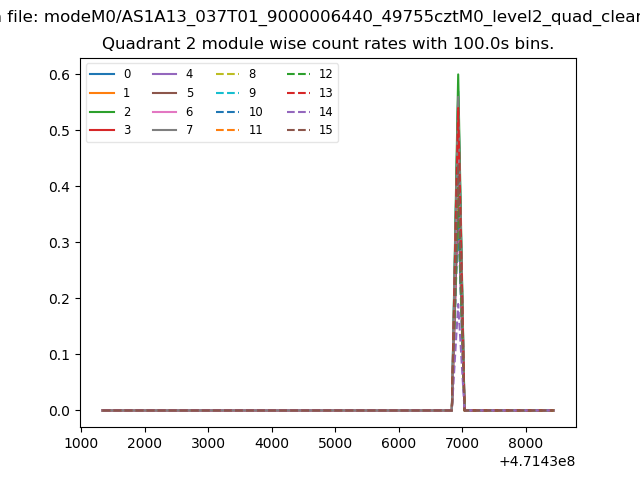
| Module-wise count rates for Quadrant C Data is divided into 100 sec bins |
 |
 |
| Module-wise count rates for Quadrant D Data is divided into 100 sec bins |
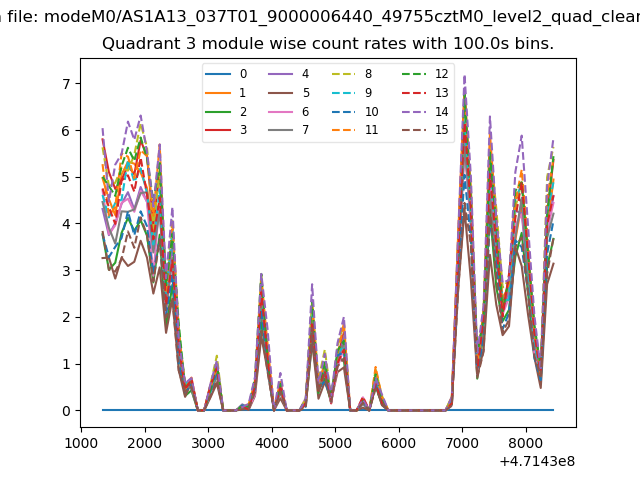 |
 |
| Parameter | Plot |
|---|---|
| CZT HV Monitor | 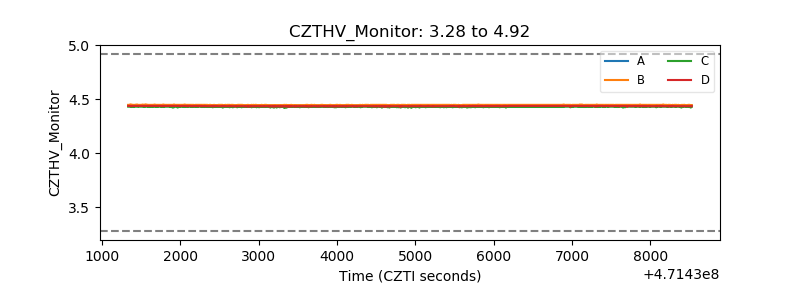 |
| D_VDD | 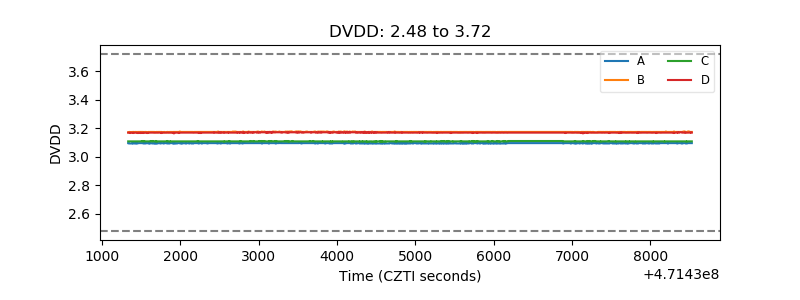 |
| Temperature 1 | 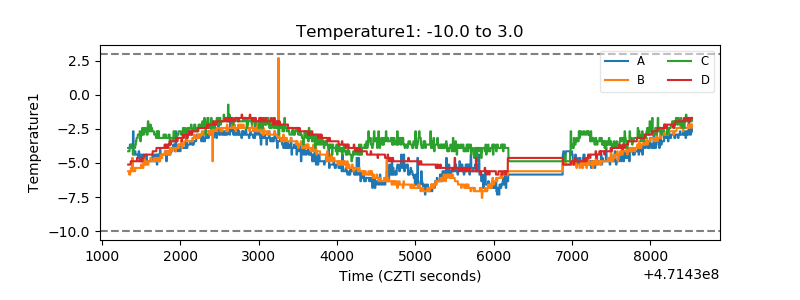 |
| Veto HV Monitor | 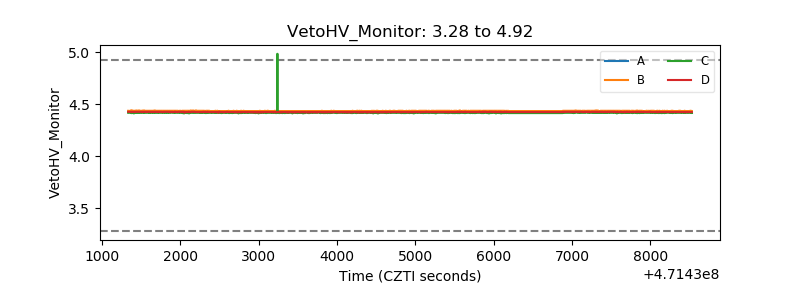 |
| Veto LLD | 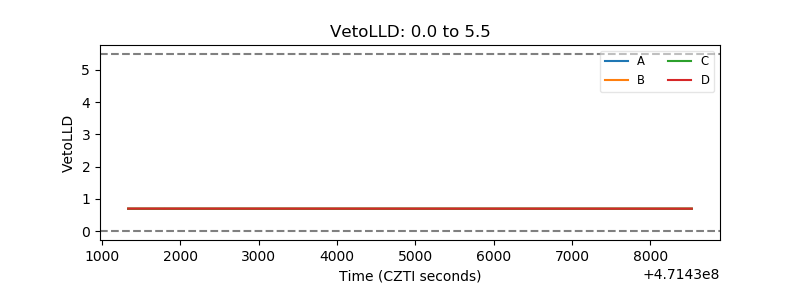 |
| Alpha Counter | 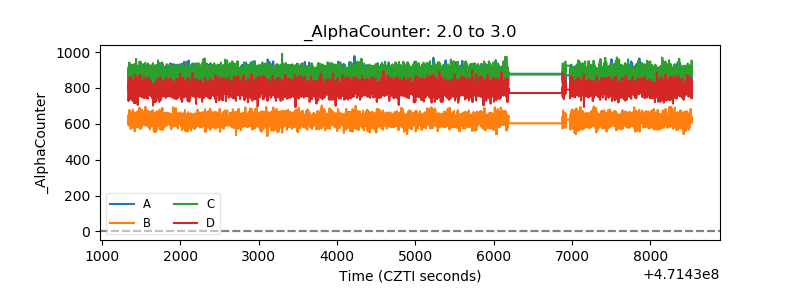 |
| _CPM_Rate | 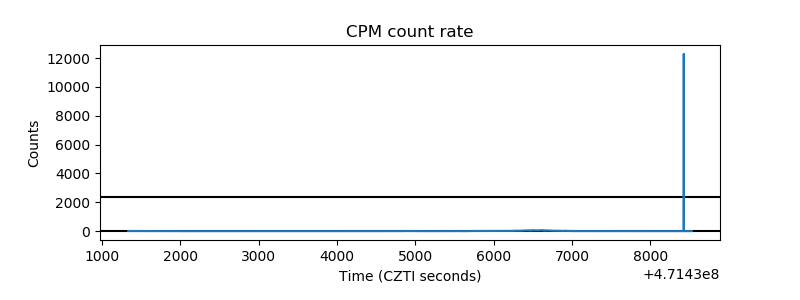 |
| CZT Counter | 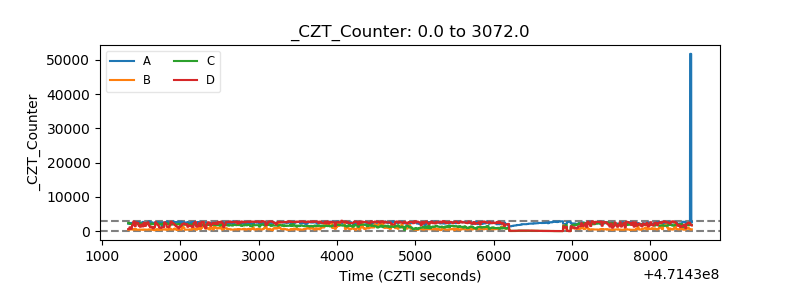 |
| +2.5 Volts monitor |  |
| +5 Volts monitor |  |
| _ROLL_ROT | 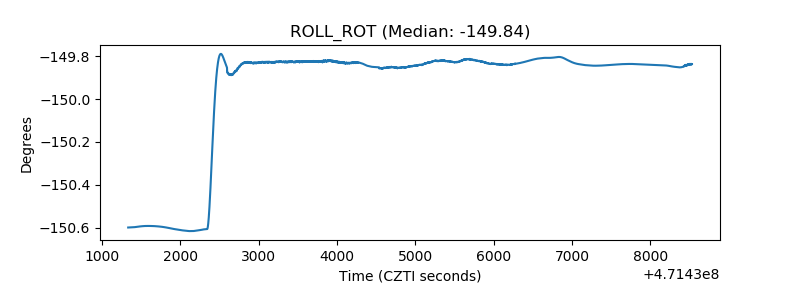 |
| _Roll_DEC | 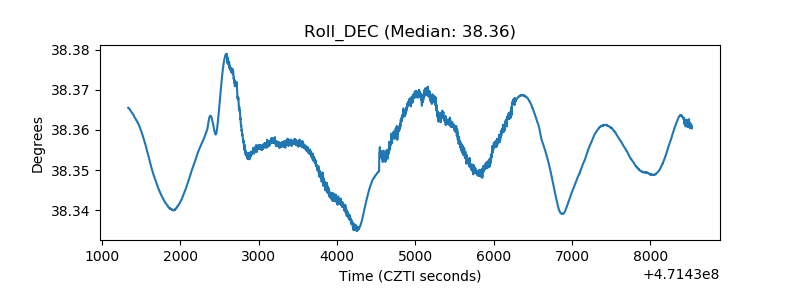 |
| _Roll_RA | 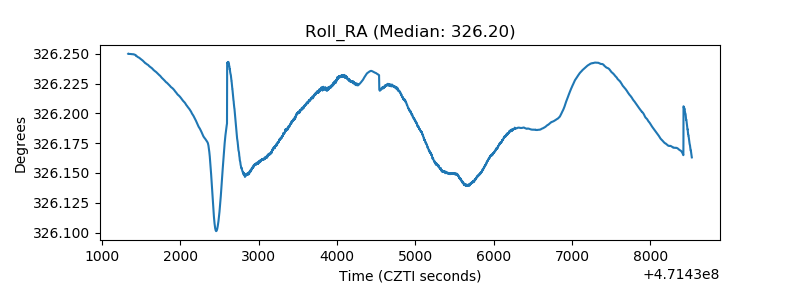 |
| Veto Counter | 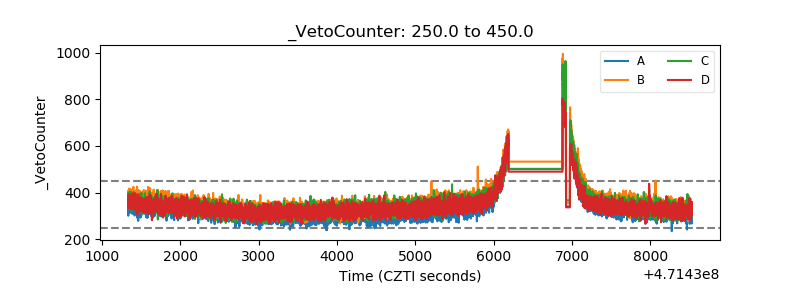 |