| Param | Original file | Final file |
|---|---|---|
| Filename | modeM0/AS1A13_037T01_9000006440_49756cztM0_level2.fits | modeM0/AS1A13_037T01_9000006440_49756cztM0_level2_quad_clean.evt |
| Size (bytes) | 1,383,289,920 | 64,036,800 |
| Size | 1.3 GB | 61.1 MB |
| Events in quadrant A | 18,026,534 | 337,195 |
| Events in quadrant B | 4,999,545 | 738,154 |
| Events in quadrant C | 9,925,037 | 12,099 |
| Events in quadrant D | 17,694,043 | 337,427 |
| Mode SS | |||
|---|---|---|---|
| Quadrant | BADHDUFLAG | Total packets | Discarded packets |
| A | 0 | 144 | 0 |
| B | 0 | 144 | 0 |
| C | 0 | 144 | 0 |
| D | 0 | 144 | 0 |
| Mode M0 | |||
|---|---|---|---|
| Quadrant | BADHDUFLAG | Total packets | Discarded packets |
| A | 0 | 58518 | 0 |
| B | 0 | 19698 | 0 |
| C | 0 | 34570 | 0 |
| D | 0 | 57533 | 0 |
| Quadrant | Total seconds | Saturated seconds | Saturation percentage |
|---|---|---|---|
| A | 7241 | 6875 | 94.945450% |
| B | 7242 | 622 | 8.588788% |
| C | 7242 | 7242 | 100.000000% |
| D | 7242 | 6279 | 86.702568% |
Noise dominated data is calculated using 1-second bins in cleaned event files. If a bin has >2000 counts, and if more than 50% of those come from <1% of pixels, then it is considered to be noise-dominated and hence unusable.
| Quadrant | # 1 sec bins | Bins with >0 counts | Bins with >2000 counts | High rate bins dominated by noise | Noise dominated (total time) | Noise dominated (detector-on time) | Marked lightcurve |
|---|---|---|---|---|---|---|---|
| A | 7240 | 7240 | 6767 | 6767 | 93.47% | 93.47% | 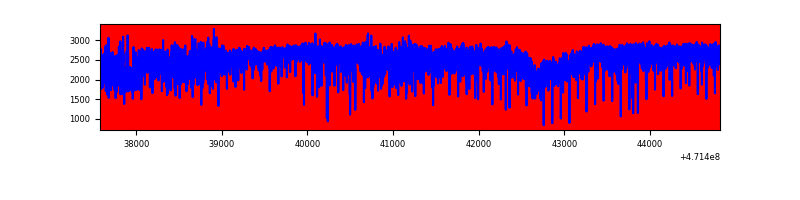 |
| B | 7242 | 7242 | 228 | 228 | 3.15% | 3.15% | 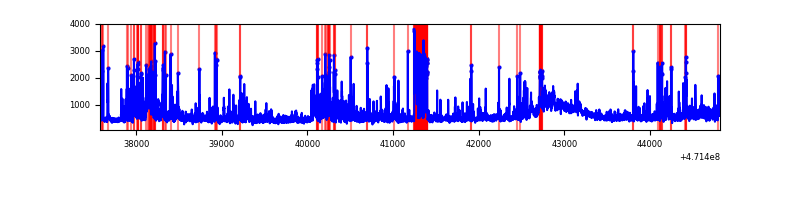 |
| C | 7241 | 7241 | 131 | 131 | 1.81% | 1.81% | 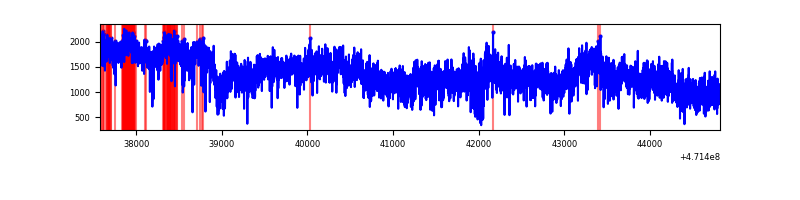 |
| D | 7241 | 7241 | 6290 | 6290 | 86.87% | 86.87% | 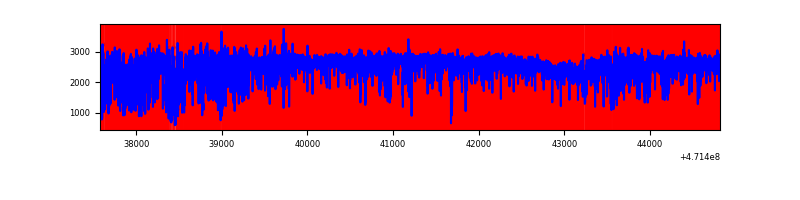 |
Top three noisy pixels from each quadrant. If the there are fewer than three noisy pixels in the level2.evt file, extra rows are filled as -1
| Pixel properties | Quadrant properties | ||||||
|---|---|---|---|---|---|---|---|
| Quadrant | DetID | PixID | Counts | Sigma | Mean | Median | Sigma |
| A | 10 | 83 | 5946844 | 52482.27 | 407 | 393 | 113.3 |
| A | 0 | 98 | 2757843 | 24336.74 | 407 | 393 | 113.3 |
| A | 12 | 50 | 1258920 | 11107.52 | 407 | 393 | 113.3 |
| B | 4 | 206 | 413458 | 2390.66 | 799 | 773 | 172.6 |
| B | 5 | 185 | 395201 | 2284.9 | 799 | 773 | 172.6 |
| B | 4 | 21 | 248319 | 1434.02 | 799 | 773 | 172.6 |
| C | 15 | 180 | 3573364 | 139456.7 | 36 | 33 | 25.6 |
| C | 15 | 190 | 1550969 | 60528.51 | 36 | 33 | 25.6 |
| C | 15 | 181 | 993594 | 38775.79 | 36 | 33 | 25.6 |
| D | 15 | 168 | 4052800 | 27248.2 | 446 | 425 | 148.7 |
| D | 8 | 129 | 1985617 | 13348.44 | 446 | 425 | 148.7 |
| D | 15 | 185 | 1915514 | 12877.07 | 446 | 425 | 148.7 |
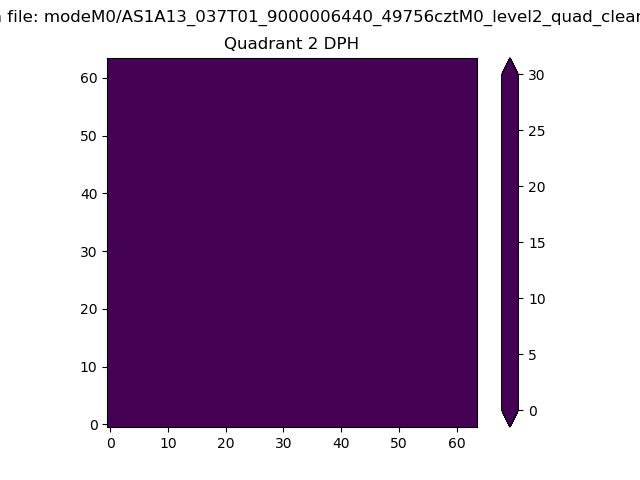
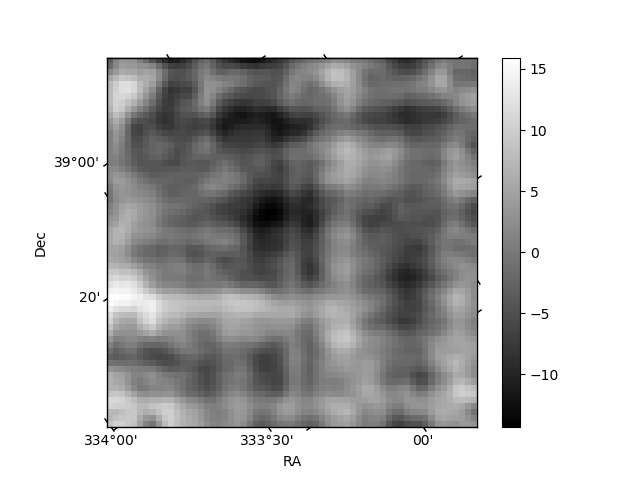
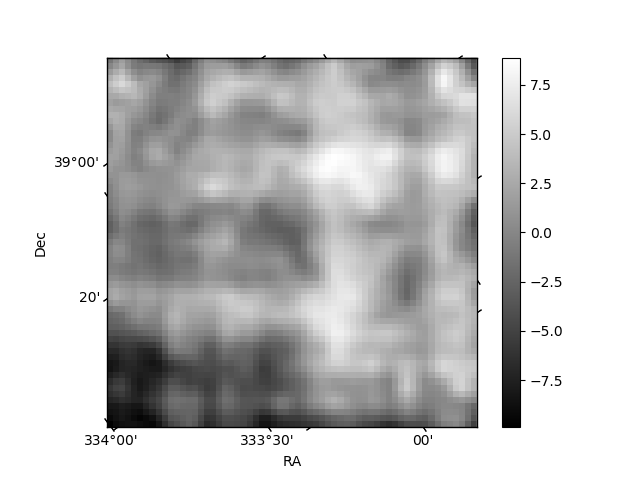
Histogram calculated using DETX and DETY for each event in the final _common_clean file
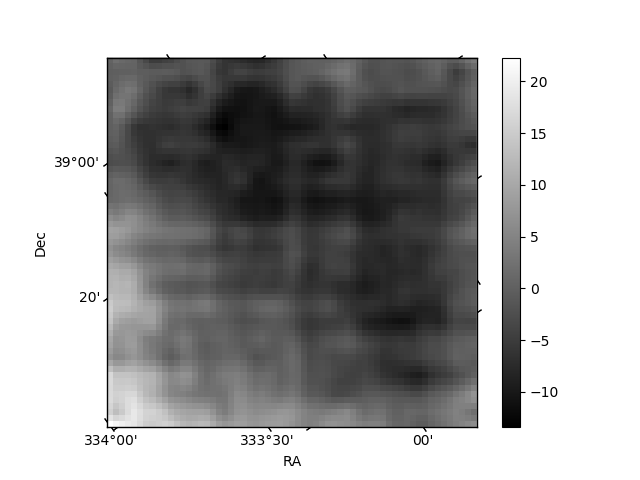
| Quadrant A | 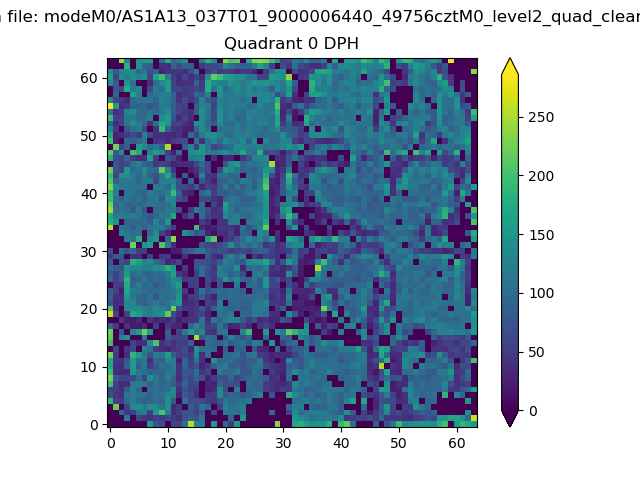 |
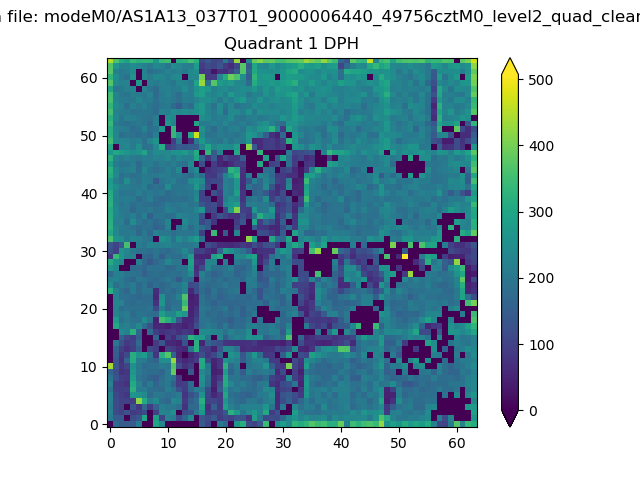 |
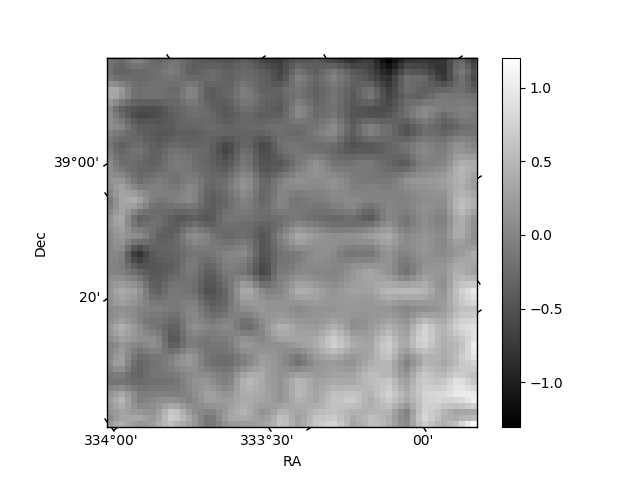
Quadrant B |
|---|---|---|---|
| Quadrant D | 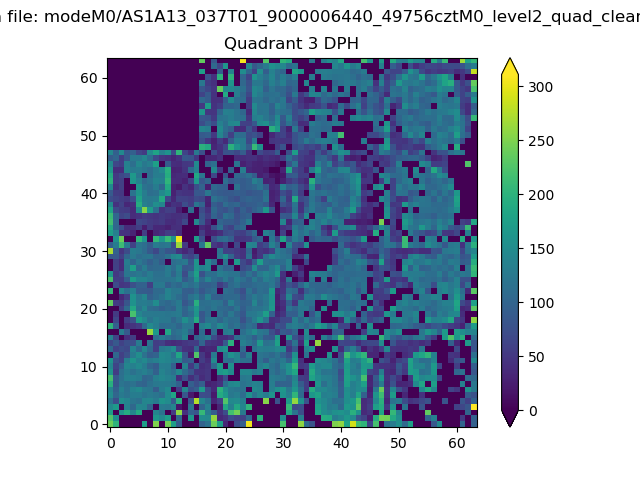 |
 |
Quadrant C |
| Plot type | Count rate plots | Images |
|---|---|---|
| Comparison with Poisson distribution Blue bars denote a histogram of data divided into 1 sec bins. Red curve is a Poisson curve with rate = median count rate of data. |
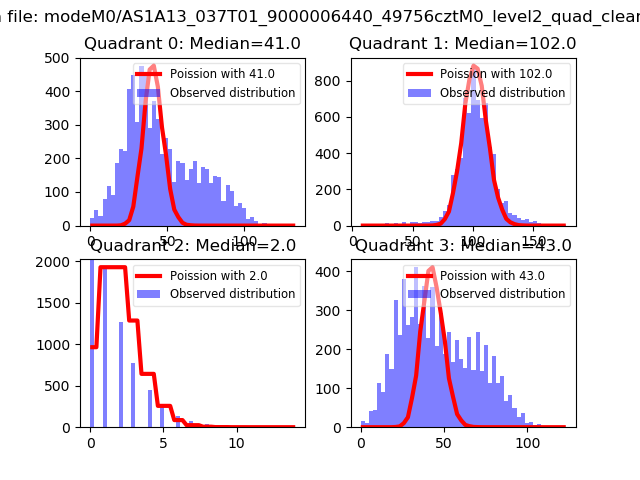 |
 |
| Quadrant-wise count rates Data is divided into 100 sec bins |
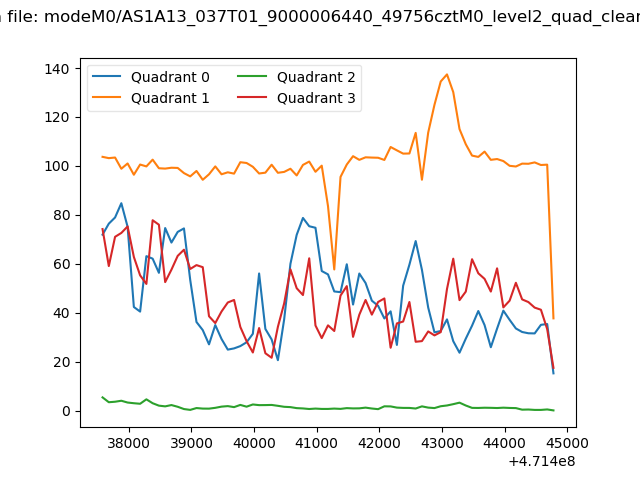 |
|
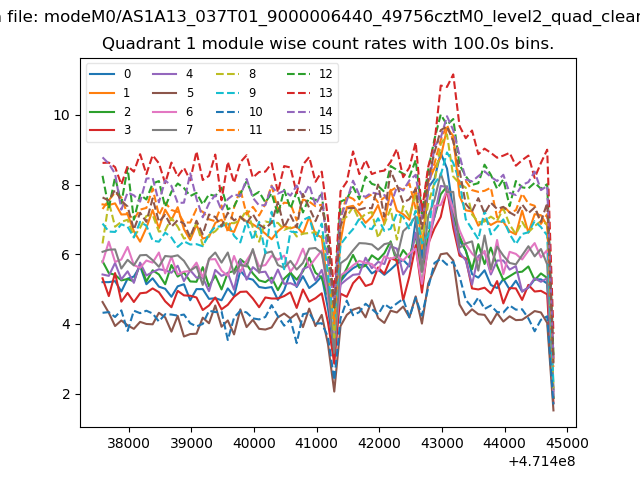
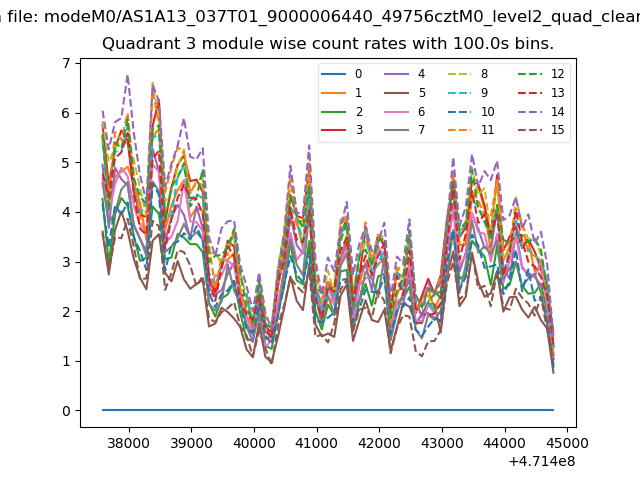
| Module-wise count rates for Quadrant A Data is divided into 100 sec bins |
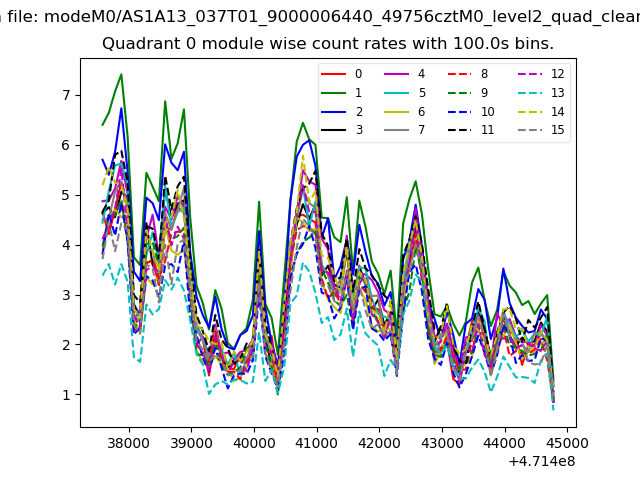 |
 |
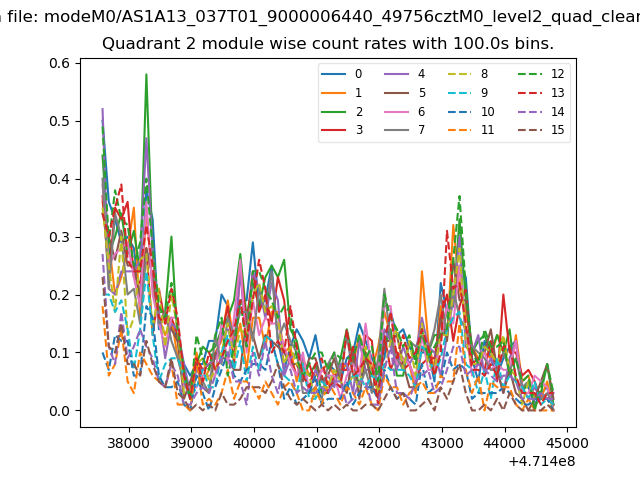
| Module-wise count rates for Quadrant B Data is divided into 100 sec bins |
 |
 |
| Module-wise count rates for Quadrant C Data is divided into 100 sec bins |
 |
 |
| Module-wise count rates for Quadrant D Data is divided into 100 sec bins |
 |
 |
| Parameter | Plot |
|---|---|
| CZT HV Monitor | 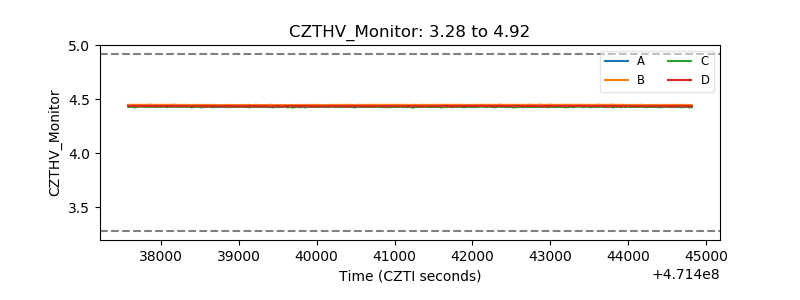 |
| D_VDD | 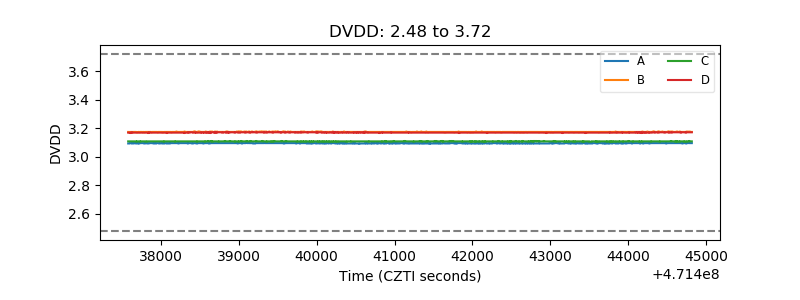 |
| Temperature 1 | 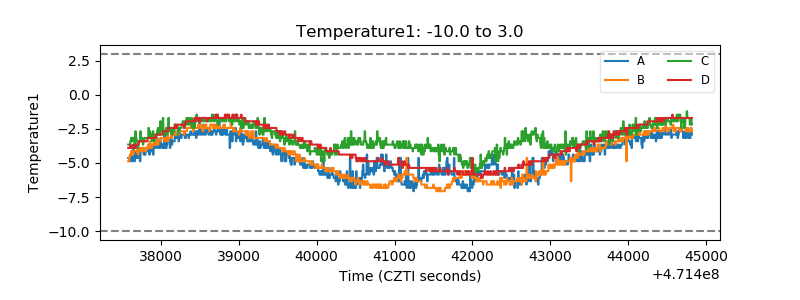 |
| Veto HV Monitor |  |
| Veto LLD | 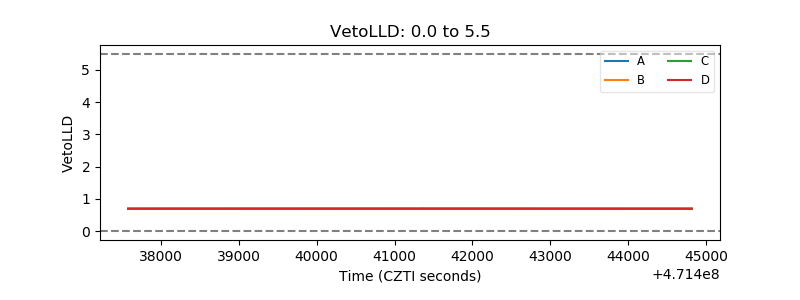 |
| Alpha Counter | 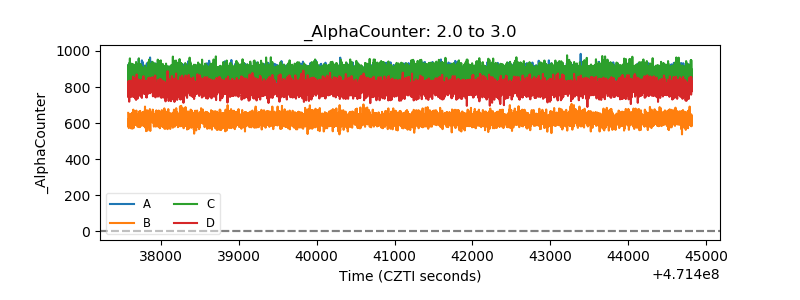 |
| _CPM_Rate | 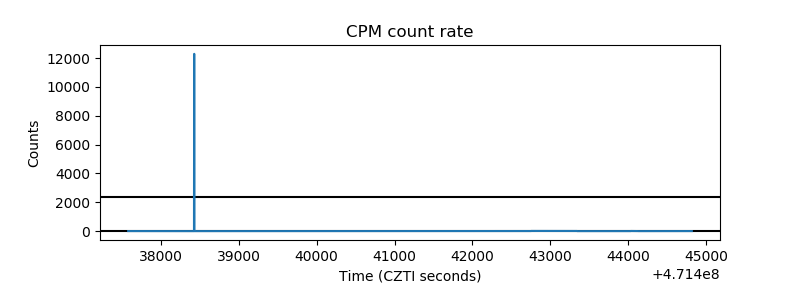 |
| CZT Counter | 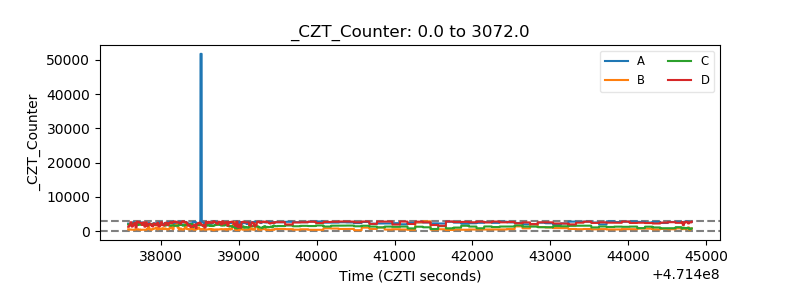 |
| +2.5 Volts monitor | 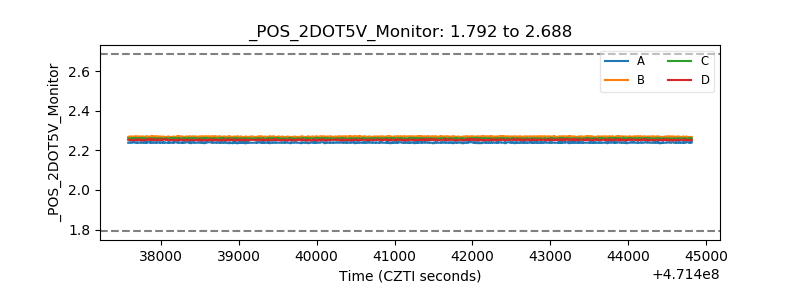 |
| +5 Volts monitor | 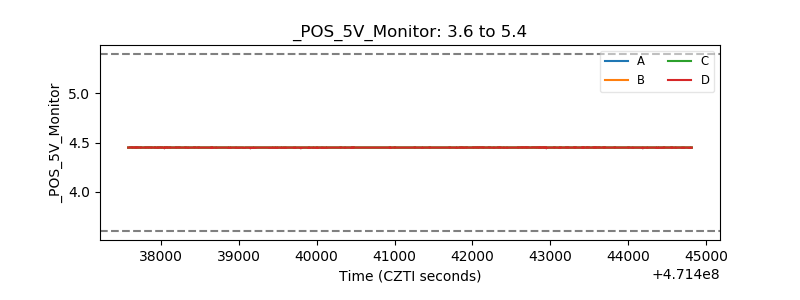 |
| _ROLL_ROT | 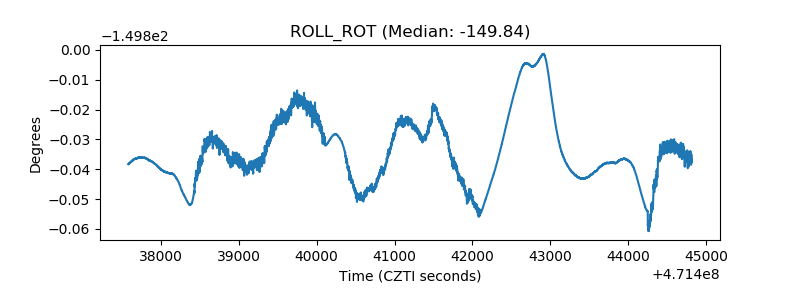 |
| _Roll_DEC | 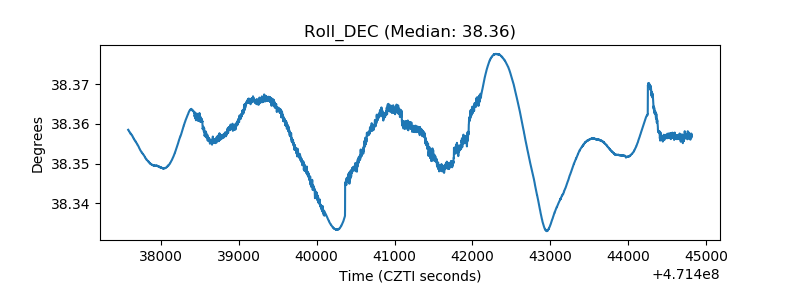 |
| _Roll_RA | 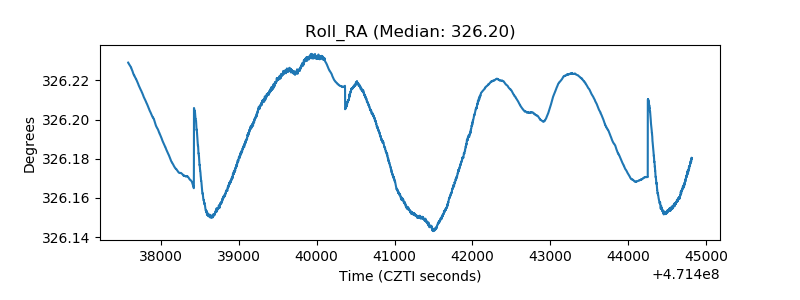 |
| Veto Counter | 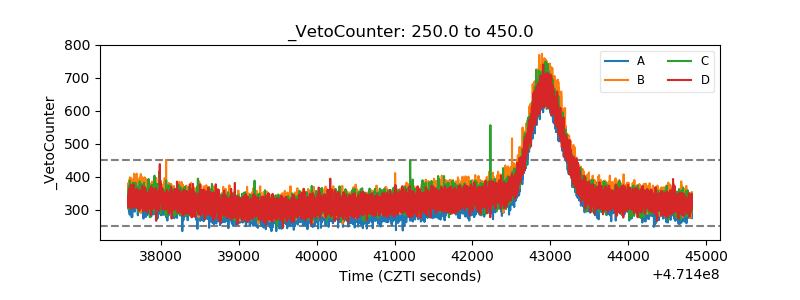 |