| Param | Original file | Final file |
|---|---|---|
| Filename | modeM0/AS1A13_037T01_9000006440_49761cztM0_level2.fits | modeM0/AS1A13_037T01_9000006440_49761cztM0_level2_quad_clean.evt |
| Size (bytes) | 2,994,799,680 | 94,541,760 |
| Size | 2.8 GB | 90.2 MB |
| Events in quadrant A | 42,331,370 | 38,150 |
| Events in quadrant B | 11,758,950 | 1,641,826 |
| Events in quadrant C | 16,475,414 | 1,677 |
| Events in quadrant D | 38,984,484 | 14,359 |
| Mode M9 | |||
|---|---|---|---|
| Quadrant | BADHDUFLAG | Total packets | Discarded packets |
| A | 0 | 4 | 0 |
| B | 0 | 4 | 0 |
| C | 0 | 4 | 0 |
| D | 0 | 4 | 0 |
| Mode SS | |||
|---|---|---|---|
| Quadrant | BADHDUFLAG | Total packets | Discarded packets |
| A | 0 | 340 | 0 |
| B | 0 | 340 | 0 |
| C | 0 | 340 | 0 |
| D | 0 | 340 | 0 |
| Mode M0 | |||
|---|---|---|---|
| Quadrant | BADHDUFLAG | Total packets | Discarded packets |
| A | 0 | 137267 | 1 |
| B | 0 | 46497 | 1 |
| C | 0 | 61048 | 8 |
| D | 0 | 127331 | 1 |
| Quadrant | Total seconds | Saturated seconds | Saturation percentage |
|---|---|---|---|
| A | 16902 | 16639 | 98.443971% |
| B | 16902 | 574 | 3.396048% |
| C | 16900 | 16890 | 99.940828% |
| D | 16902 | 16779 | 99.272275% |
Noise dominated data is calculated using 1-second bins in cleaned event files. If a bin has >2000 counts, and if more than 50% of those come from <1% of pixels, then it is considered to be noise-dominated and hence unusable.
| Quadrant | # 1 sec bins | Bins with >0 counts | Bins with >2000 counts | High rate bins dominated by noise | Noise dominated (total time) | Noise dominated (detector-on time) | Marked lightcurve |
|---|---|---|---|---|---|---|---|
| A | 17311 | 16901 | 16290 | 16290 | 94.10% | 96.38% | 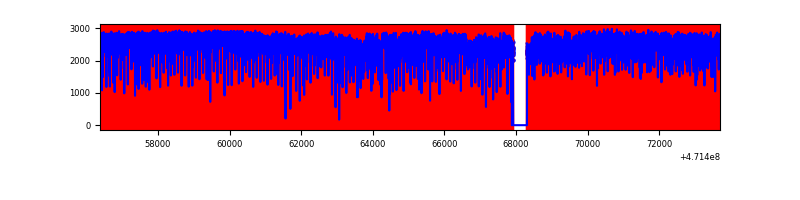 |
| B | 17312 | 16904 | 418 | 418 | 2.41% | 2.47% | 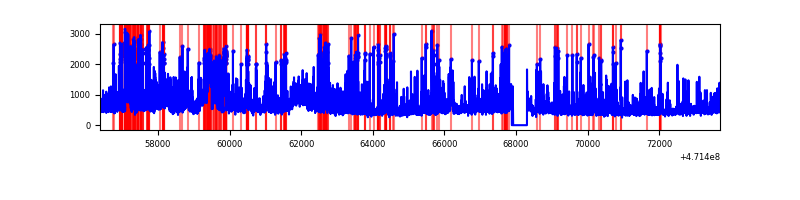 |
| C | 17311 | 16899 | 1012 | 1012 | 5.85% | 5.99% | 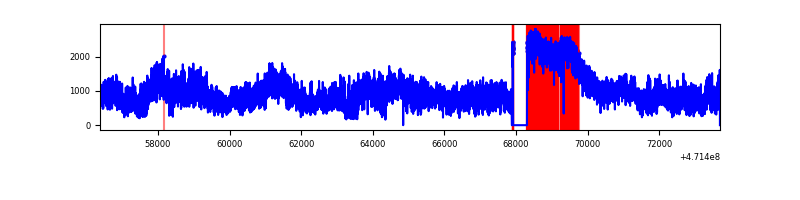 |
| D | 17312 | 16901 | 13833 | 13833 | 79.90% | 81.85% | 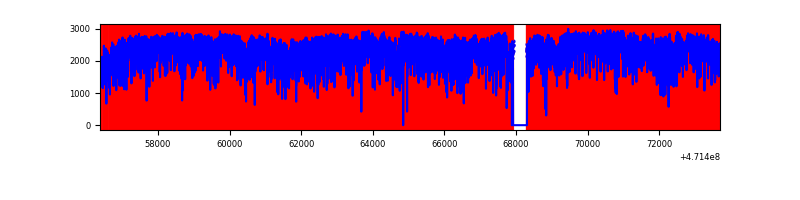 |
Top three noisy pixels from each quadrant. If the there are fewer than three noisy pixels in the level2.evt file, extra rows are filled as -1
| Pixel properties | Quadrant properties | ||||||
|---|---|---|---|---|---|---|---|
| Quadrant | DetID | PixID | Counts | Sigma | Mean | Median | Sigma |
| A | 0 | 99 | 10868724 | 58379.46 | 593 | 572 | 186.2 |
| A | 10 | 83 | 9578498 | 51448.87 | 593 | 572 | 186.2 |
| A | 12 | 50 | 5462499 | 29339.33 | 593 | 572 | 186.2 |
| B | 1 | 207 | 1056583 | 2788.84 | 1767 | 1709 | 378.2 |
| B | 4 | 21 | 696270 | 1836.26 | 1767 | 1709 | 378.2 |
| B | 1 | 255 | 379080 | 997.68 | 1767 | 1709 | 378.2 |
| C | 15 | 190 | 3549179 | 56888.12 | 68 | 60 | 62.4 |
| C | 15 | 180 | 2904060 | 46547.63 | 68 | 60 | 62.4 |
| C | 15 | 163 | 921549 | 14770.36 | 68 | 60 | 62.4 |
| D | 7 | 61 | 6111978 | 28699.77 | 427 | 395 | 212.9 |
| D | 15 | 106 | 3301954 | 15504.0 | 427 | 395 | 212.9 |
| D | 15 | 168 | 3226768 | 15150.93 | 427 | 395 | 212.9 |
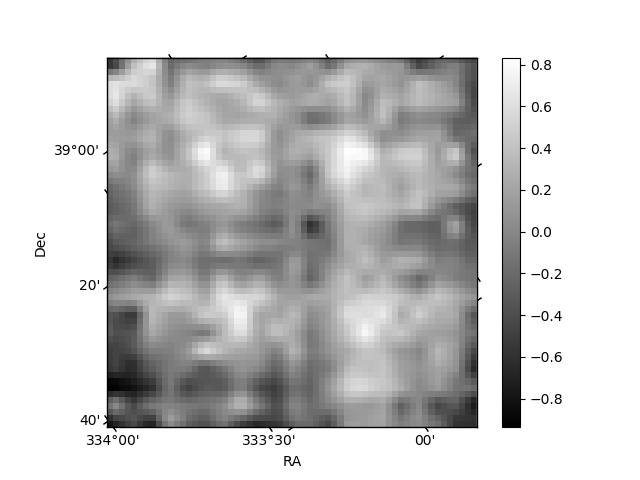
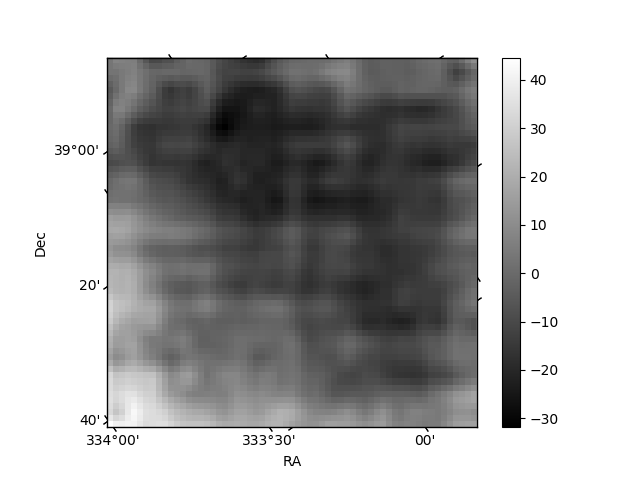
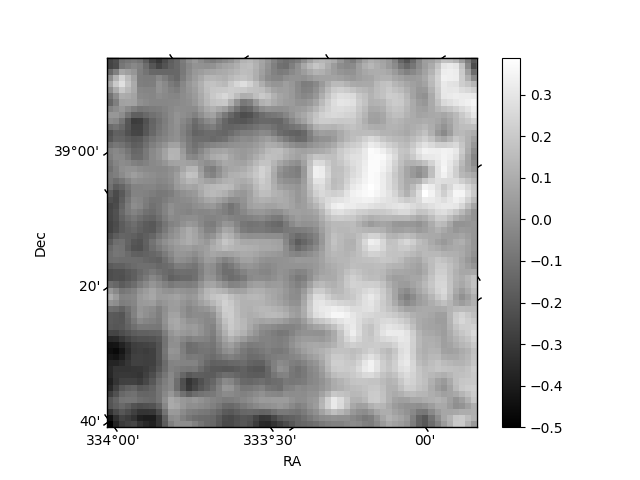
Histogram calculated using DETX and DETY for each event in the final _common_clean file
| Quadrant A | 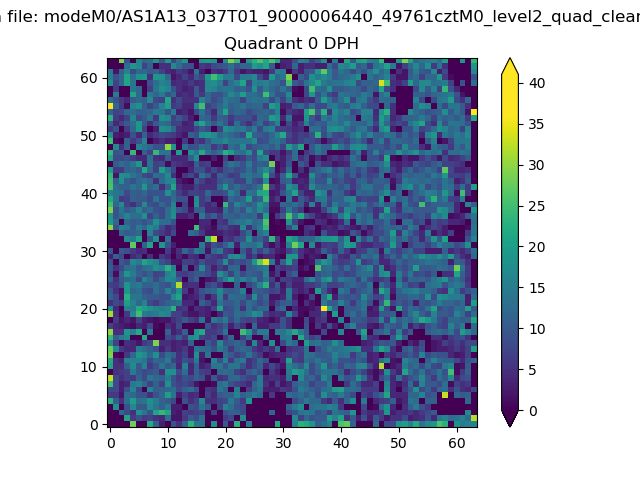 |
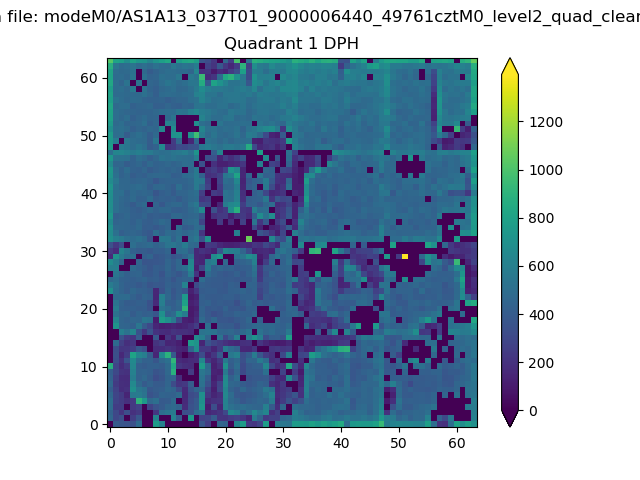 |
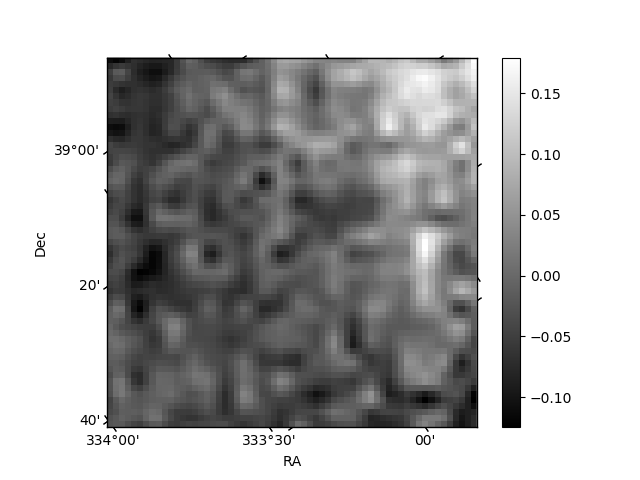
Quadrant B |
|---|---|---|---|
| Quadrant D | 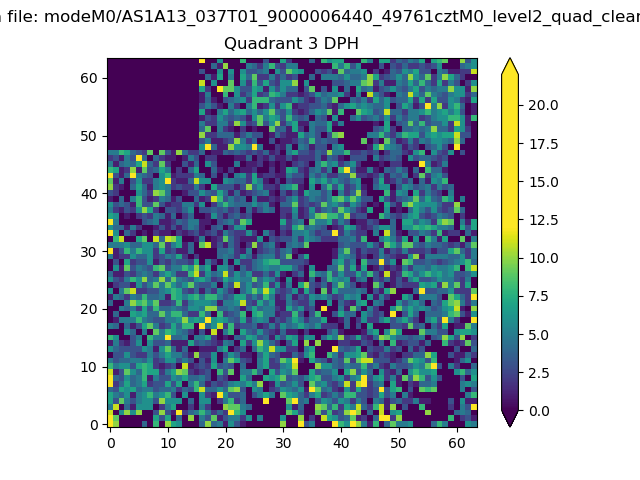 |
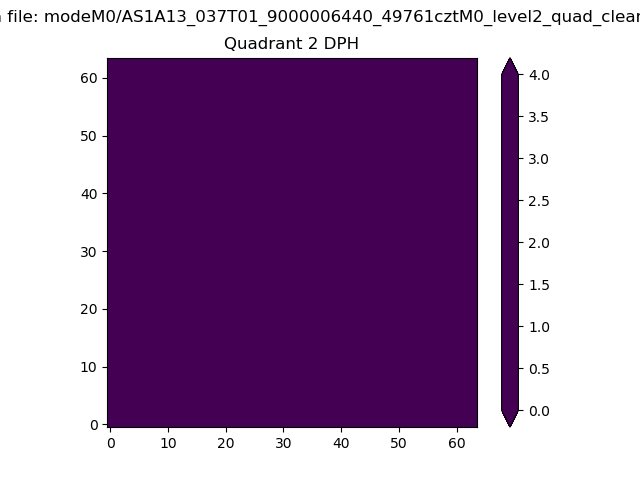 |
Quadrant C |
| Plot type | Count rate plots | Images |
|---|---|---|
| Comparison with Poisson distribution Blue bars denote a histogram of data divided into 1 sec bins. Red curve is a Poisson curve with rate = median count rate of data. |
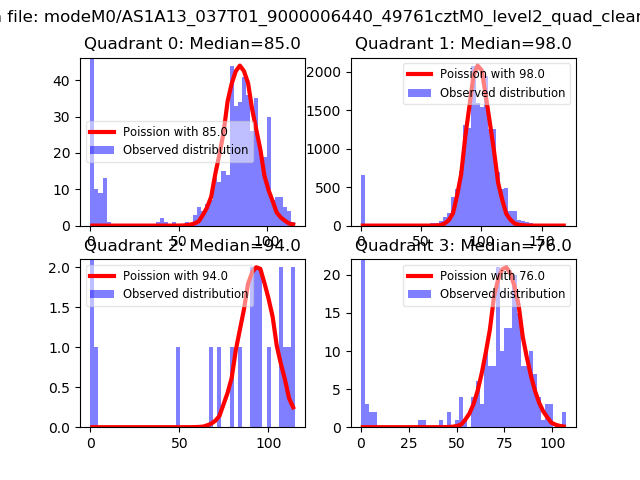 |
 |
| Quadrant-wise count rates Data is divided into 100 sec bins |
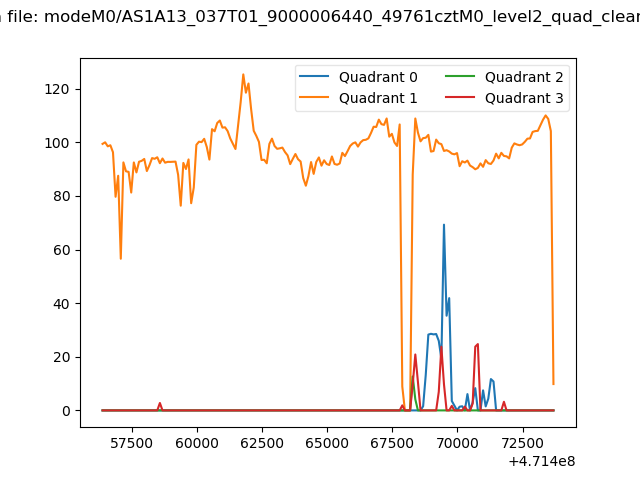 |
|
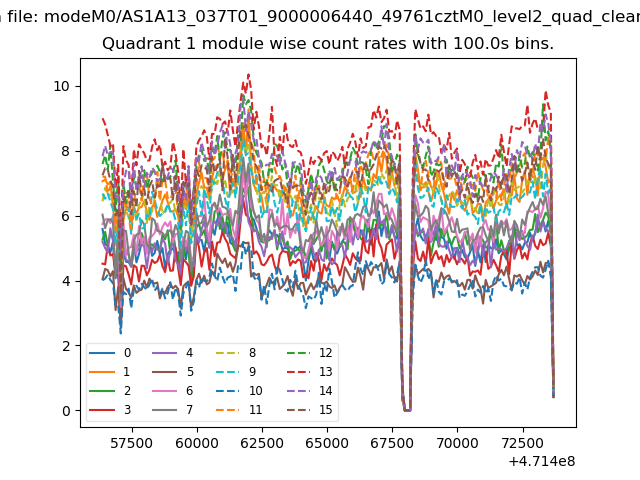
| Module-wise count rates for Quadrant A Data is divided into 100 sec bins |
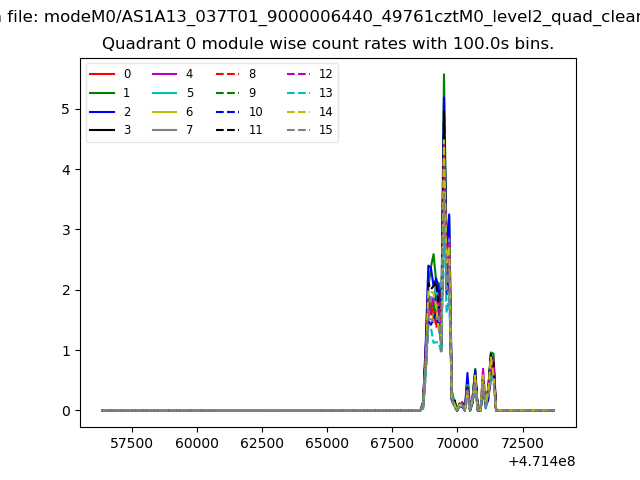 |
 |
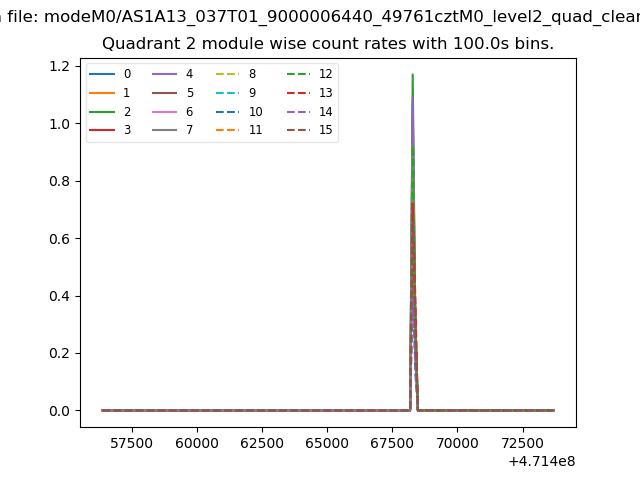
| Module-wise count rates for Quadrant B Data is divided into 100 sec bins |
 |
 |
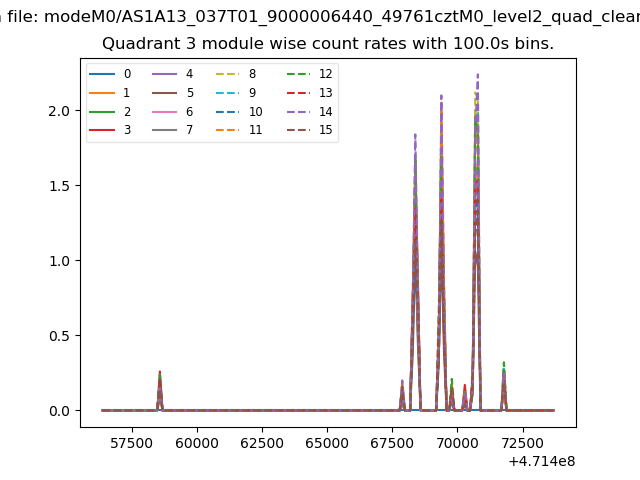
| Module-wise count rates for Quadrant C Data is divided into 100 sec bins |
 |
 |
| Module-wise count rates for Quadrant D Data is divided into 100 sec bins |
 |
 |
| Parameter | Plot |
|---|---|
| CZT HV Monitor | 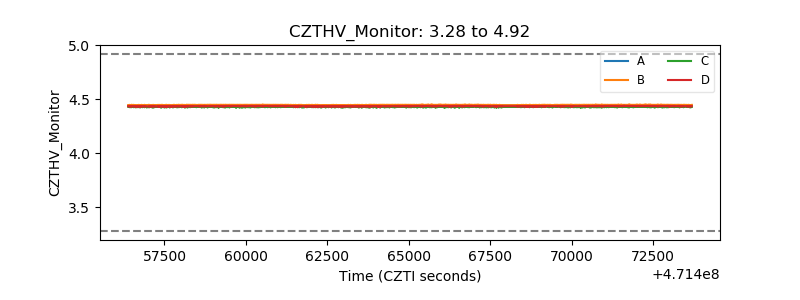 |
| D_VDD | 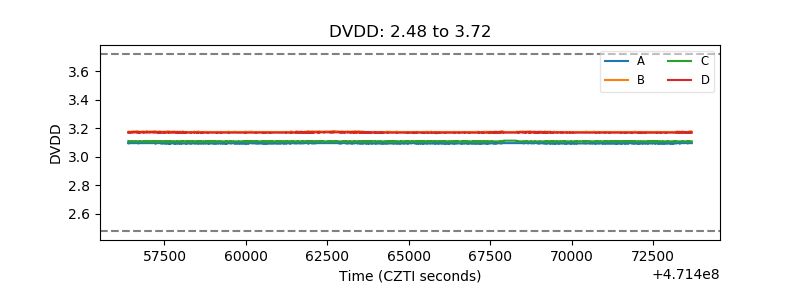 |
| Temperature 1 | 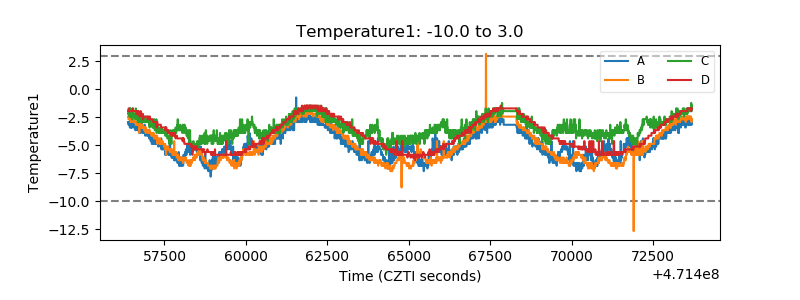 |
| Veto HV Monitor | 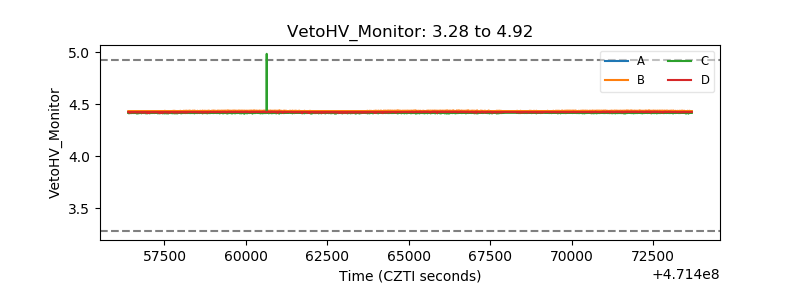 |
| Veto LLD | 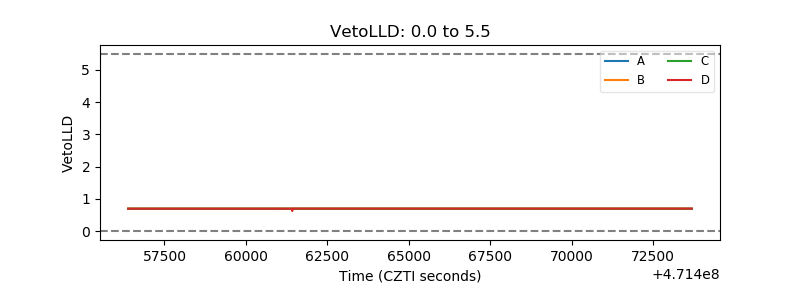 |
| Alpha Counter | 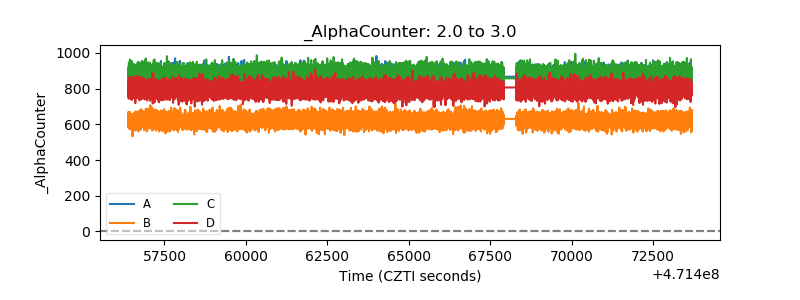 |
| _CPM_Rate | 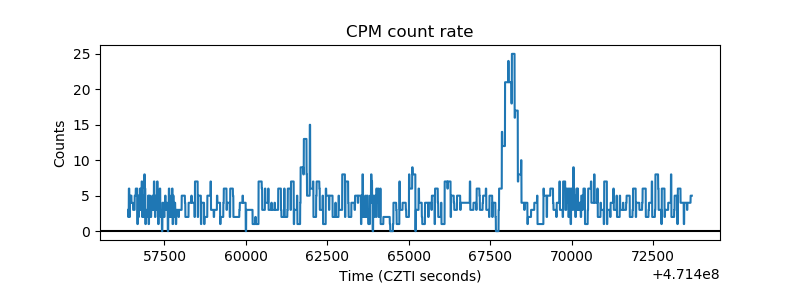 |
| CZT Counter | 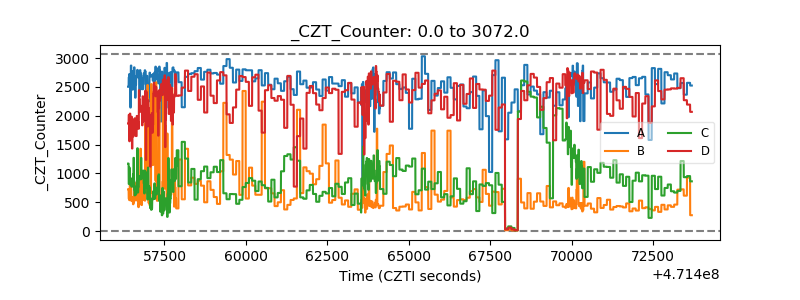 |
| +2.5 Volts monitor | 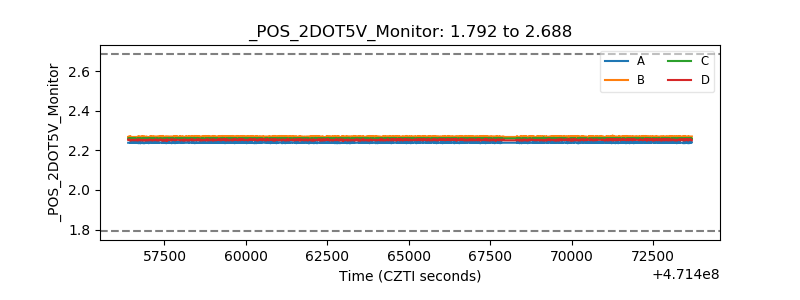 |
| +5 Volts monitor | 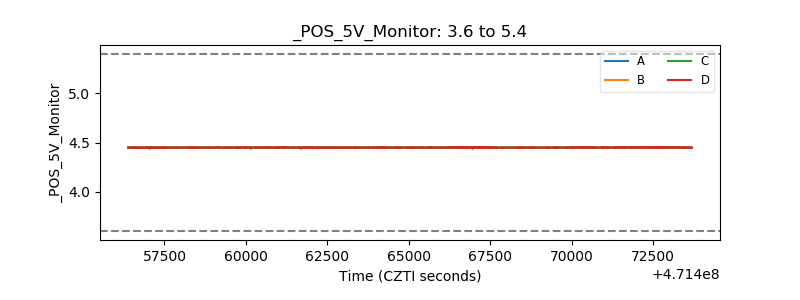 |
| _ROLL_ROT | 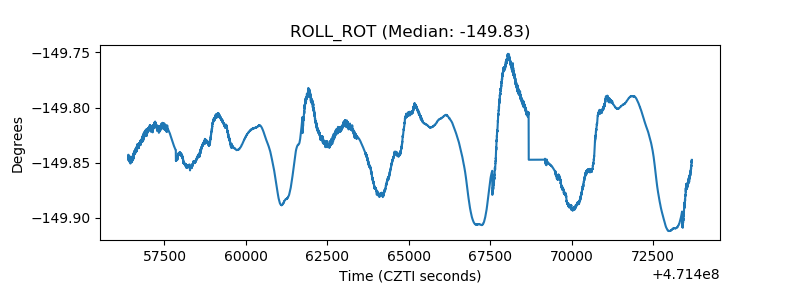 |
| _Roll_DEC | 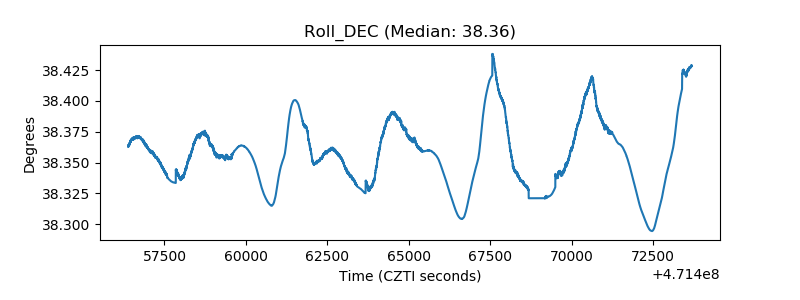 |
| _Roll_RA | 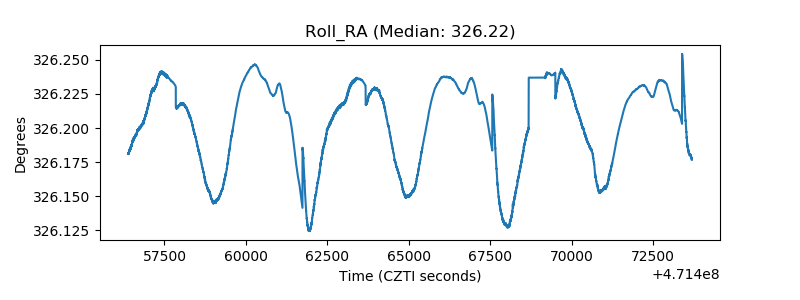 |
| Veto Counter | 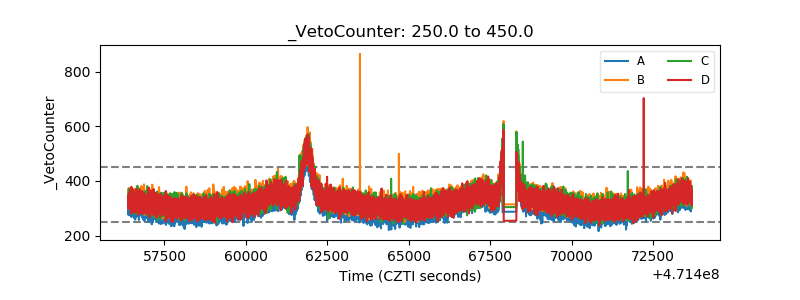 |