| Param | Original file | Final file |
|---|---|---|
| Filename | modeM0/AS1A13_037T01_9000006440_49762cztM0_level2.fits | modeM0/AS1A13_037T01_9000006440_49762cztM0_level2_quad_clean.evt |
| Size (bytes) | 1,473,497,280 | 49,841,280 |
| Size | 1.4 GB | 47.5 MB |
| Events in quadrant A | 18,999,457 | 85,343 |
| Events in quadrant B | 5,037,980 | 775,361 |
| Events in quadrant C | 11,519,597 | 1,118 |
| Events in quadrant D | 18,377,716 | 98,944 |
| Mode M9 | |||
|---|---|---|---|
| Quadrant | BADHDUFLAG | Total packets | Discarded packets |
| A | 0 | 14 | 0 |
| B | 0 | 14 | 0 |
| C | 0 | 14 | 0 |
| D | 0 | 14 | 0 |
| Mode SS | |||
|---|---|---|---|
| Quadrant | BADHDUFLAG | Total packets | Discarded packets |
| A | 0 | 162 | 0 |
| B | 0 | 162 | 0 |
| C | 0 | 162 | 0 |
| D | 0 | 162 | 0 |
| Mode M0 | |||
|---|---|---|---|
| Quadrant | BADHDUFLAG | Total packets | Discarded packets |
| A | 0 | 61725 | 2 |
| B | 0 | 20296 | 2 |
| C | 0 | 39709 | 2 |
| D | 0 | 59964 | 2 |
| Quadrant | Total seconds | Saturated seconds | Saturation percentage |
|---|---|---|---|
| A | 7878 | 7222 | 91.673013% |
| B | 7879 | 305 | 3.871050% |
| C | 7879 | 7872 | 99.911156% |
| D | 7879 | 6951 | 88.221856% |
Noise dominated data is calculated using 1-second bins in cleaned event files. If a bin has >2000 counts, and if more than 50% of those come from <1% of pixels, then it is considered to be noise-dominated and hence unusable.
| Quadrant | # 1 sec bins | Bins with >0 counts | Bins with >2000 counts | High rate bins dominated by noise | Noise dominated (total time) | Noise dominated (detector-on time) | Marked lightcurve |
|---|---|---|---|---|---|---|---|
| A | 9308 | 7878 | 7442 | 7442 | 79.95% | 94.47% | 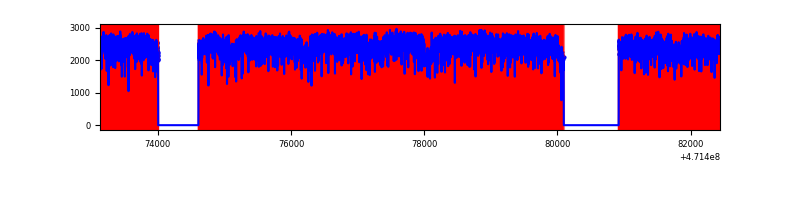 |
| B | 9309 | 7879 | 215 | 215 | 2.31% | 2.73% | 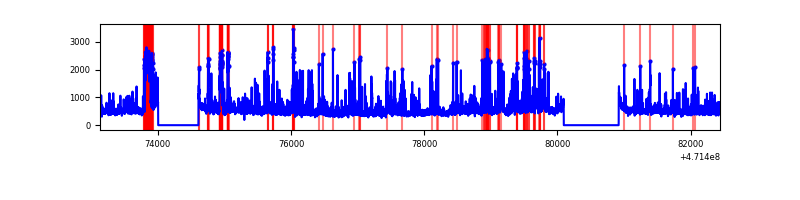 |
| C | 9308 | 7878 | 2388 | 2388 | 25.66% | 30.31% | 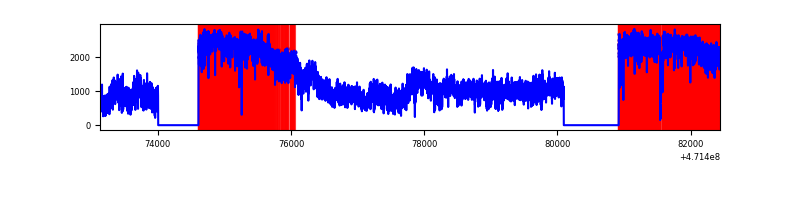 |
| D | 9308 | 7878 | 6638 | 6638 | 71.31% | 84.26% | 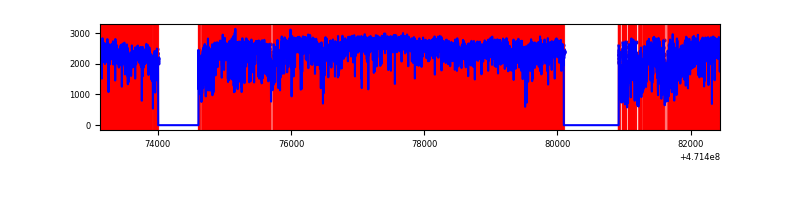 |
Top three noisy pixels from each quadrant. If the there are fewer than three noisy pixels in the level2.evt file, extra rows are filled as -1
| Pixel properties | Quadrant properties | ||||||
|---|---|---|---|---|---|---|---|
| Quadrant | DetID | PixID | Counts | Sigma | Mean | Median | Sigma |
| A | 10 | 83 | 8547668 | 54550.49 | 564 | 545 | 156.7 |
| A | 12 | 50 | 3341627 | 21323.86 | 564 | 545 | 156.7 |
| A | 7 | 64 | 876588 | 5591.19 | 564 | 545 | 156.7 |
| B | 10 | 28 | 465574 | 2618.45 | 839 | 813 | 177.5 |
| B | 5 | 185 | 176437 | 989.46 | 839 | 813 | 177.5 |
| B | 4 | 171 | 165845 | 929.78 | 839 | 813 | 177.5 |
| C | 15 | 190 | 2033135 | 48219.1 | 103 | 100 | 42.2 |
| C | 15 | 180 | 2019749 | 47901.61 | 103 | 100 | 42.2 |
| C | 1 | 44 | 1255462 | 29774.41 | 103 | 100 | 42.2 |
| D | 15 | 40 | 2884888 | 21330.84 | 410 | 394 | 135.2 |
| D | 15 | 168 | 2316357 | 17126.55 | 410 | 394 | 135.2 |
| D | 7 | 61 | 2290950 | 16938.67 | 410 | 394 | 135.2 |
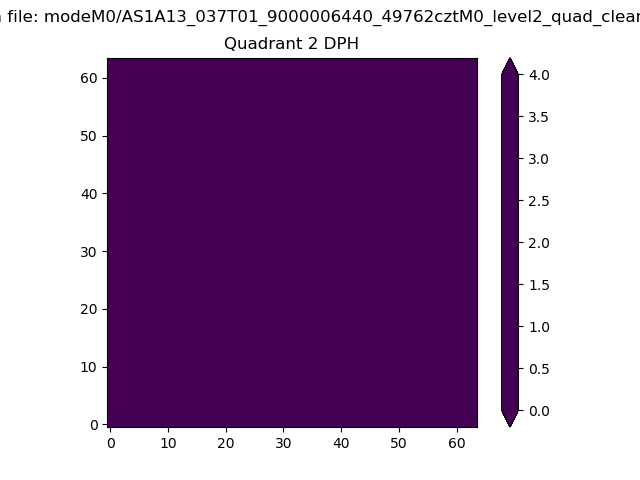
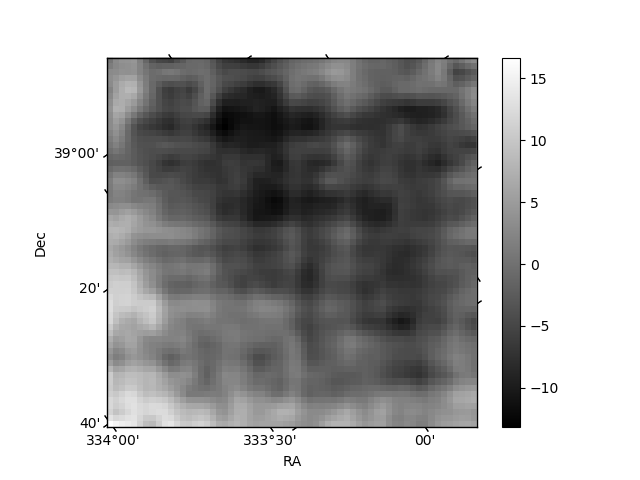
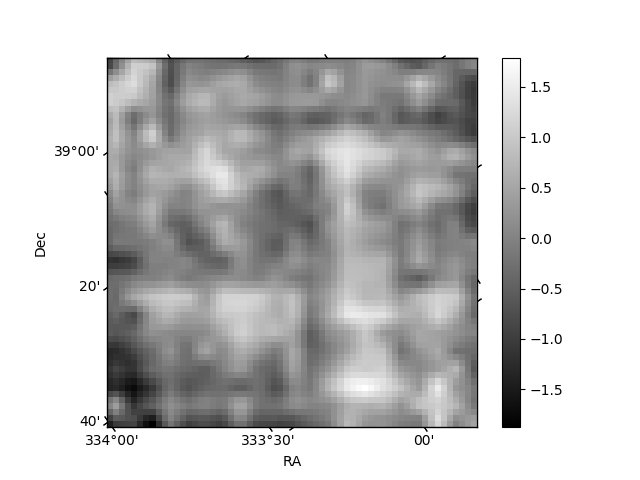
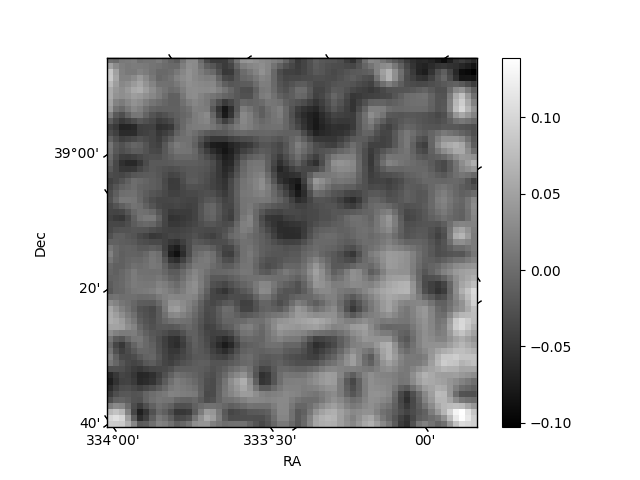
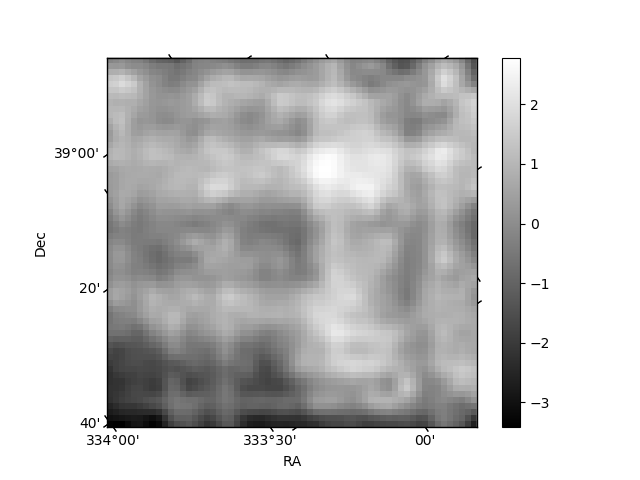
Histogram calculated using DETX and DETY for each event in the final _common_clean file
| Quadrant A | 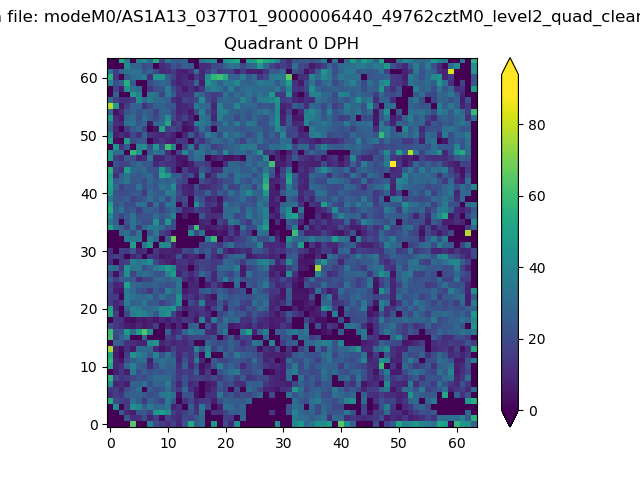 |
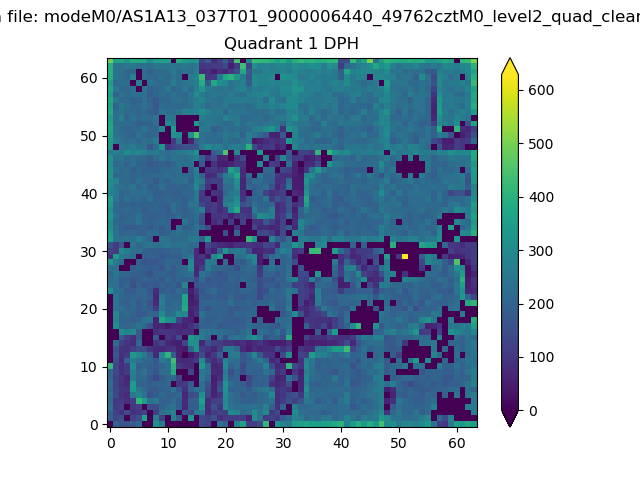 |
Quadrant B |
|---|---|---|---|
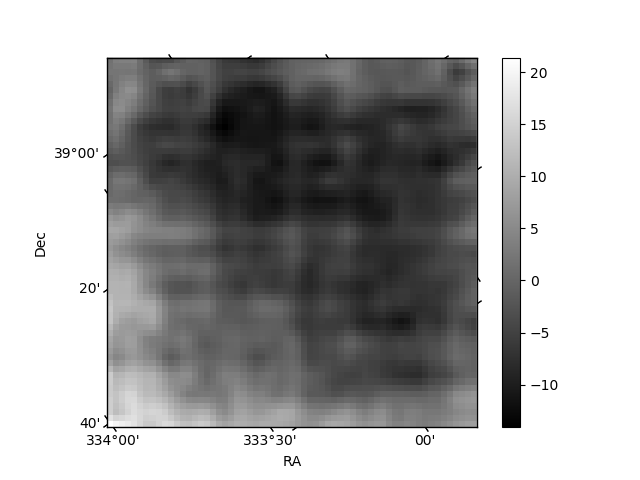
| Quadrant D | 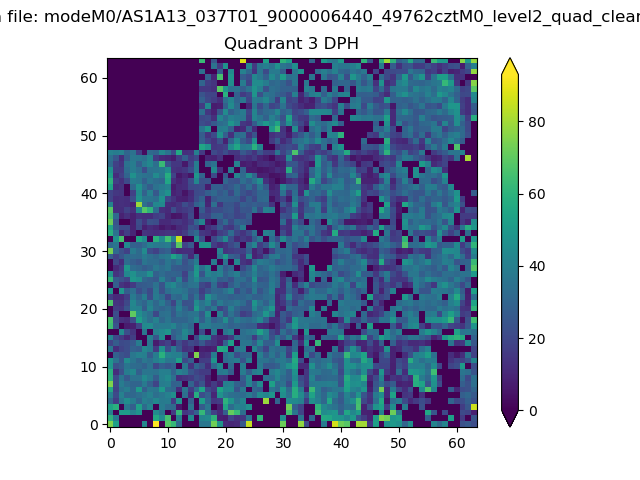 |
 |
Quadrant C |
| Plot type | Count rate plots | Images |
|---|---|---|
| Comparison with Poisson distribution Blue bars denote a histogram of data divided into 1 sec bins. Red curve is a Poisson curve with rate = median count rate of data. |
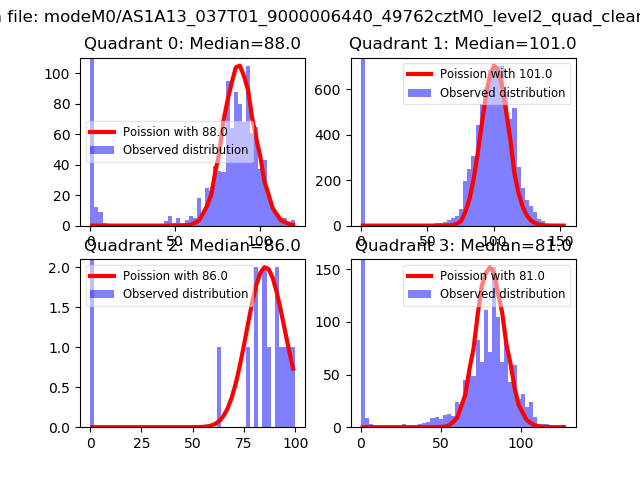 |
 |
| Quadrant-wise count rates Data is divided into 100 sec bins |
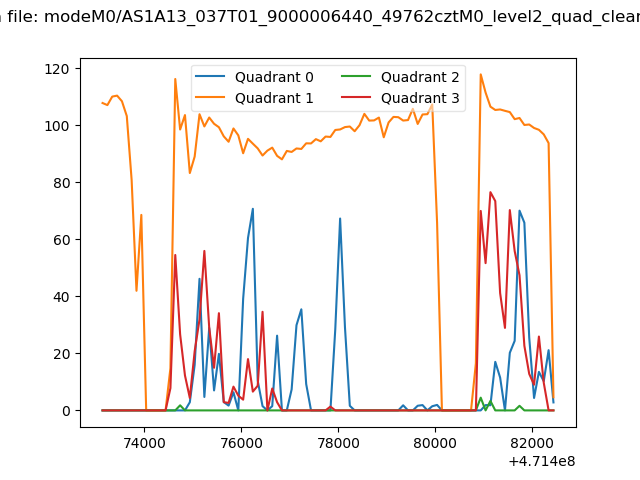 |
|
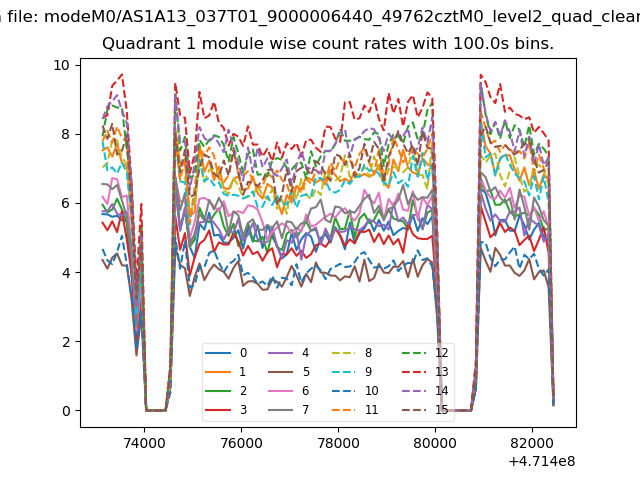
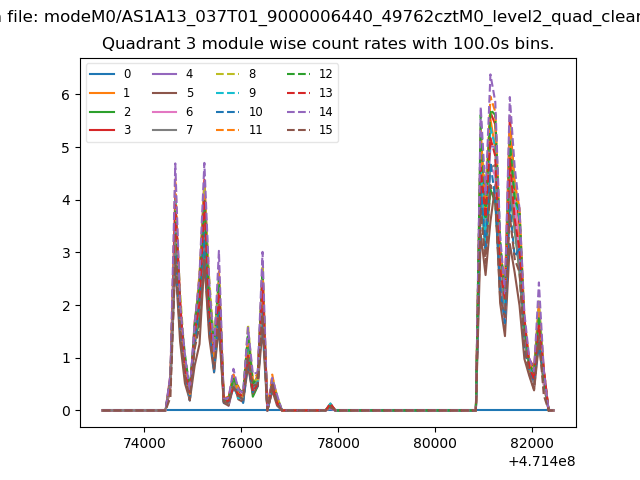
| Module-wise count rates for Quadrant A Data is divided into 100 sec bins |
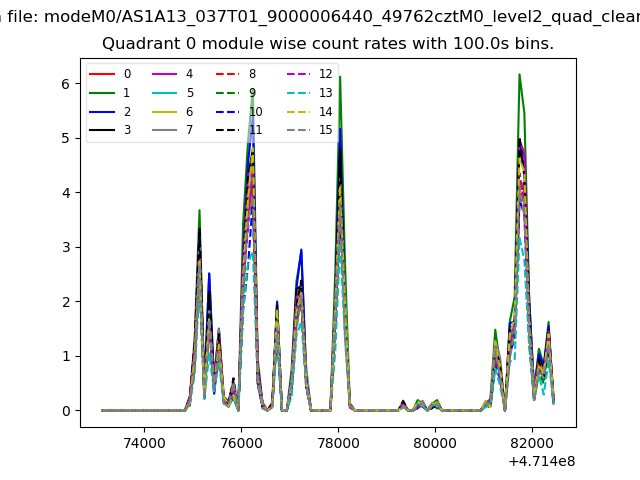 |
 |
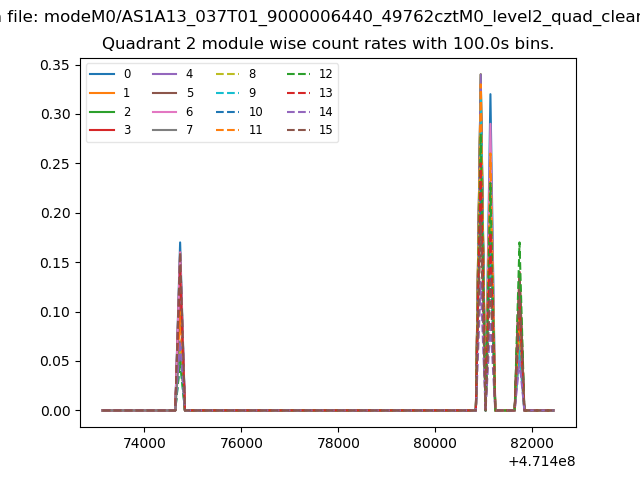
| Module-wise count rates for Quadrant B Data is divided into 100 sec bins |
 |
 |
| Module-wise count rates for Quadrant C Data is divided into 100 sec bins |
 |
 |
| Module-wise count rates for Quadrant D Data is divided into 100 sec bins |
 |
 |
| Parameter | Plot |
|---|---|
| CZT HV Monitor | 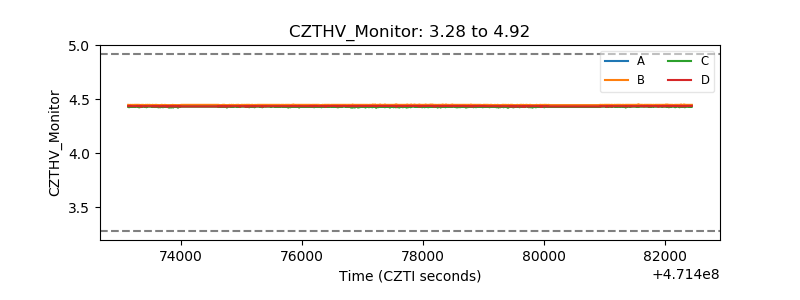 |
| D_VDD | 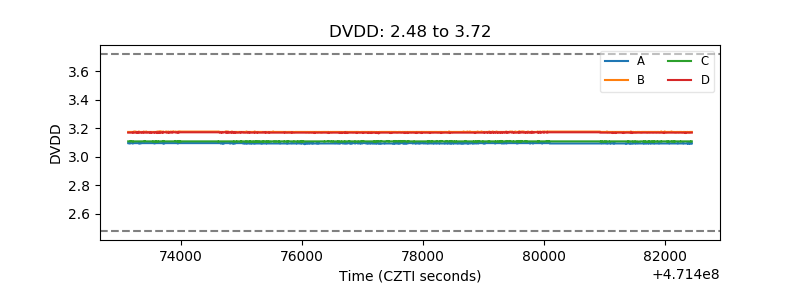 |
| Temperature 1 | 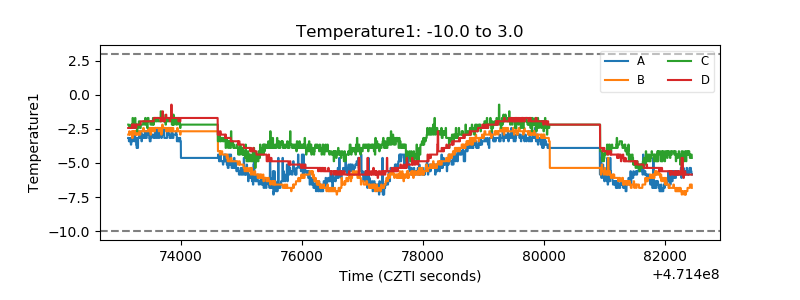 |
| Veto HV Monitor | 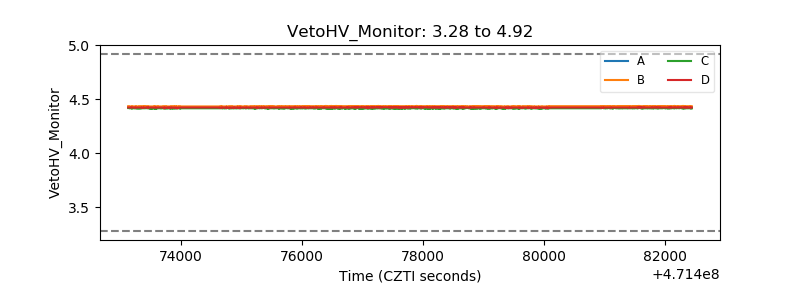 |
| Veto LLD | 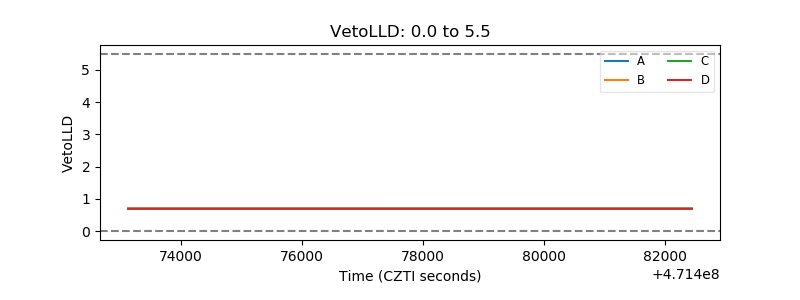 |
| Alpha Counter | 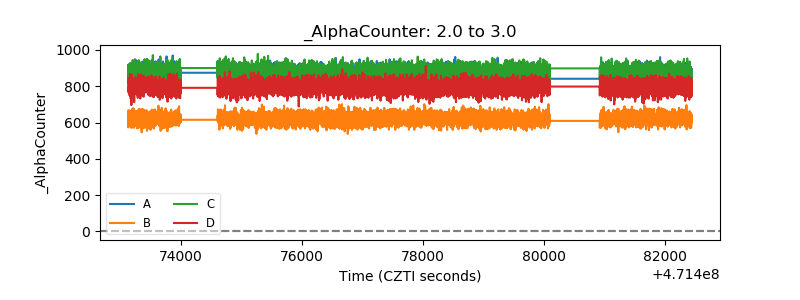 |
| _CPM_Rate | 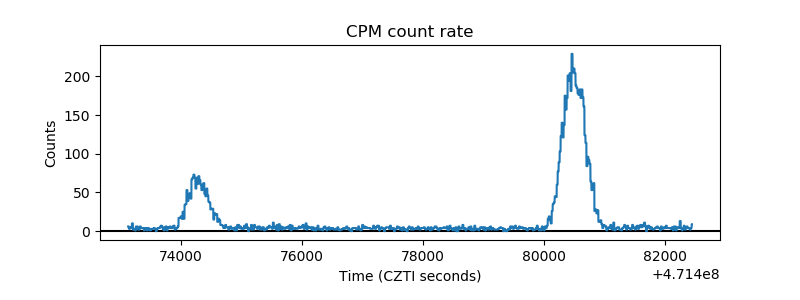 |
| CZT Counter | 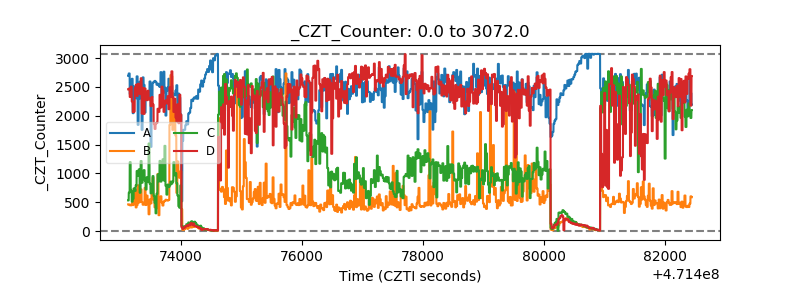 |
| +2.5 Volts monitor | 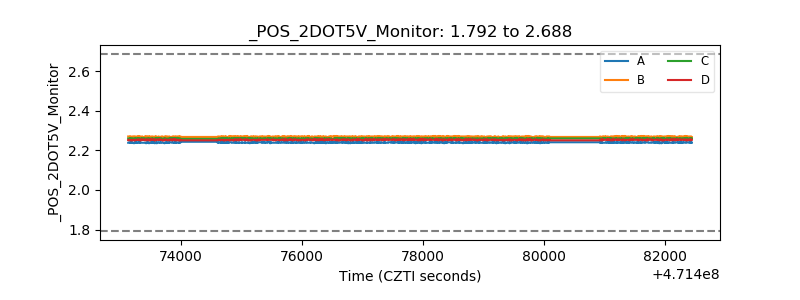 |
| +5 Volts monitor | 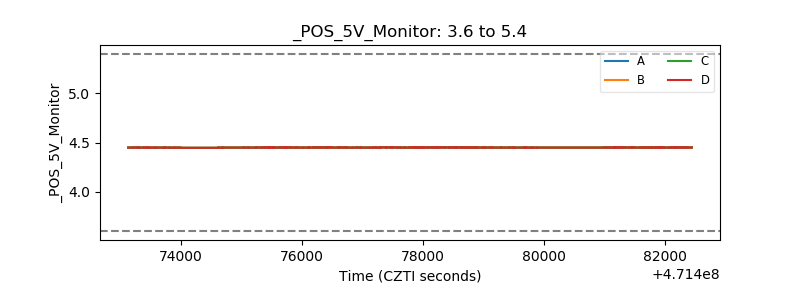 |
| _ROLL_ROT | 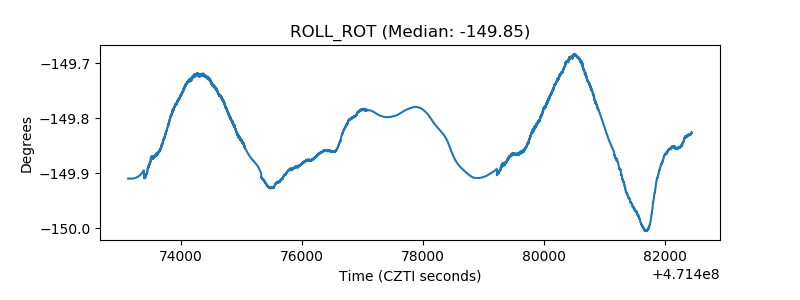 |
| _Roll_DEC | 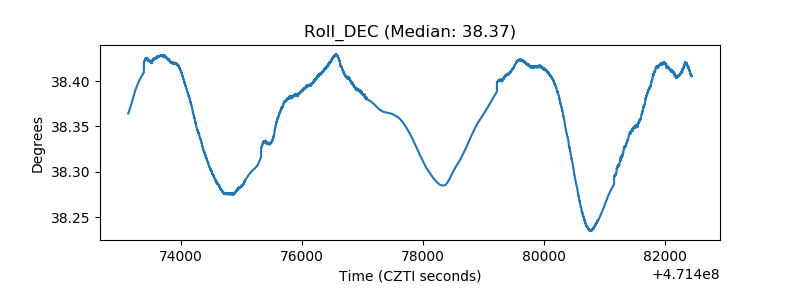 |
| _Roll_RA | 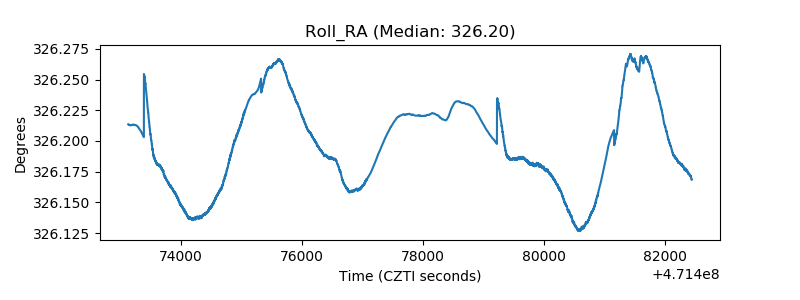 |
| Veto Counter | 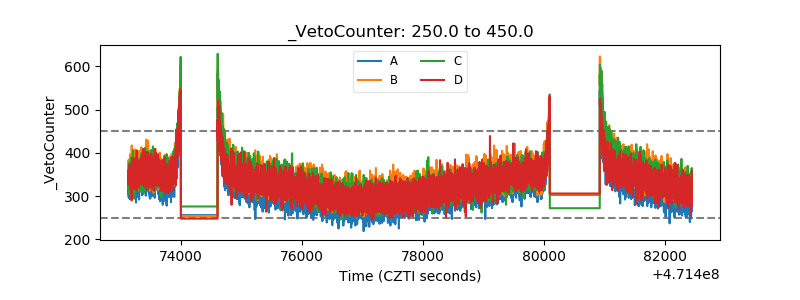 |