| Param | Original file | Final file |
|---|---|---|
| Filename | modeM0/AS1A13_037T01_9000006440_49763cztM0_level2.fits | modeM0/AS1A13_037T01_9000006440_49763cztM0_level2_quad_clean.evt |
| Size (bytes) | 1,180,189,440 | 40,590,720 |
| Size | 1.1 GB | 38.7 MB |
| Events in quadrant A | 15,317,964 | 80,623 |
| Events in quadrant B | 3,605,876 | 641,005 |
| Events in quadrant C | 9,557,906 | 11,368 |
| Events in quadrant D | 14,712,540 | 51,676 |
| Mode M9 | |||
|---|---|---|---|
| Quadrant | BADHDUFLAG | Total packets | Discarded packets |
| A | 0 | 10 | 0 |
| B | 0 | 10 | 0 |
| C | 0 | 10 | 0 |
| D | 0 | 10 | 0 |
| Mode SS | |||
|---|---|---|---|
| Quadrant | BADHDUFLAG | Total packets | Discarded packets |
| A | 0 | 130 | 0 |
| B | 0 | 130 | 0 |
| C | 0 | 130 | 0 |
| D | 0 | 130 | 0 |
| Mode M0 | |||
|---|---|---|---|
| Quadrant | BADHDUFLAG | Total packets | Discarded packets |
| A | 0 | 49838 | 1 |
| B | 0 | 14981 | 1 |
| C | 0 | 32884 | 1 |
| D | 0 | 48018 | 1 |
| Quadrant | Total seconds | Saturated seconds | Saturation percentage |
|---|---|---|---|
| A | 6358 | 5743 | 90.327147% |
| B | 6358 | 90 | 1.415539% |
| C | 6359 | 6268 | 98.568957% |
| D | 6358 | 5865 | 92.245989% |
Noise dominated data is calculated using 1-second bins in cleaned event files. If a bin has >2000 counts, and if more than 50% of those come from <1% of pixels, then it is considered to be noise-dominated and hence unusable.
| Quadrant | # 1 sec bins | Bins with >0 counts | Bins with >2000 counts | High rate bins dominated by noise | Noise dominated (total time) | Noise dominated (detector-on time) | Marked lightcurve |
|---|---|---|---|---|---|---|---|
| A | 7362 | 6357 | 5986 | 5986 | 81.31% | 94.16% | 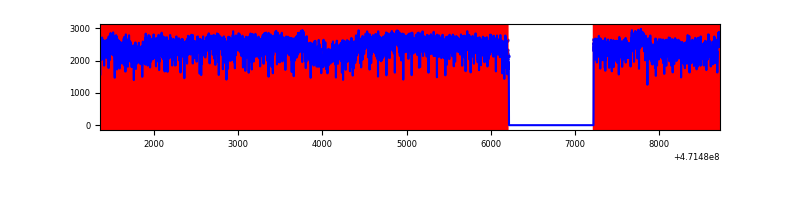 |
| B | 7363 | 6358 | 55 | 55 | 0.75% | 0.87% | 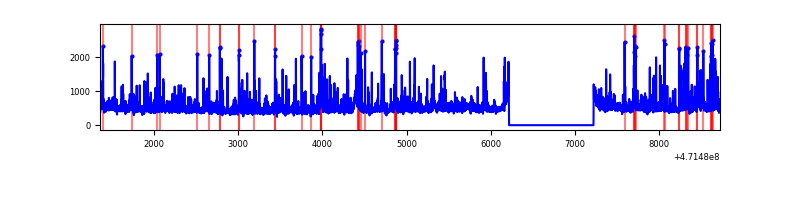 |
| C | 7363 | 6358 | 1937 | 1937 | 26.31% | 30.47% | 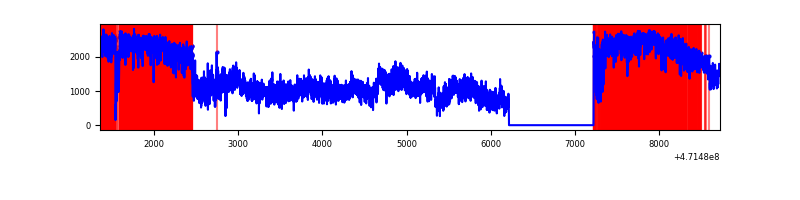 |
| D | 7362 | 6357 | 5256 | 5256 | 71.39% | 82.68% | 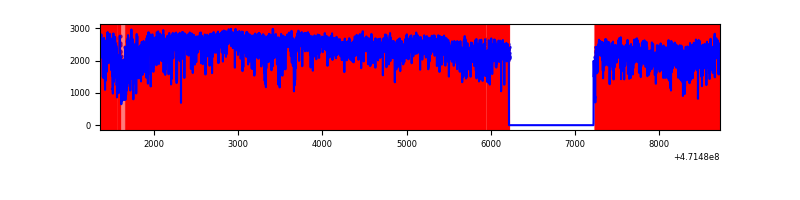 |
Top three noisy pixels from each quadrant. If the there are fewer than three noisy pixels in the level2.evt file, extra rows are filled as -1
| Pixel properties | Quadrant properties | ||||||
|---|---|---|---|---|---|---|---|
| Quadrant | DetID | PixID | Counts | Sigma | Mean | Median | Sigma |
| A | 10 | 83 | 6991375 | 55002.7 | 467 | 453 | 127.1 |
| A | 12 | 50 | 2140588 | 16838.01 | 467 | 453 | 127.1 |
| A | 4 | 205 | 676861 | 5321.8 | 467 | 453 | 127.1 |
| B | 4 | 171 | 274495 | 1934.09 | 670 | 650 | 141.6 |
| B | 4 | 21 | 106621 | 748.44 | 670 | 650 | 141.6 |
| B | 5 | 185 | 104253 | 731.72 | 670 | 650 | 141.6 |
| C | 15 | 180 | 2410220 | 79145.42 | 87 | 86 | 30.5 |
| C | 15 | 190 | 1854934 | 60910.61 | 87 | 86 | 30.5 |
| C | 15 | 235 | 773191 | 25387.68 | 87 | 86 | 30.5 |
| D | 7 | 61 | 2765582 | 30192.86 | 283 | 273 | 91.6 |
| D | 15 | 40 | 1879542 | 20518.69 | 283 | 273 | 91.6 |
| D | 15 | 142 | 1865790 | 20368.54 | 283 | 273 | 91.6 |
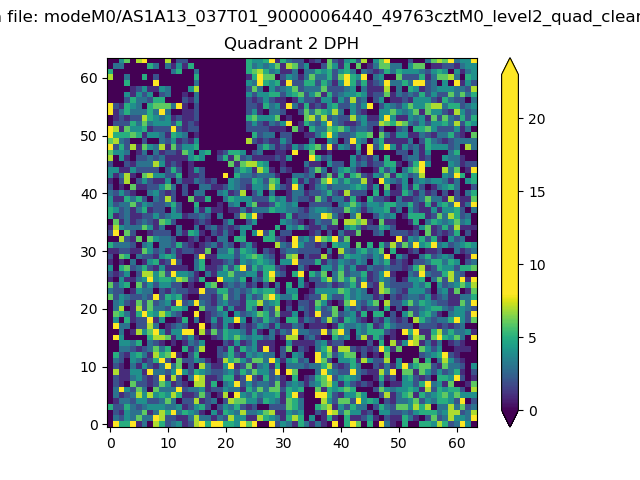
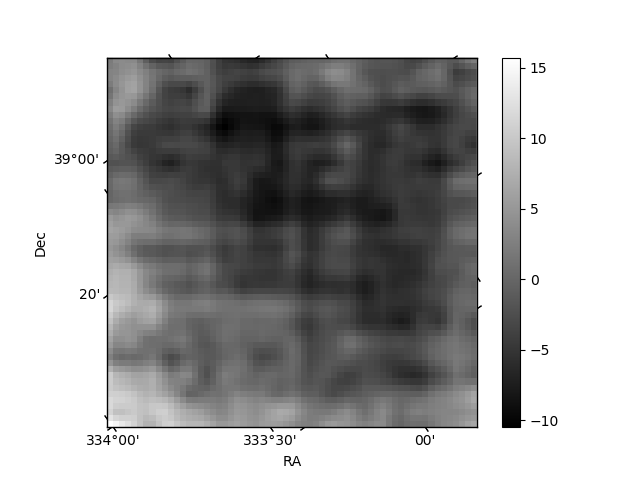
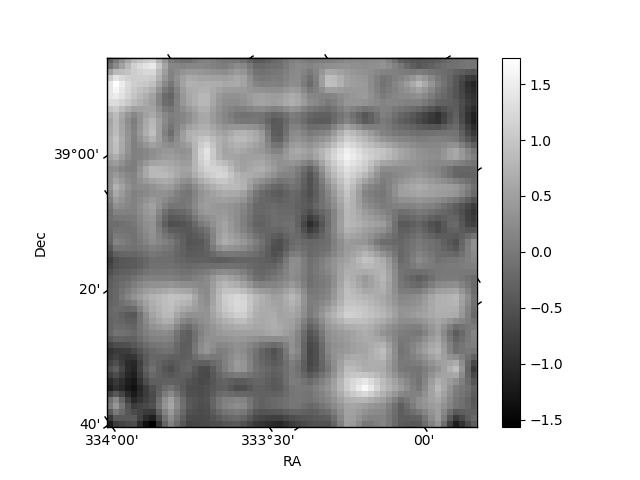
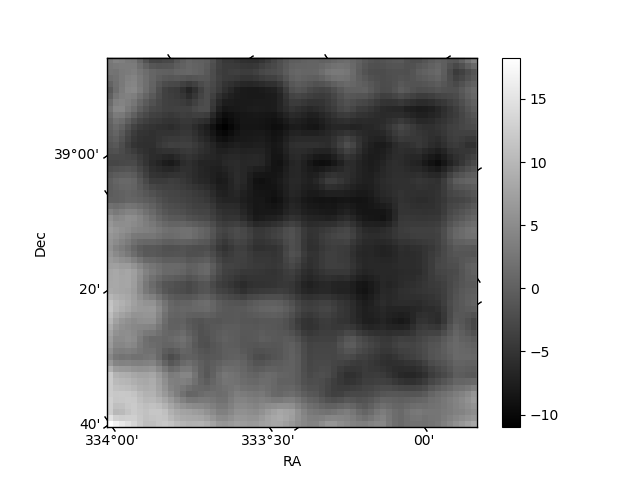
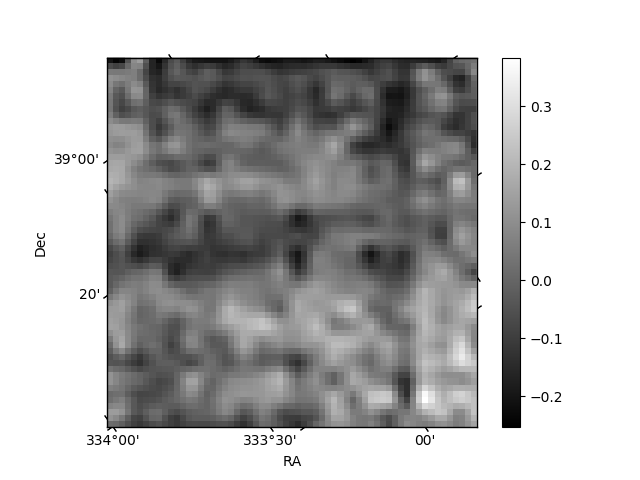
Histogram calculated using DETX and DETY for each event in the final _common_clean file
| Quadrant A | 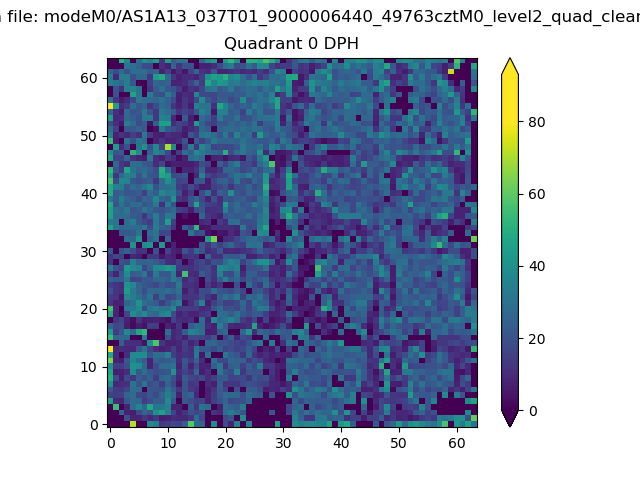 |
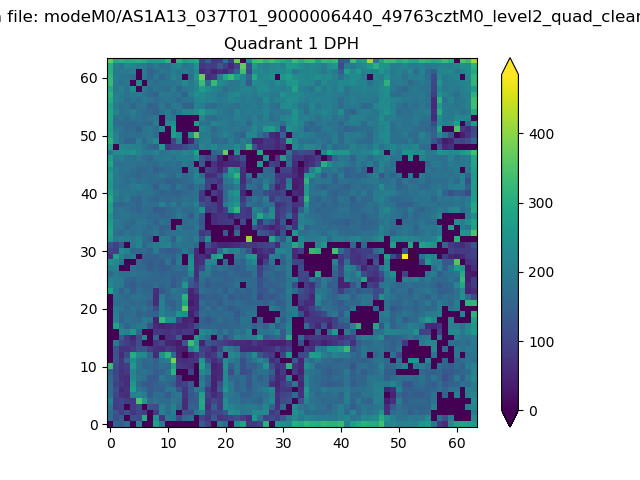 |
Quadrant B |
|---|---|---|---|
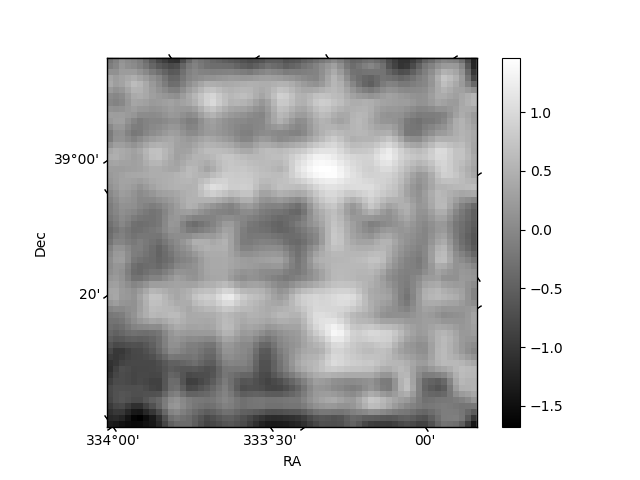
| Quadrant D | 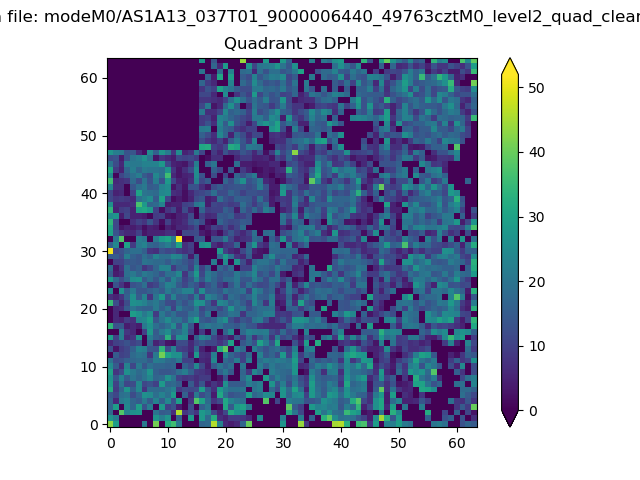 |
 |
Quadrant C |
| Plot type | Count rate plots | Images |
|---|---|---|
| Comparison with Poisson distribution Blue bars denote a histogram of data divided into 1 sec bins. Red curve is a Poisson curve with rate = median count rate of data. |
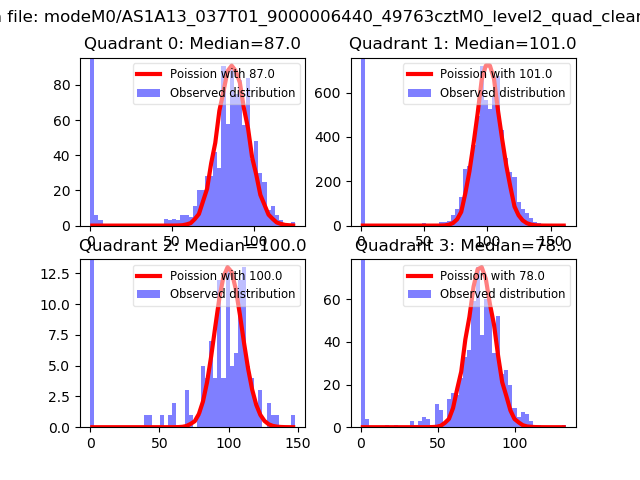 |
 |
| Quadrant-wise count rates Data is divided into 100 sec bins |
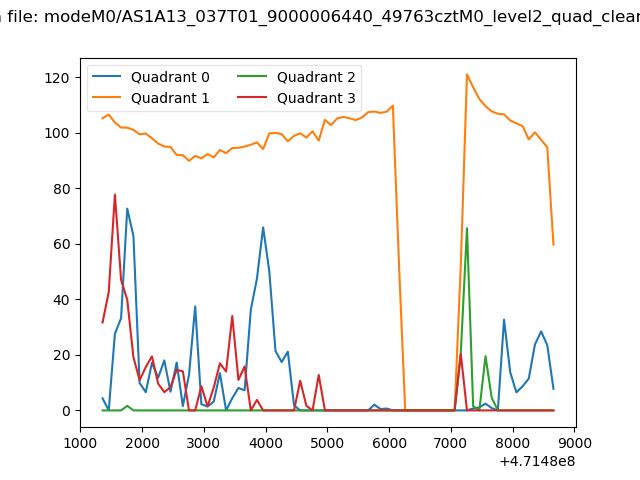 |
|
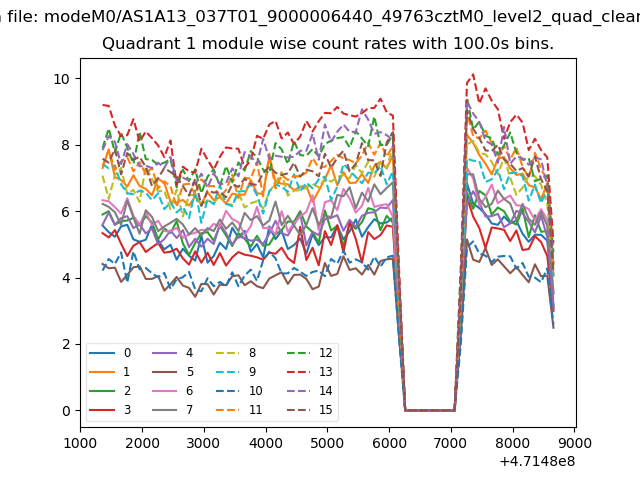
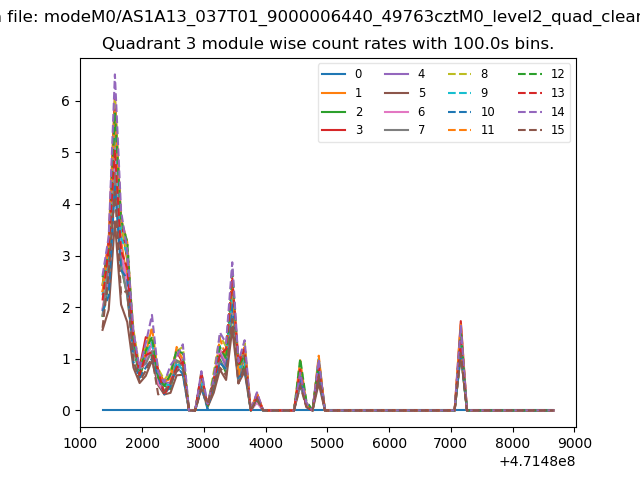
| Module-wise count rates for Quadrant A Data is divided into 100 sec bins |
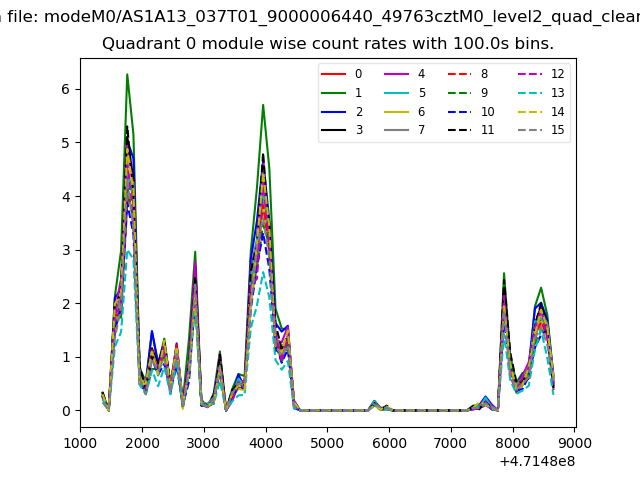 |
 |
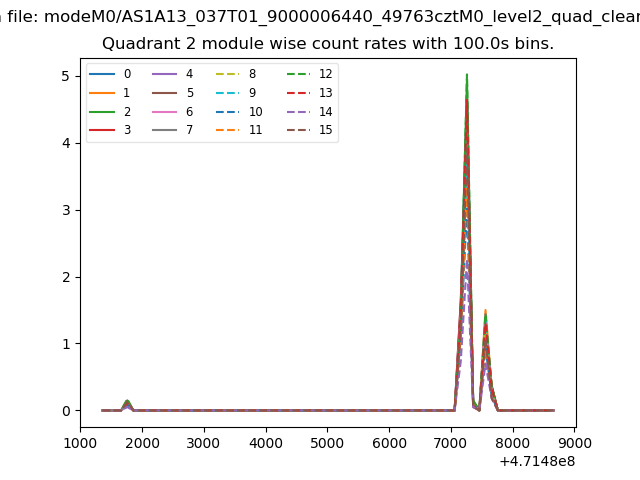
| Module-wise count rates for Quadrant B Data is divided into 100 sec bins |
 |
 |
| Module-wise count rates for Quadrant C Data is divided into 100 sec bins |
 |
 |
| Module-wise count rates for Quadrant D Data is divided into 100 sec bins |
 |
 |
| Parameter | Plot |
|---|---|
| CZT HV Monitor | 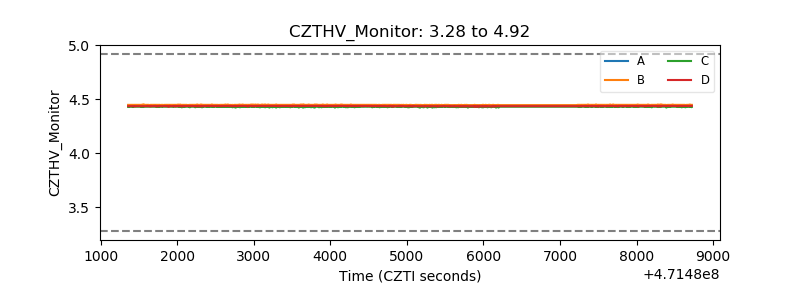 |
| D_VDD | 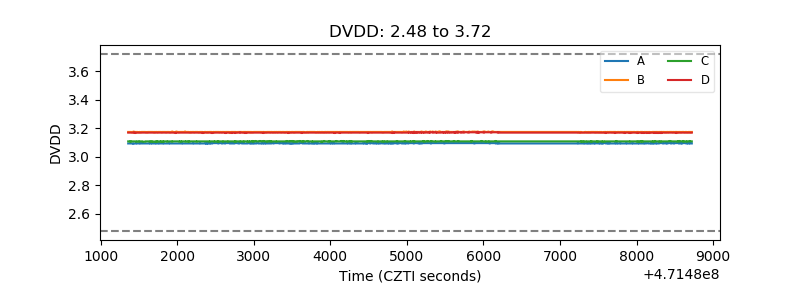 |
| Temperature 1 | 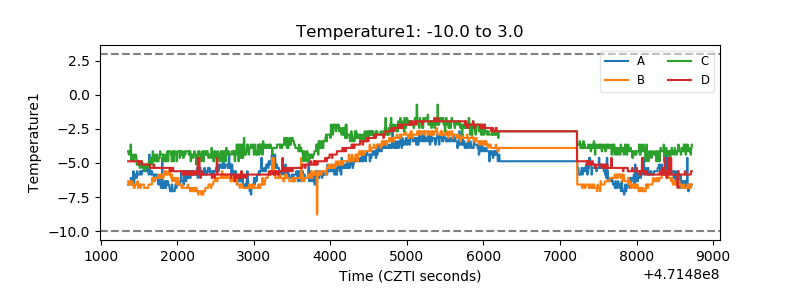 |
| Veto HV Monitor | 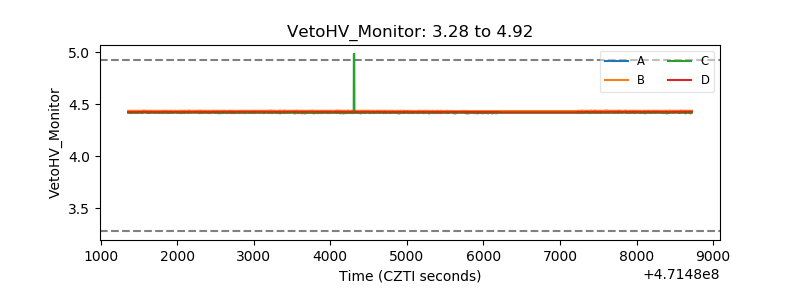 |
| Veto LLD | 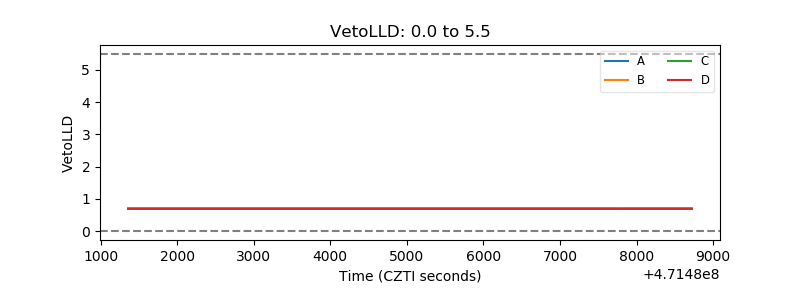 |
| Alpha Counter | 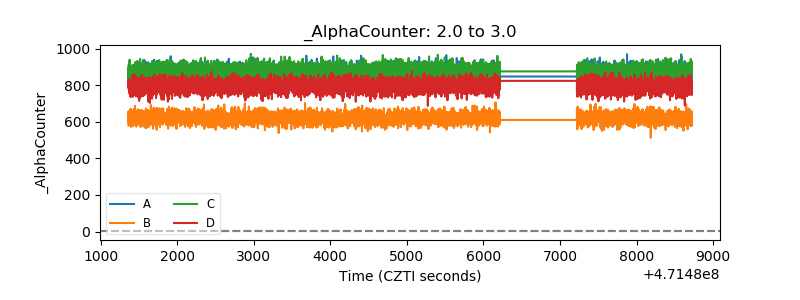 |
| _CPM_Rate | 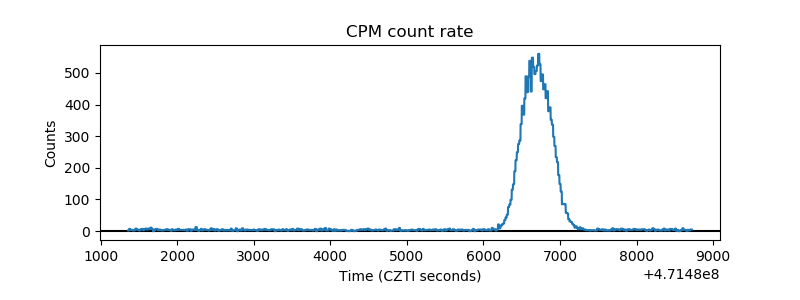 |
| CZT Counter | 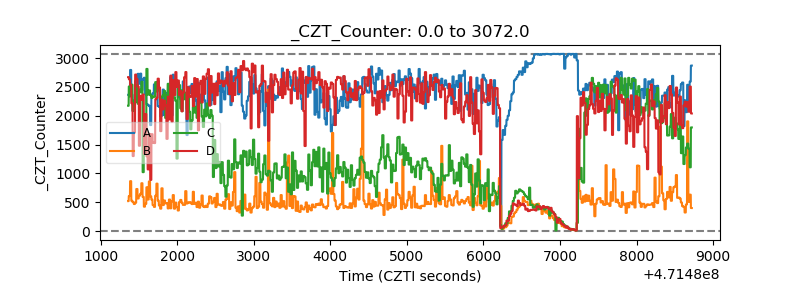 |
| +2.5 Volts monitor | 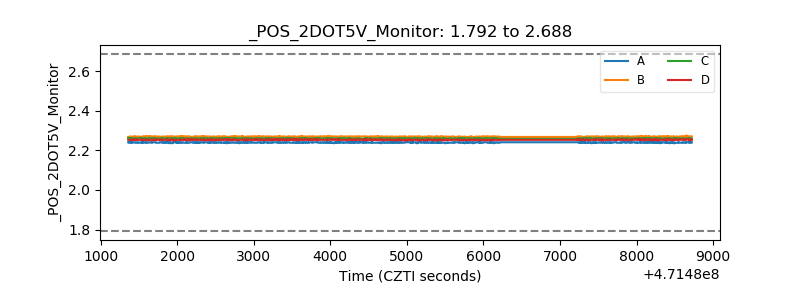 |
| +5 Volts monitor | 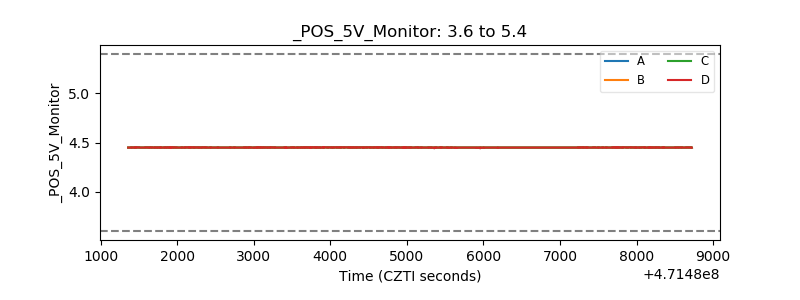 |
| _ROLL_ROT | 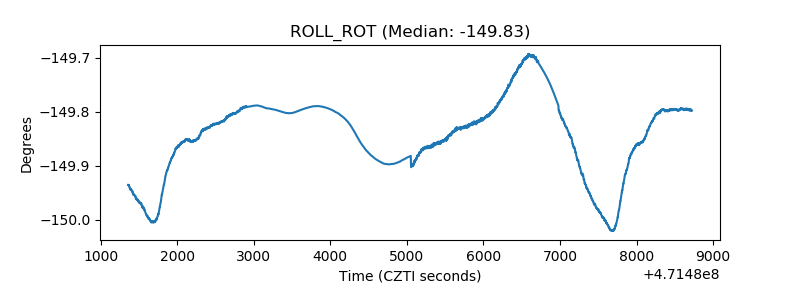 |
| _Roll_DEC | 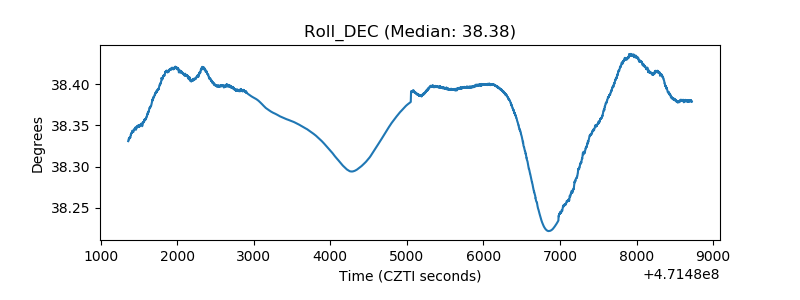 |
| _Roll_RA | 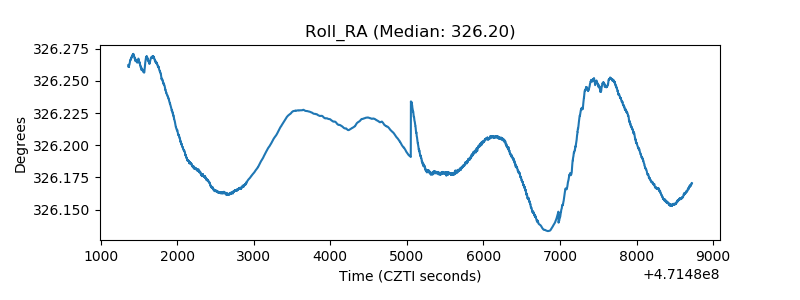 |
| Veto Counter | 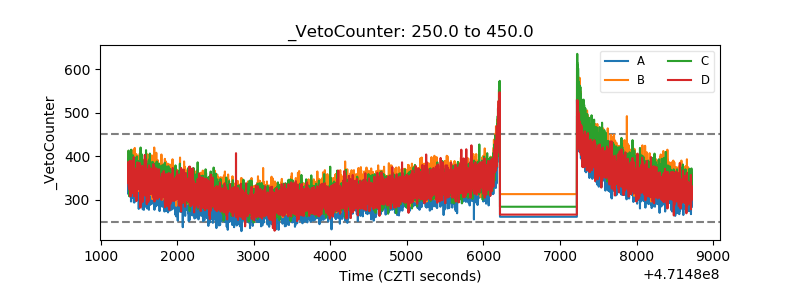 |