| Param | Original file | Final file |
|---|---|---|
| Filename | modeM0/AS1A13_037T01_9000006440_49765cztM0_level2.fits | modeM0/AS1A13_037T01_9000006440_49765cztM0_level2_quad_clean.evt |
| Size (bytes) | 1,044,241,920 | 47,180,160 |
| Size | 995.9 MB | 45.0 MB |
| Events in quadrant A | 14,285,251 | 322,275 |
| Events in quadrant B | 3,372,440 | 607,693 |
| Events in quadrant C | 8,739,614 | 34,804 |
| Events in quadrant D | 11,806,187 | 49,350 |
| Mode M9 | |||
|---|---|---|---|
| Quadrant | BADHDUFLAG | Total packets | Discarded packets |
| A | 0 | 10 | 0 |
| B | 0 | 10 | 0 |
| C | 0 | 10 | 0 |
| D | 0 | 10 | 0 |
| Mode SS | |||
|---|---|---|---|
| Quadrant | BADHDUFLAG | Total packets | Discarded packets |
| A | 0 | 120 | 0 |
| B | 0 | 120 | 0 |
| C | 0 | 120 | 0 |
| D | 0 | 120 | 0 |
| Mode M0 | |||
|---|---|---|---|
| Quadrant | BADHDUFLAG | Total packets | Discarded packets |
| A | 0 | 46367 | 0 |
| B | 0 | 13996 | 0 |
| C | 0 | 30046 | 0 |
| D | 0 | 39060 | 0 |
| Quadrant | Total seconds | Saturated seconds | Saturation percentage |
|---|---|---|---|
| A | 5803 | 5516 | 95.054282% |
| B | 5803 | 179 | 3.084611% |
| C | 5803 | 5802 | 99.982768% |
| D | 5803 | 5803 | 100.000000% |
Noise dominated data is calculated using 1-second bins in cleaned event files. If a bin has >2000 counts, and if more than 50% of those come from <1% of pixels, then it is considered to be noise-dominated and hence unusable.
| Quadrant | # 1 sec bins | Bins with >0 counts | Bins with >2000 counts | High rate bins dominated by noise | Noise dominated (total time) | Noise dominated (detector-on time) | Marked lightcurve |
|---|---|---|---|---|---|---|---|
| A | 6862 | 5803 | 5528 | 5528 | 80.56% | 95.26% | 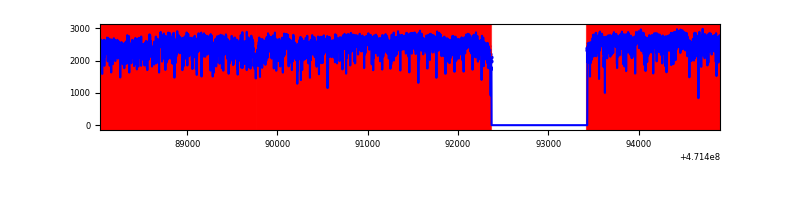 |
| B | 6862 | 5802 | 90 | 90 | 1.31% | 1.55% | 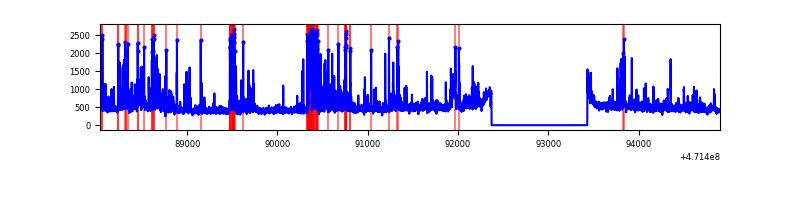 |
| C | 6862 | 5802 | 1568 | 1568 | 22.85% | 27.03% | 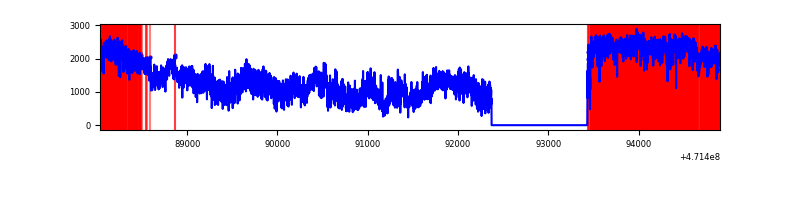 |
| D | 6862 | 5802 | 3468 | 3468 | 50.54% | 59.77% | 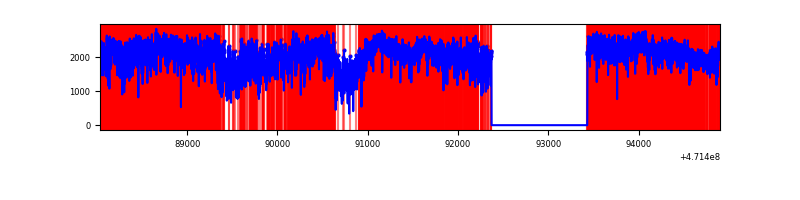 |
Top three noisy pixels from each quadrant. If the there are fewer than three noisy pixels in the level2.evt file, extra rows are filled as -1
| Pixel properties | Quadrant properties | ||||||
|---|---|---|---|---|---|---|---|
| Quadrant | DetID | PixID | Counts | Sigma | Mean | Median | Sigma |
| A | 10 | 83 | 5440295 | 53333.12 | 371 | 360 | 102.0 |
| A | 7 | 64 | 2827719 | 27719.42 | 371 | 360 | 102.0 |
| A | 12 | 50 | 1196726 | 11729.17 | 371 | 360 | 102.0 |
| B | 4 | 171 | 414660 | 3104.55 | 628 | 610 | 133.4 |
| B | 4 | 21 | 72788 | 541.19 | 628 | 610 | 133.4 |
| B | 4 | 206 | 66403 | 493.32 | 628 | 610 | 133.4 |
| C | 15 | 180 | 2070609 | 76795.25 | 53 | 51 | 27.0 |
| C | 15 | 190 | 1765156 | 65466.26 | 53 | 51 | 27.0 |
| C | 15 | 196 | 771086 | 28597.04 | 53 | 51 | 27.0 |
| D | 15 | 142 | 6663301 | 207412.99 | 74 | 70 | 32.1 |
| D | 7 | 61 | 2486230 | 77389.17 | 74 | 70 | 32.1 |
| D | 15 | 40 | 617423 | 19216.96 | 74 | 70 | 32.1 |
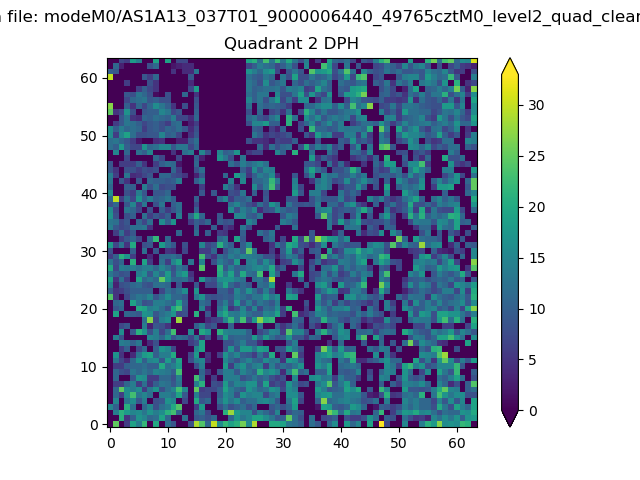
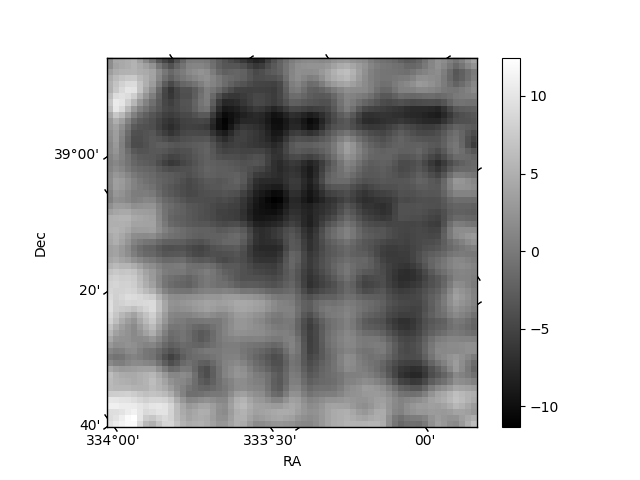
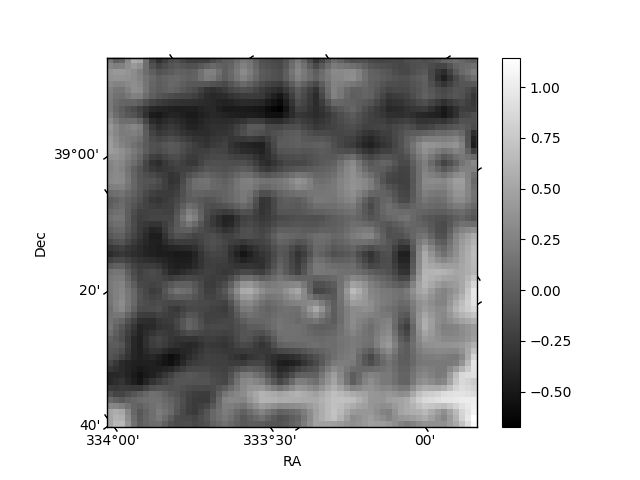
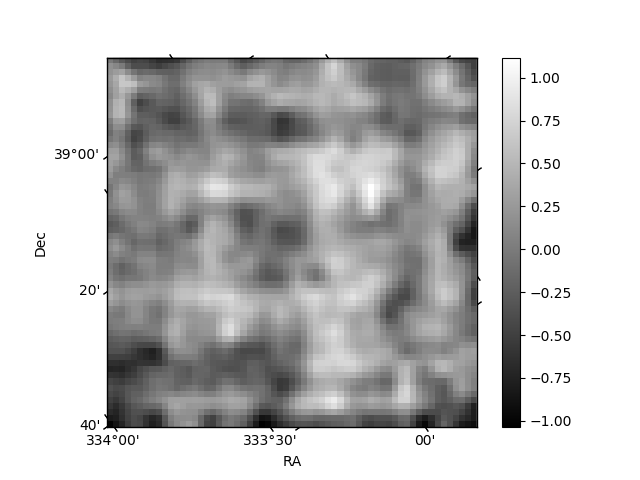
Histogram calculated using DETX and DETY for each event in the final _common_clean file
| Quadrant A | 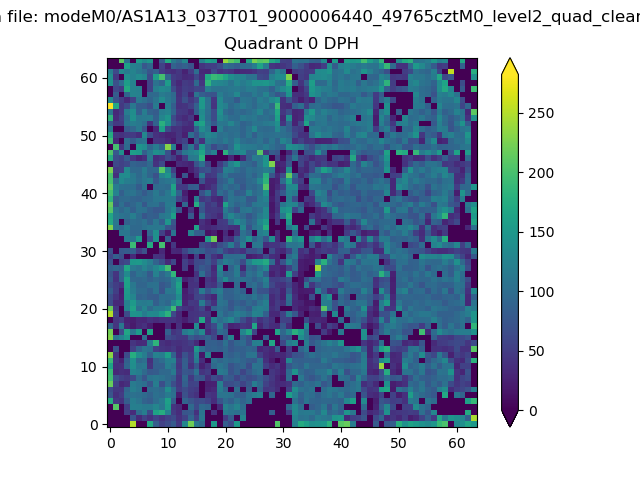 |
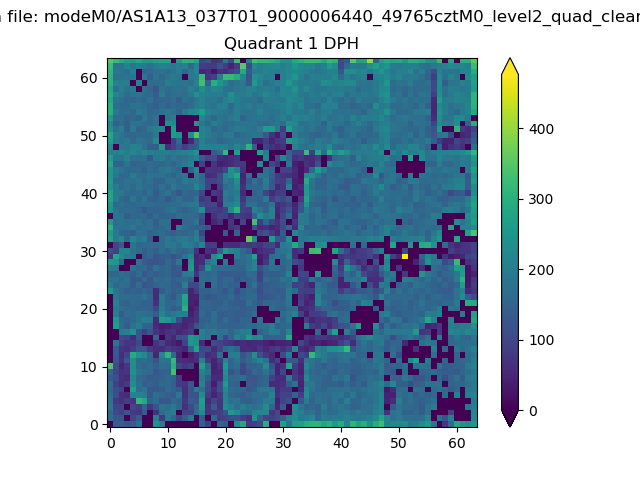 |
Quadrant B |
|---|---|---|---|
| Quadrant D | 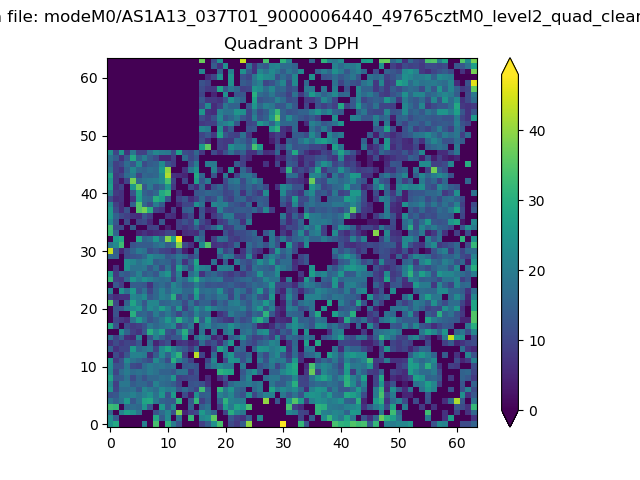 |
 |
Quadrant C |
| Plot type | Count rate plots | Images |
|---|---|---|
| Comparison with Poisson distribution Blue bars denote a histogram of data divided into 1 sec bins. Red curve is a Poisson curve with rate = median count rate of data. |
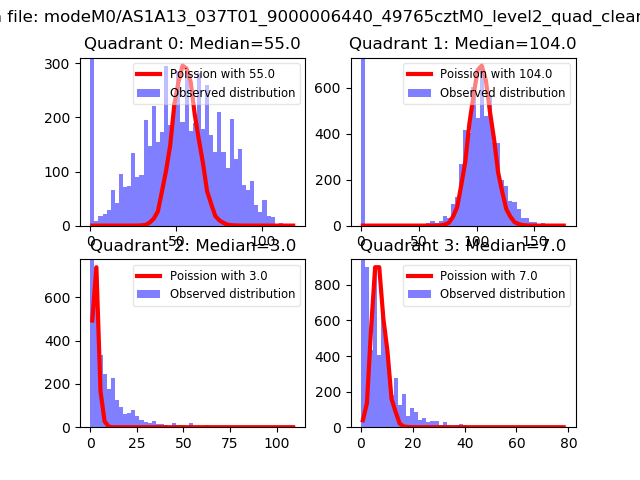 |
 |
| Quadrant-wise count rates Data is divided into 100 sec bins |
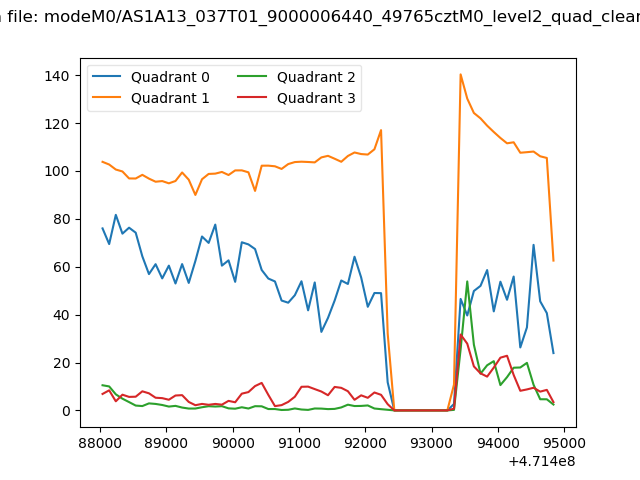 |
|
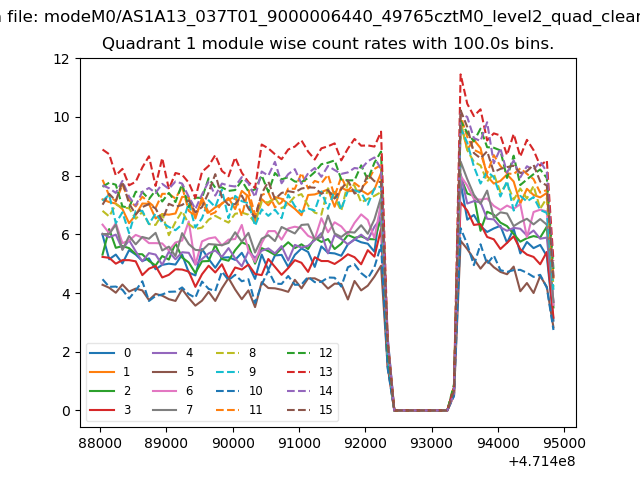
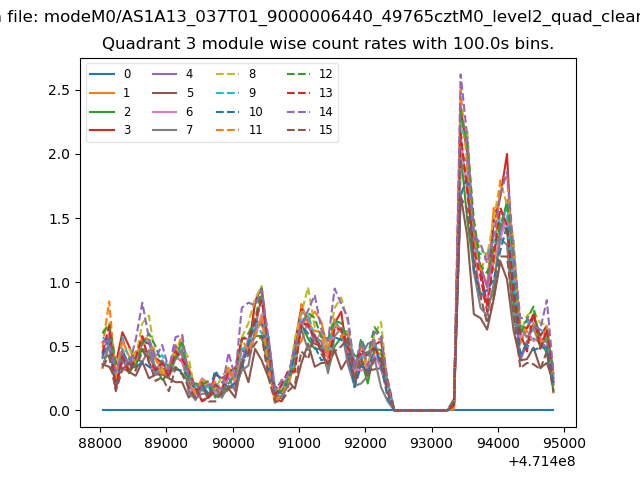
| Module-wise count rates for Quadrant A Data is divided into 100 sec bins |
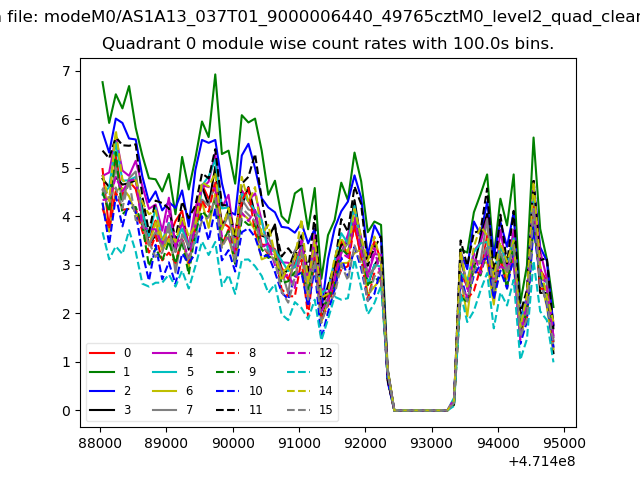 |
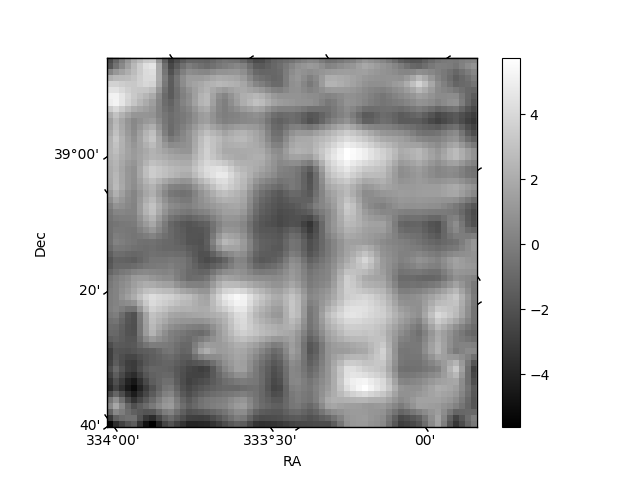 |
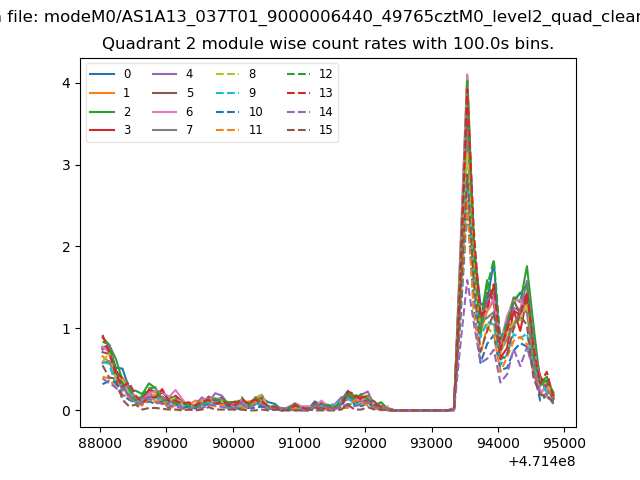
| Module-wise count rates for Quadrant B Data is divided into 100 sec bins |
 |
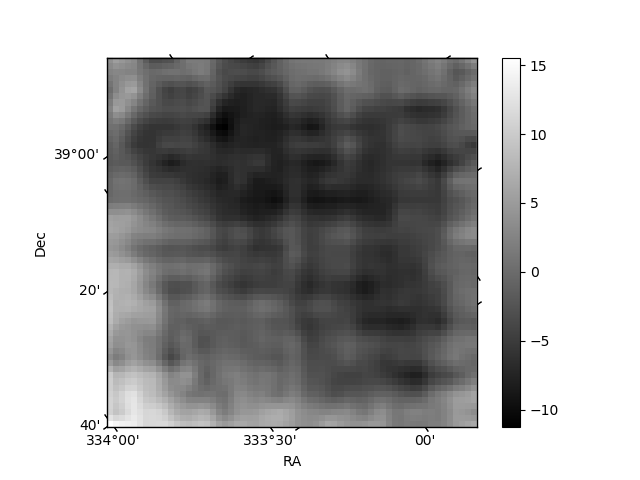 |
| Module-wise count rates for Quadrant C Data is divided into 100 sec bins |
 |
 |
| Module-wise count rates for Quadrant D Data is divided into 100 sec bins |
 |
 |
| Parameter | Plot |
|---|---|
| CZT HV Monitor | 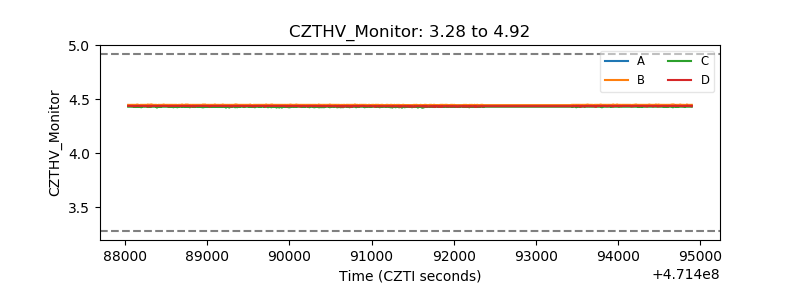 |
| D_VDD | 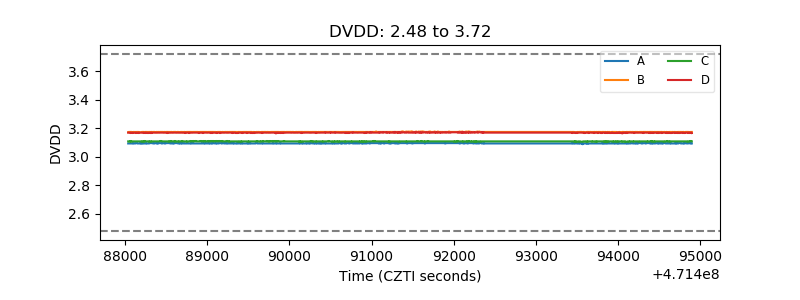 |
| Temperature 1 | 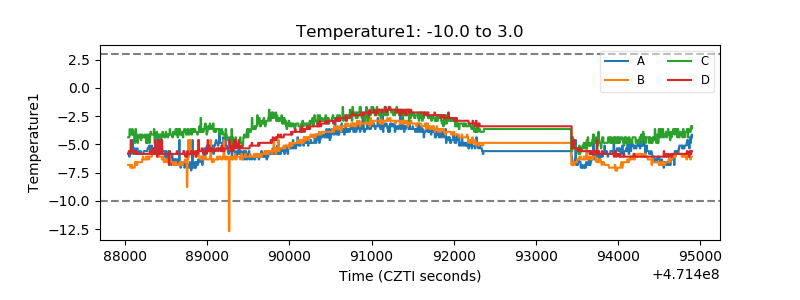 |
| Veto HV Monitor | 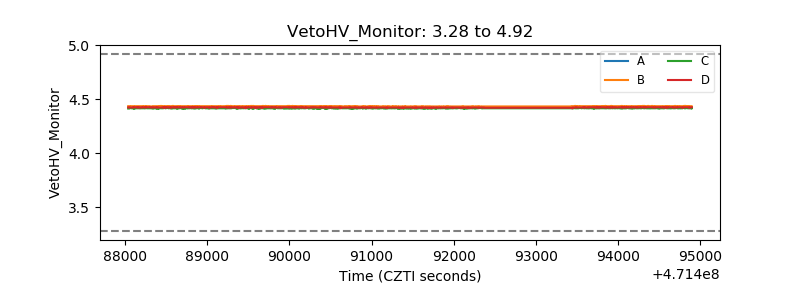 |
| Veto LLD | 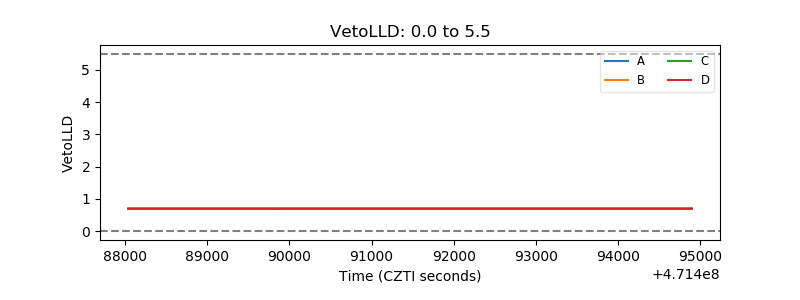 |
| Alpha Counter | 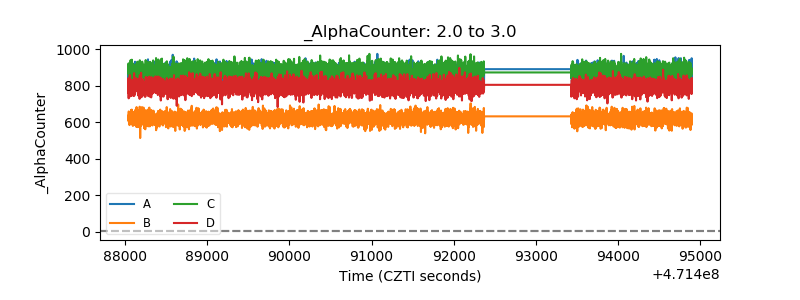 |
| _CPM_Rate | 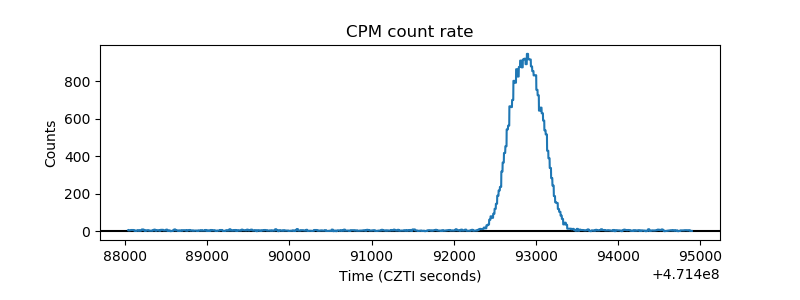 |
| CZT Counter | 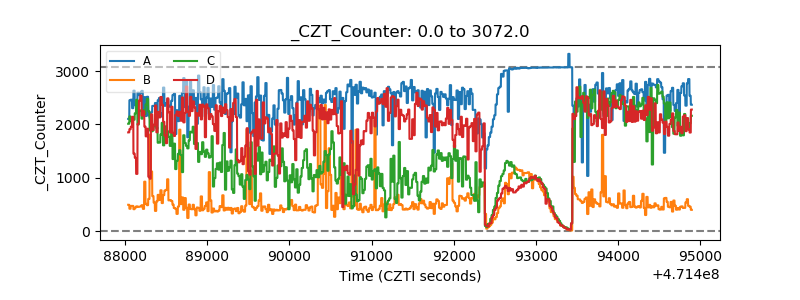 |
| +2.5 Volts monitor | 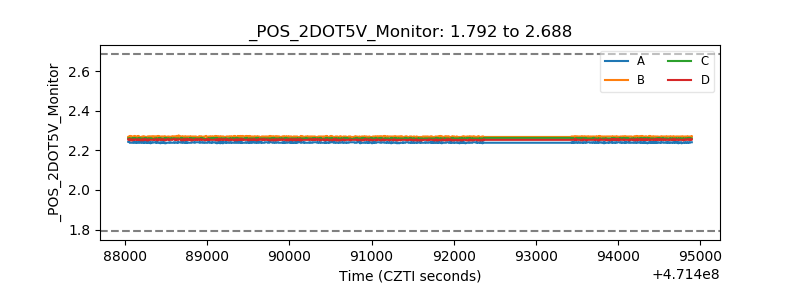 |
| +5 Volts monitor |  |
| _ROLL_ROT | 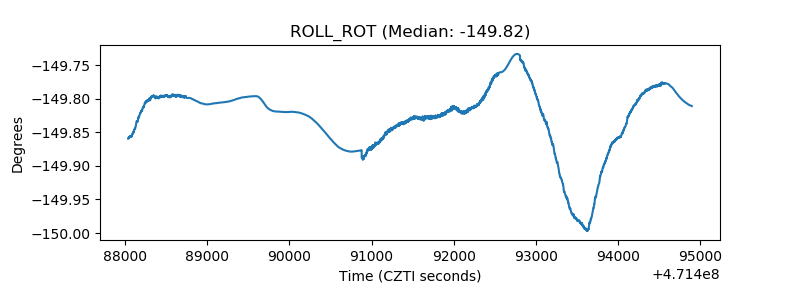 |
| _Roll_DEC | 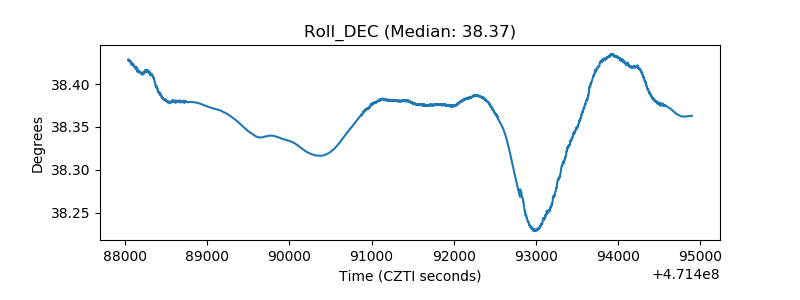 |
| _Roll_RA | 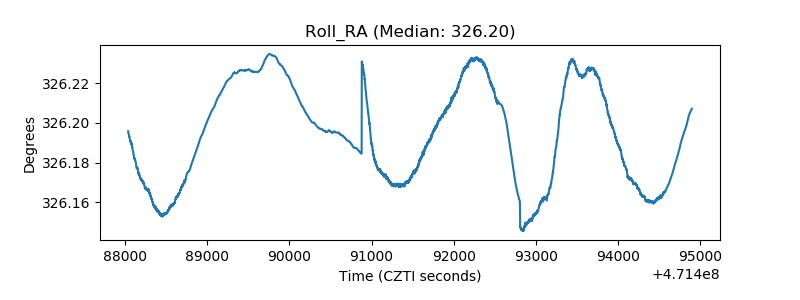 |
| Veto Counter | 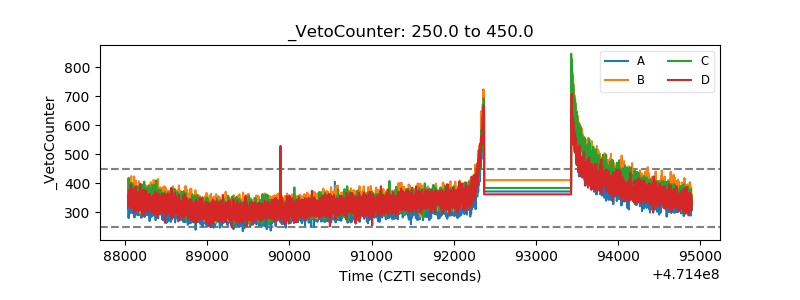 |