| Param | Original file | Final file |
|---|---|---|
| Filename | modeM0/AS1A13_037T01_9000006440_49766cztM0_level2.fits | modeM0/AS1A13_037T01_9000006440_49766cztM0_level2_quad_clean.evt |
| Size (bytes) | 1,046,456,640 | 47,180,160 |
| Size | 998.0 MB | 45.0 MB |
| Events in quadrant A | 13,721,040 | 330,740 |
| Events in quadrant B | 4,204,328 | 591,873 |
| Events in quadrant C | 9,105,999 | 69,435 |
| Events in quadrant D | 11,264,541 | 32,075 |
| Mode M9 | |||
|---|---|---|---|
| Quadrant | BADHDUFLAG | Total packets | Discarded packets |
| A | 0 | 11 | 0 |
| B | 0 | 11 | 0 |
| C | 0 | 11 | 0 |
| D | 0 | 11 | 0 |
| Mode SS | |||
|---|---|---|---|
| Quadrant | BADHDUFLAG | Total packets | Discarded packets |
| A | 0 | 114 | 0 |
| B | 0 | 114 | 0 |
| C | 0 | 114 | 0 |
| D | 0 | 114 | 0 |
| Mode M0 | |||
|---|---|---|---|
| Quadrant | BADHDUFLAG | Total packets | Discarded packets |
| A | 0 | 44610 | 0 |
| B | 0 | 16411 | 0 |
| C | 0 | 31018 | 0 |
| D | 0 | 37387 | 0 |
| Quadrant | Total seconds | Saturated seconds | Saturation percentage |
|---|---|---|---|
| A | 5672 | 5235 | 92.295487% |
| B | 5672 | 627 | 11.054302% |
| C | 5673 | 5496 | 96.879958% |
| D | 5673 | 5673 | 100.000000% |
Noise dominated data is calculated using 1-second bins in cleaned event files. If a bin has >2000 counts, and if more than 50% of those come from <1% of pixels, then it is considered to be noise-dominated and hence unusable.
| Quadrant | # 1 sec bins | Bins with >0 counts | Bins with >2000 counts | High rate bins dominated by noise | Noise dominated (total time) | Noise dominated (detector-on time) | Marked lightcurve |
|---|---|---|---|---|---|---|---|
| A | 6773 | 5674 | 5268 | 5268 | 77.78% | 92.84% | 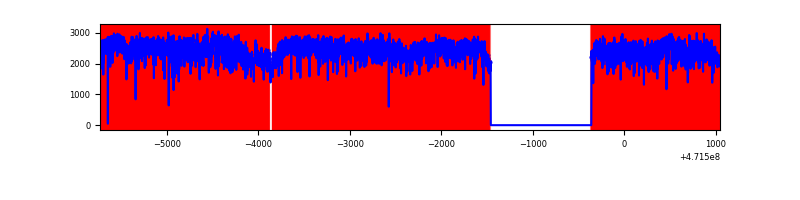 |
| B | 6772 | 5672 | 418 | 418 | 6.17% | 7.37% | 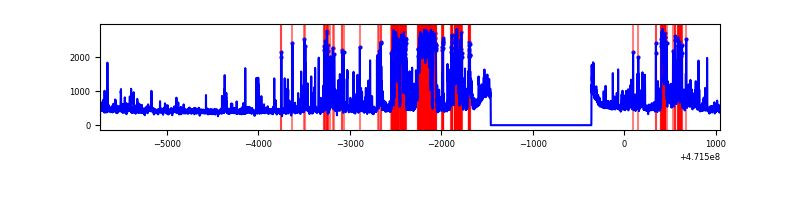 |
| C | 6773 | 5673 | 1486 | 1486 | 21.94% | 26.19% | 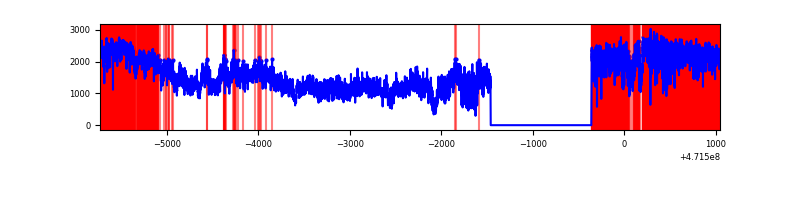 |
| D | 6773 | 5674 | 3003 | 3003 | 44.34% | 52.93% | 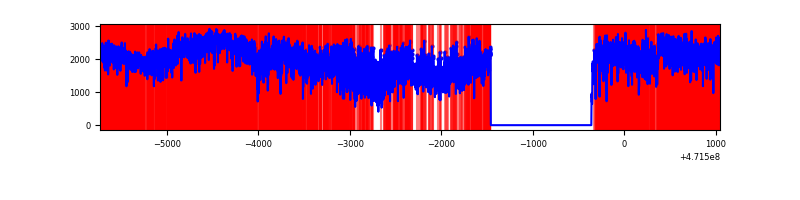 |
Top three noisy pixels from each quadrant. If the there are fewer than three noisy pixels in the level2.evt file, extra rows are filled as -1
| Pixel properties | Quadrant properties | ||||||
|---|---|---|---|---|---|---|---|
| Quadrant | DetID | PixID | Counts | Sigma | Mean | Median | Sigma |
| A | 10 | 83 | 5362493 | 51824.82 | 378 | 366 | 103.5 |
| A | 7 | 64 | 2541686 | 24561.79 | 378 | 366 | 103.5 |
| A | 6 | 250 | 1201173 | 11605.77 | 378 | 366 | 103.5 |
| B | 5 | 172 | 893045 | 6884.39 | 606 | 589 | 129.6 |
| B | 10 | 28 | 438760 | 3380.04 | 606 | 589 | 129.6 |
| B | 4 | 206 | 91673 | 702.62 | 606 | 589 | 129.6 |
| C | 15 | 180 | 1980025 | 58673.39 | 90 | 88 | 33.7 |
| C | 15 | 190 | 1965569 | 58245.0 | 90 | 88 | 33.7 |
| C | 15 | 163 | 1201101 | 35590.78 | 90 | 88 | 33.7 |
| D | 15 | 142 | 7145873 | 282468.39 | 54 | 51 | 25.3 |
| D | 7 | 61 | 1760899 | 69604.86 | 54 | 51 | 25.3 |
| D | 15 | 40 | 501189 | 19809.57 | 54 | 51 | 25.3 |
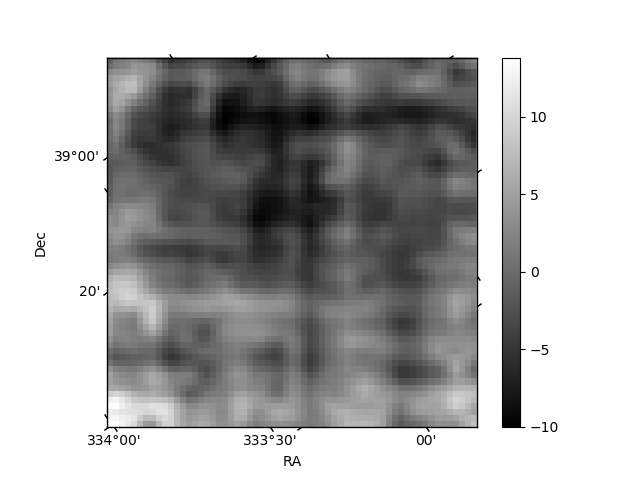
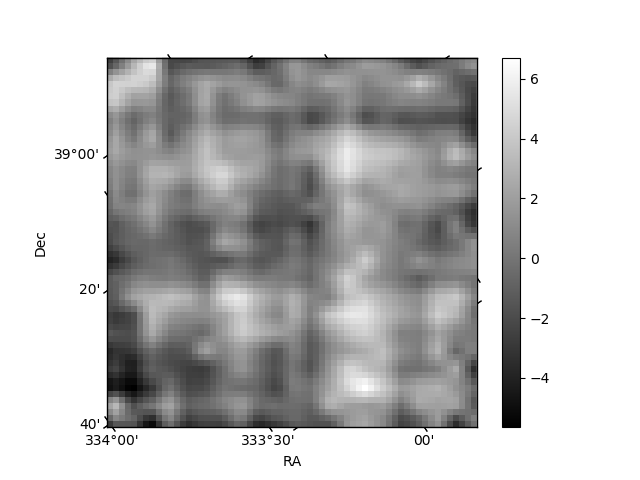
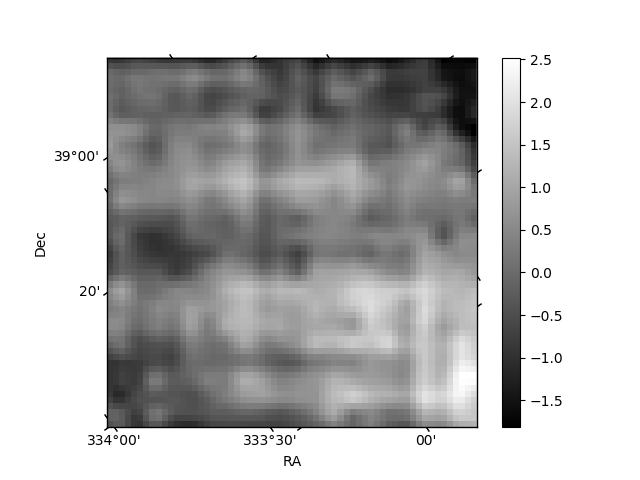
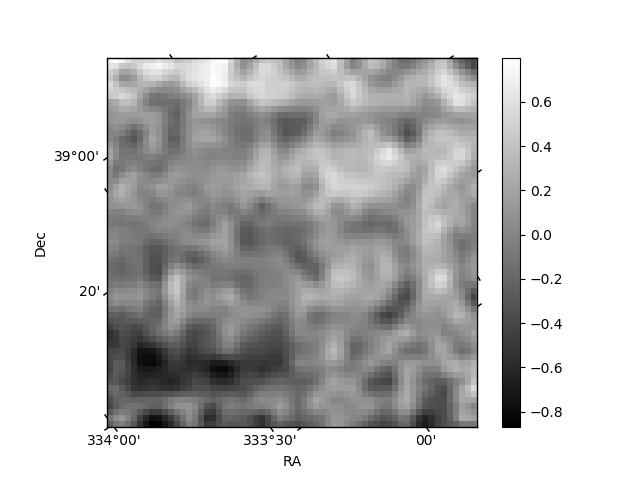
Histogram calculated using DETX and DETY for each event in the final _common_clean file
| Quadrant A | 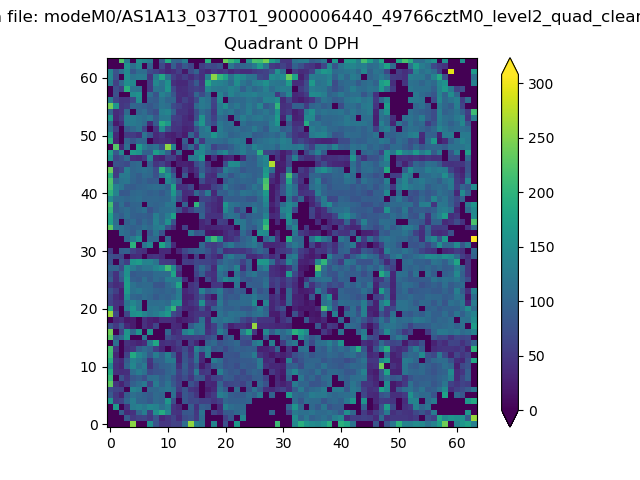 |
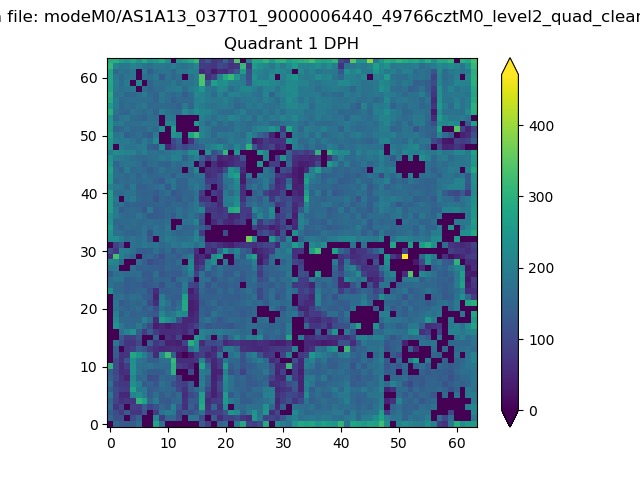 |
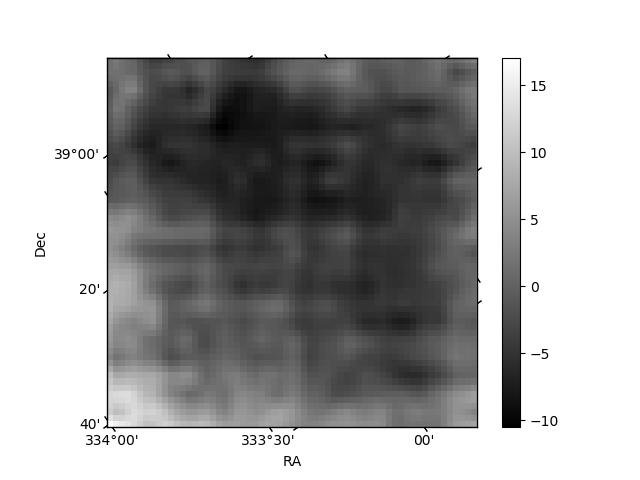
Quadrant B |
|---|---|---|---|
| Quadrant D | 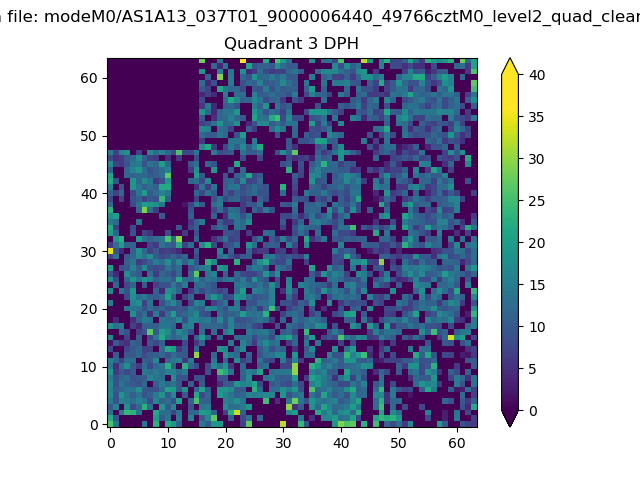 |
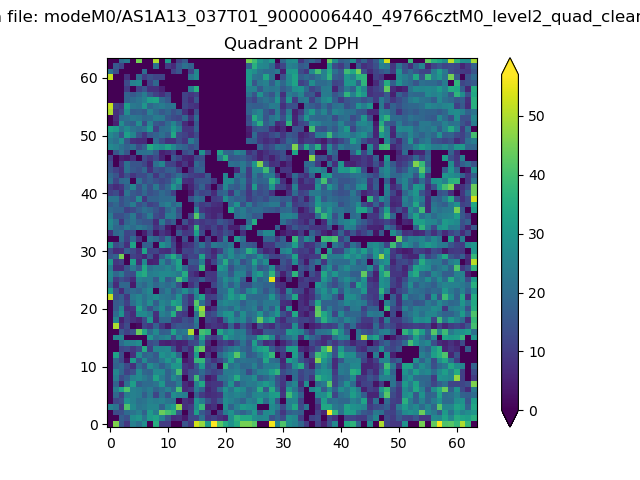 |
Quadrant C |
| Plot type | Count rate plots | Images |
|---|---|---|
| Comparison with Poisson distribution Blue bars denote a histogram of data divided into 1 sec bins. Red curve is a Poisson curve with rate = median count rate of data. |
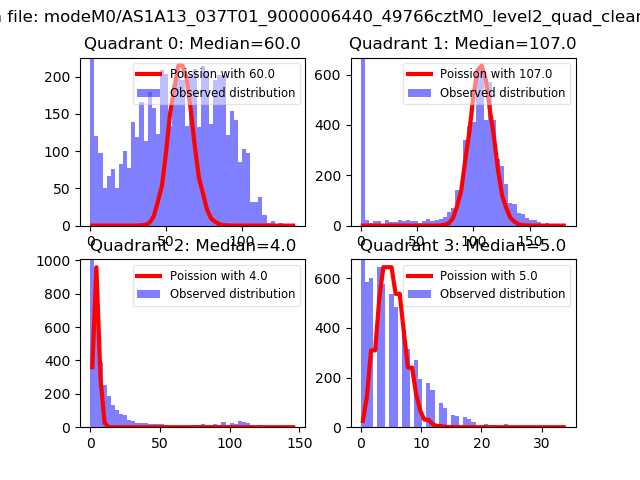 |
 |
| Quadrant-wise count rates Data is divided into 100 sec bins |
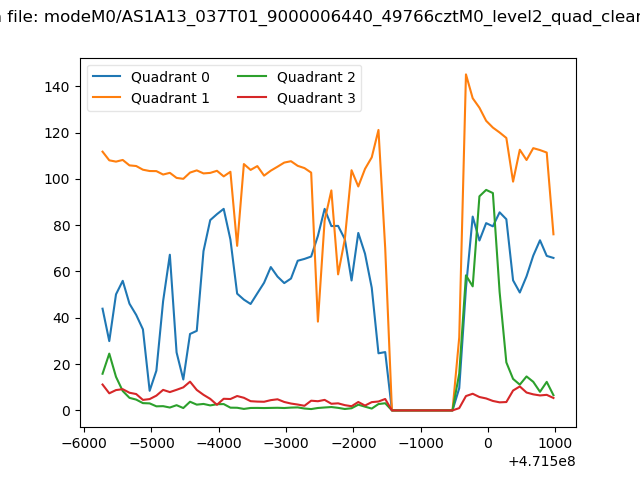 |
|
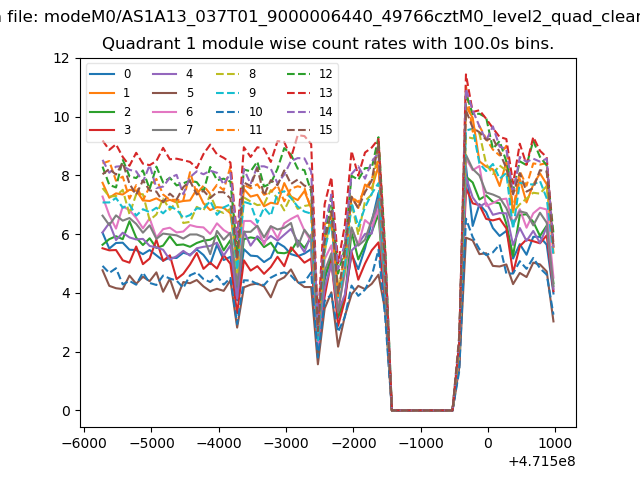
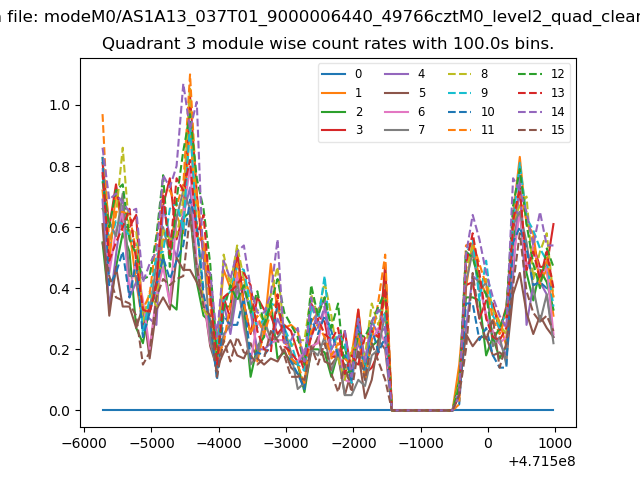
| Module-wise count rates for Quadrant A Data is divided into 100 sec bins |
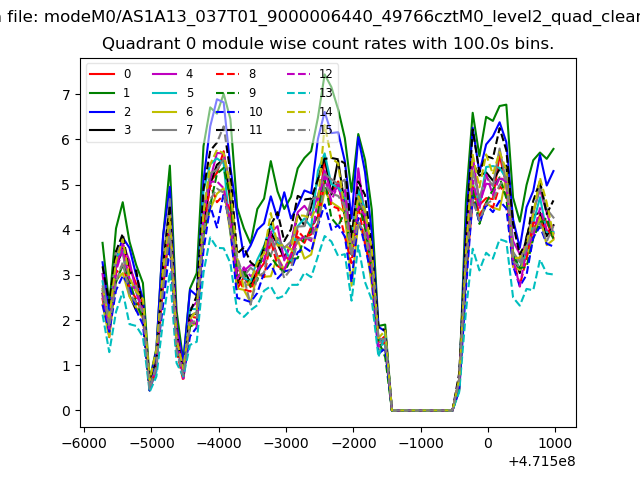 |
 |
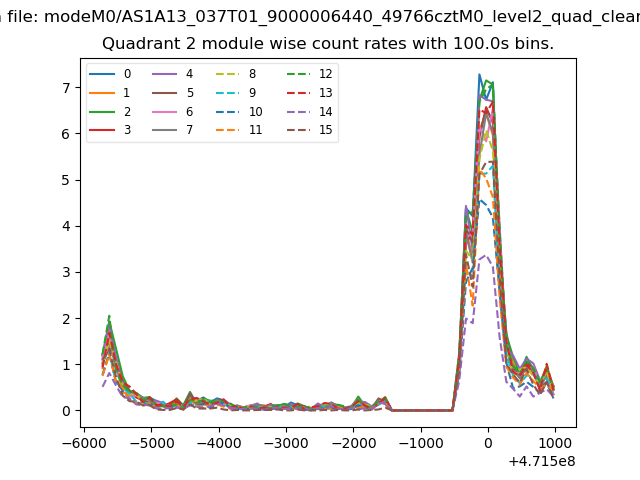
| Module-wise count rates for Quadrant B Data is divided into 100 sec bins |
 |
 |
| Module-wise count rates for Quadrant C Data is divided into 100 sec bins |
 |
 |
| Module-wise count rates for Quadrant D Data is divided into 100 sec bins |
 |
 |
| Parameter | Plot |
|---|---|
| CZT HV Monitor | 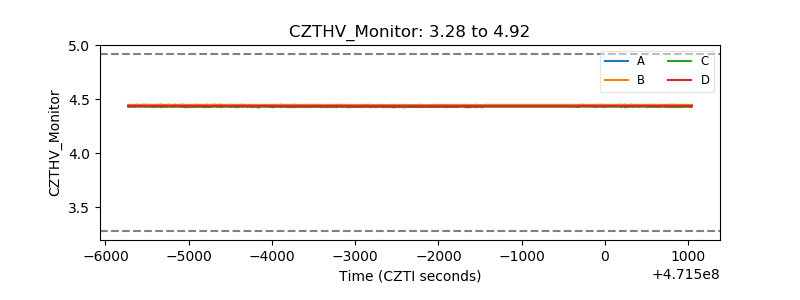 |
| D_VDD | 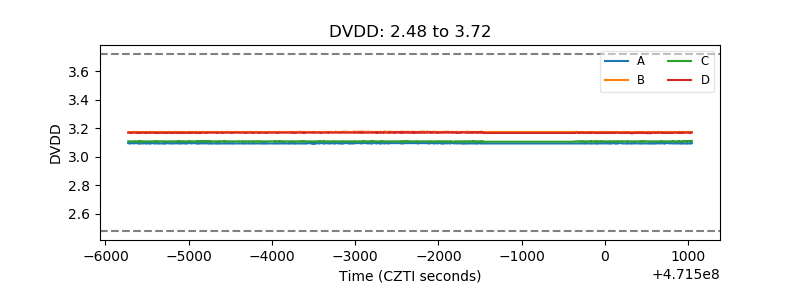 |
| Temperature 1 | 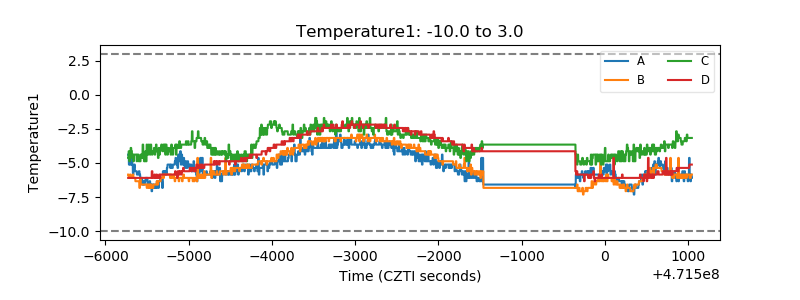 |
| Veto HV Monitor | 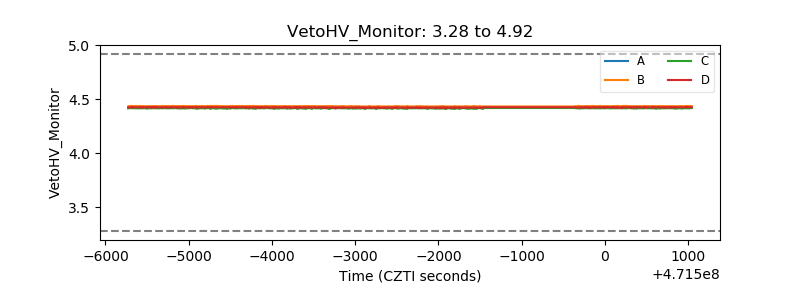 |
| Veto LLD | 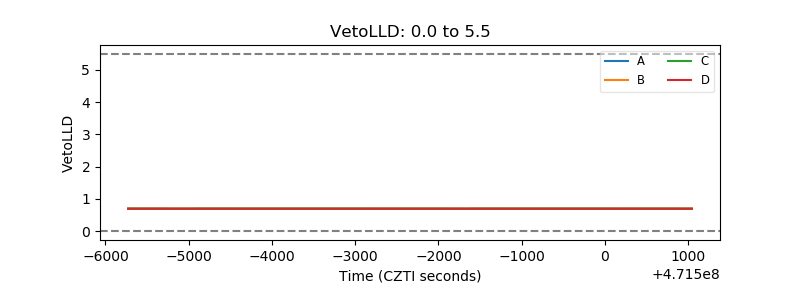 |
| Alpha Counter | 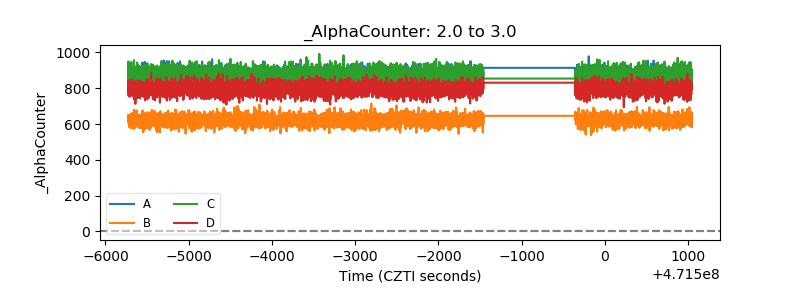 |
| _CPM_Rate | 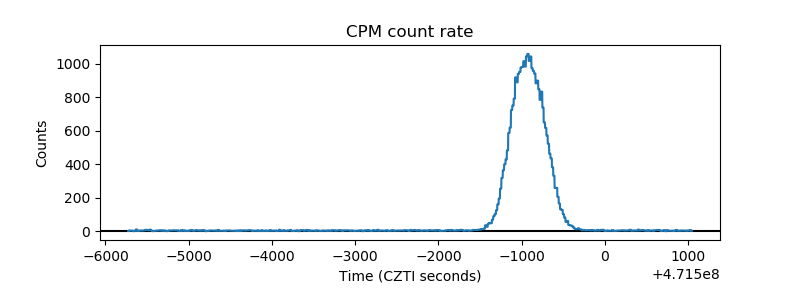 |
| CZT Counter | 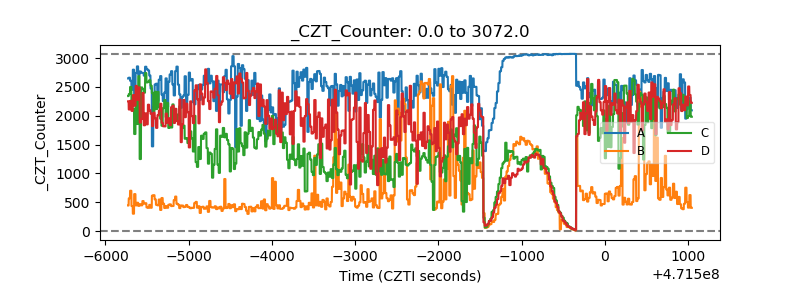 |
| +2.5 Volts monitor | 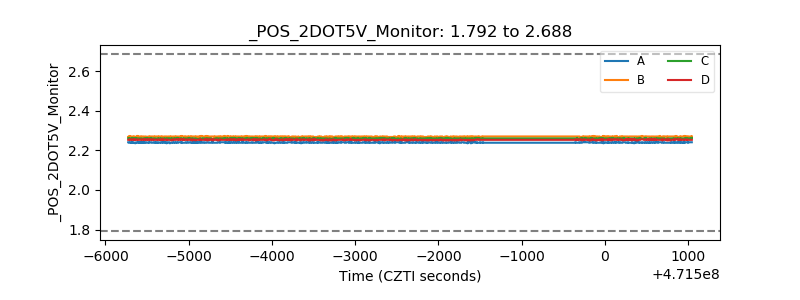 |
| +5 Volts monitor | 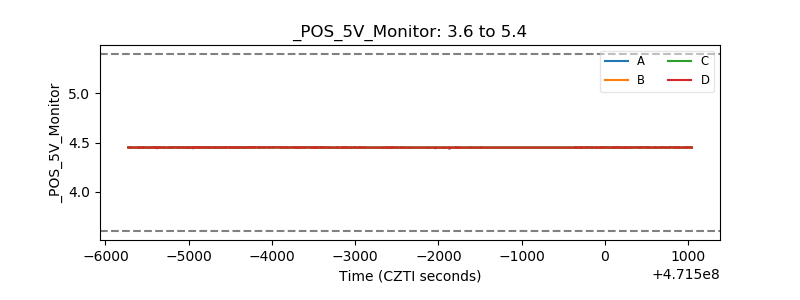 |
| _ROLL_ROT | 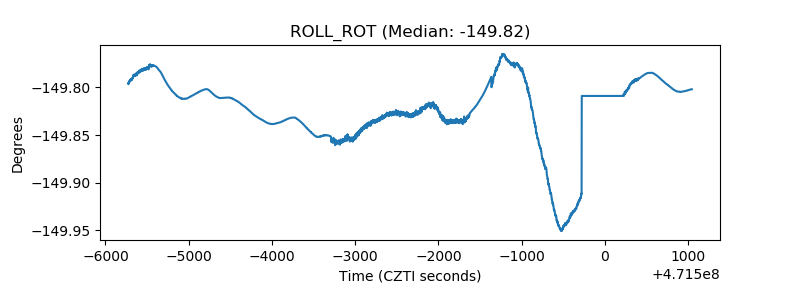 |
| _Roll_DEC | 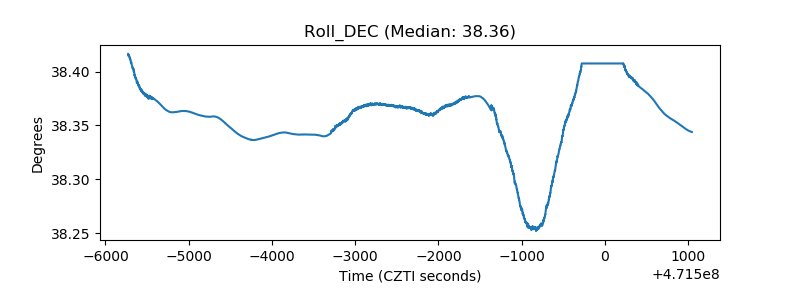 |
| _Roll_RA | 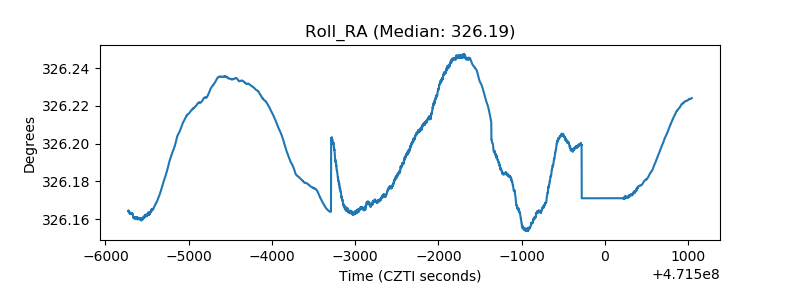 |
| Veto Counter | 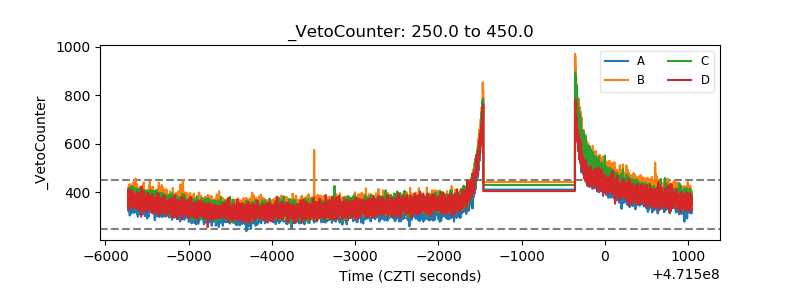 |