| Param | Original file | Final file |
|---|---|---|
| Filename | modeM0/AS1A13_037T01_9000006440_49767cztM0_level2.fits | modeM0/AS1A13_037T01_9000006440_49767cztM0_level2_quad_clean.evt |
| Size (bytes) | 1,135,776,960 | 36,953,280 |
| Size | 1.1 GB | 35.2 MB |
| Events in quadrant A | 13,786,477 | 100,496 |
| Events in quadrant B | 5,031,892 | 564,830 |
| Events in quadrant C | 9,747,814 | 38,852 |
| Events in quadrant D | 13,022,958 | 5,207 |
| Mode M9 | |||
|---|---|---|---|
| Quadrant | BADHDUFLAG | Total packets | Discarded packets |
| A | 0 | 12 | 0 |
| B | 0 | 12 | 0 |
| C | 0 | 12 | 0 |
| D | 0 | 12 | 0 |
| Mode SS | |||
|---|---|---|---|
| Quadrant | BADHDUFLAG | Total packets | Discarded packets |
| A | 0 | 118 | 0 |
| B | 0 | 118 | 0 |
| C | 0 | 118 | 0 |
| D | 0 | 118 | 0 |
| Mode M0 | |||
|---|---|---|---|
| Quadrant | BADHDUFLAG | Total packets | Discarded packets |
| A | 0 | 44950 | 68 |
| B | 0 | 18947 | 10 |
| C | 0 | 33122 | 86 |
| D | 0 | 42745 | 27 |
| Quadrant | Total seconds | Saturated seconds | Saturation percentage |
|---|---|---|---|
| A | 5857 | 5068 | 86.528940% |
| B | 5863 | 877 | 14.958213% |
| C | 5855 | 5536 | 94.551665% |
| D | 5861 | 5826 | 99.402832% |
Noise dominated data is calculated using 1-second bins in cleaned event files. If a bin has >2000 counts, and if more than 50% of those come from <1% of pixels, then it is considered to be noise-dominated and hence unusable.
| Quadrant | # 1 sec bins | Bins with >0 counts | Bins with >2000 counts | High rate bins dominated by noise | Noise dominated (total time) | Noise dominated (detector-on time) | Marked lightcurve |
|---|---|---|---|---|---|---|---|
| A | 7026 | 5864 | 5093 | 5093 | 72.49% | 86.85% | 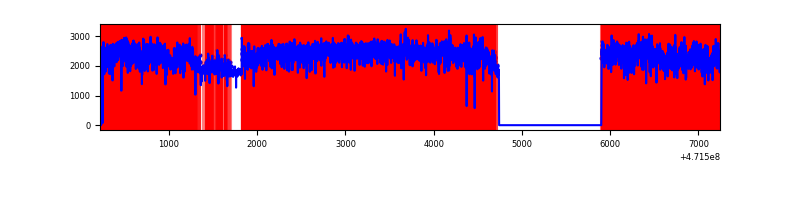 |
| B | 7026 | 5866 | 610 | 610 | 8.68% | 10.40% | 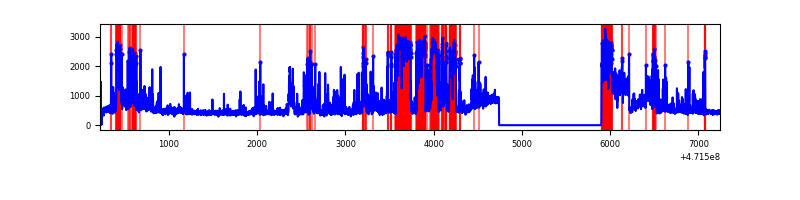 |
| C | 7026 | 5864 | 1510 | 1510 | 21.49% | 25.75% | 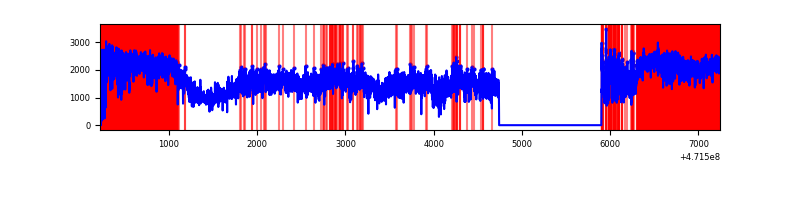 |
| D | 7025 | 5865 | 4400 | 4400 | 62.63% | 75.02% | 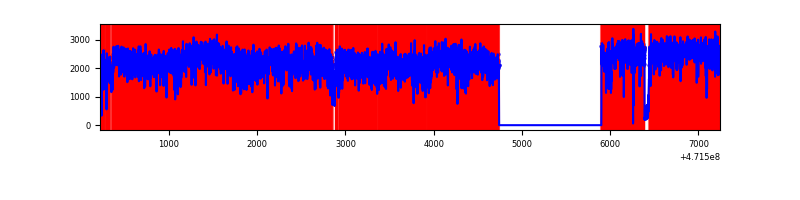 |
Top three noisy pixels from each quadrant. If the there are fewer than three noisy pixels in the level2.evt file, extra rows are filled as -1
| Pixel properties | Quadrant properties | ||||||
|---|---|---|---|---|---|---|---|
| Quadrant | DetID | PixID | Counts | Sigma | Mean | Median | Sigma |
| A | 10 | 83 | 6360121 | 49723.19 | 464 | 451 | 127.9 |
| A | 7 | 64 | 2507659 | 19602.65 | 464 | 451 | 127.9 |
| A | 12 | 50 | 1154856 | 9025.73 | 464 | 451 | 127.9 |
| B | 10 | 28 | 1030469 | 7918.83 | 614 | 598 | 130.1 |
| B | 5 | 172 | 855227 | 6571.37 | 614 | 598 | 130.1 |
| B | 5 | 185 | 147147 | 1126.84 | 614 | 598 | 130.1 |
| C | 15 | 180 | 2281354 | 53411.76 | 109 | 106 | 42.7 |
| C | 15 | 190 | 1837755 | 43025.6 | 109 | 106 | 42.7 |
| C | 15 | 163 | 1659374 | 38849.09 | 109 | 106 | 42.7 |
| D | 15 | 142 | 6000810 | 132739.83 | 119 | 113 | 45.2 |
| D | 7 | 61 | 2004055 | 44328.67 | 119 | 113 | 45.2 |
| D | 15 | 40 | 905173 | 20020.59 | 119 | 113 | 45.2 |
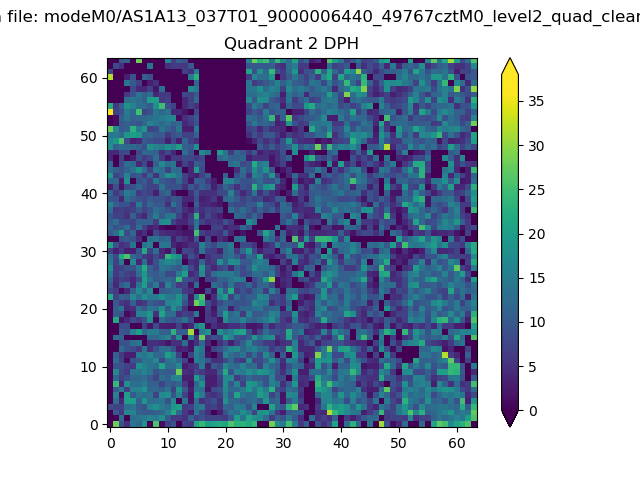
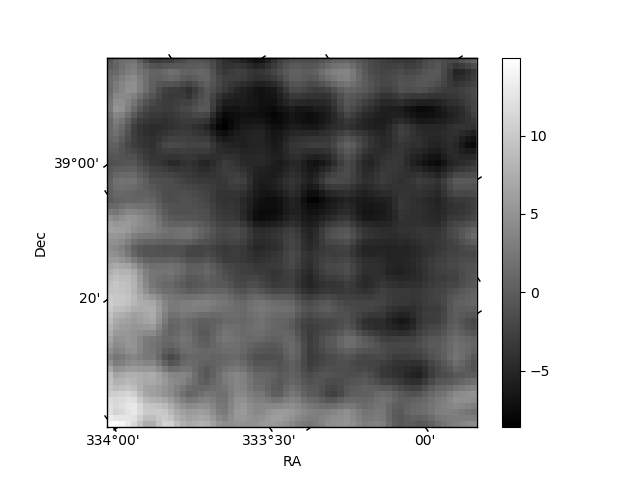
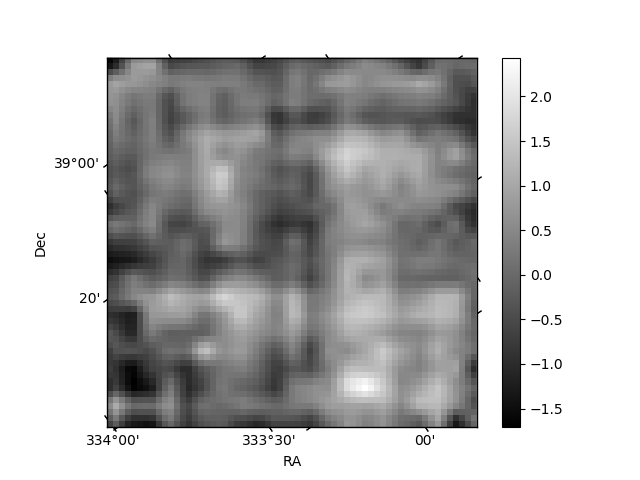
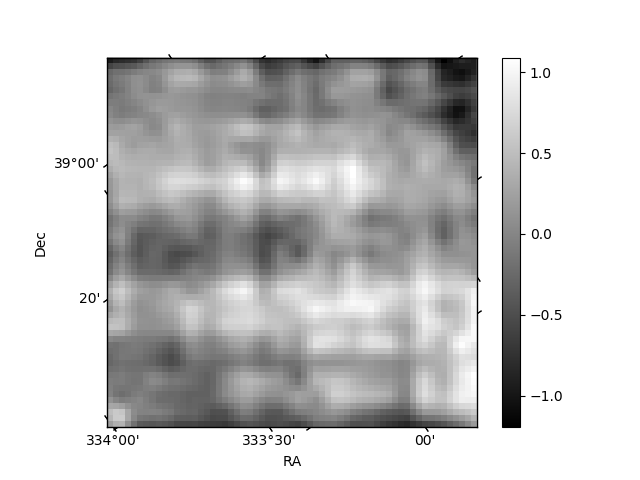
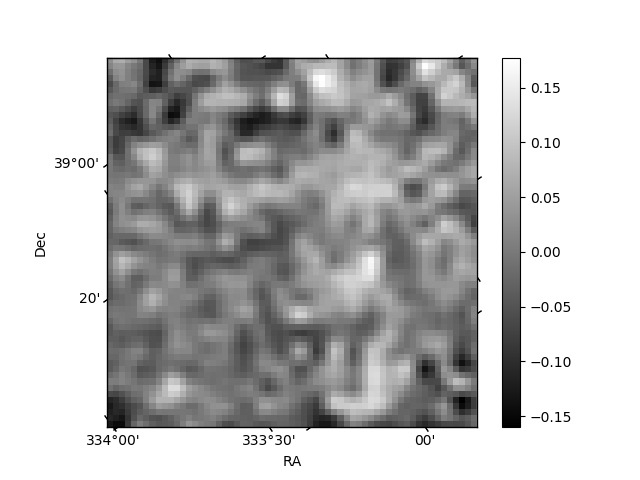
Histogram calculated using DETX and DETY for each event in the final _common_clean file
| Quadrant A | 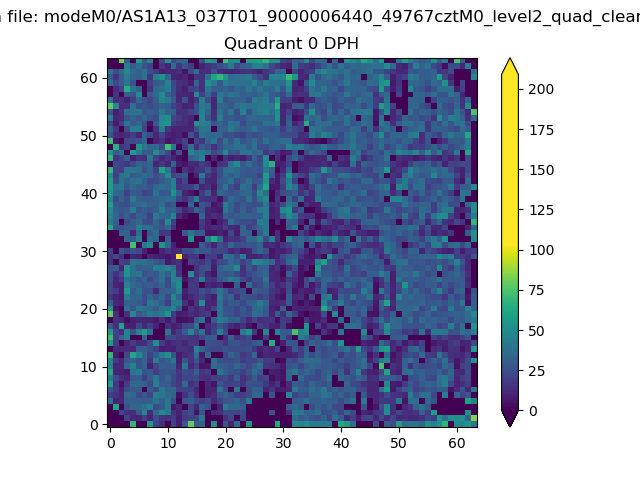 |
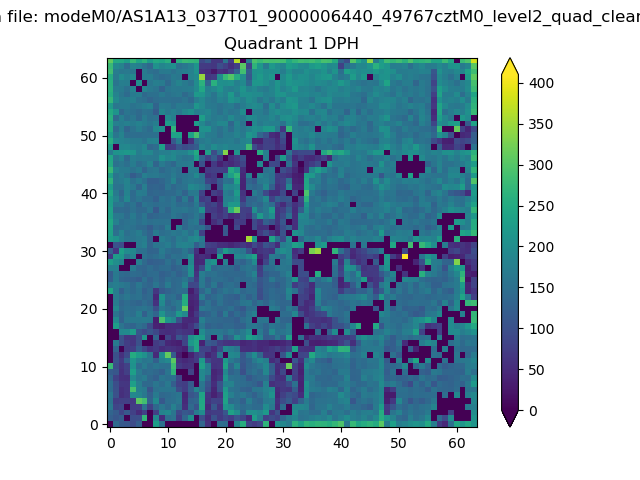 |
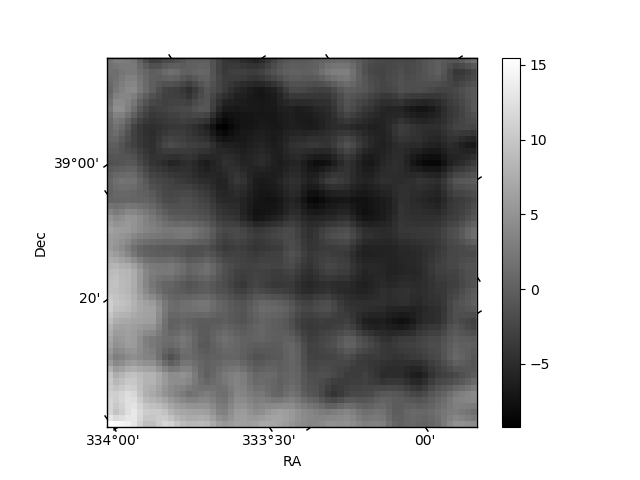
Quadrant B |
|---|---|---|---|
| Quadrant D | 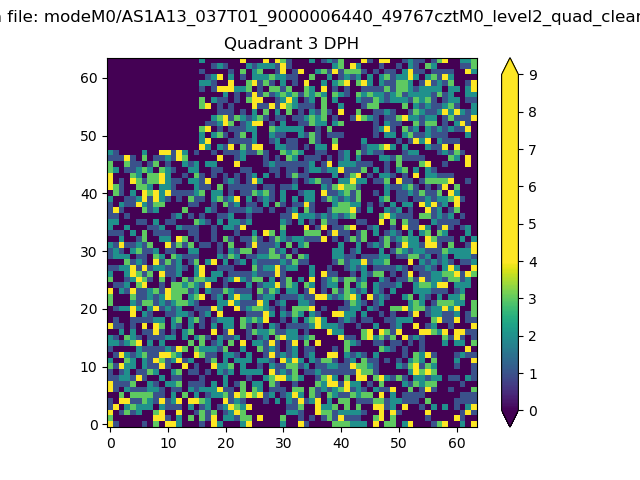 |
 |
Quadrant C |
| Plot type | Count rate plots | Images |
|---|---|---|
| Comparison with Poisson distribution Blue bars denote a histogram of data divided into 1 sec bins. Red curve is a Poisson curve with rate = median count rate of data. |
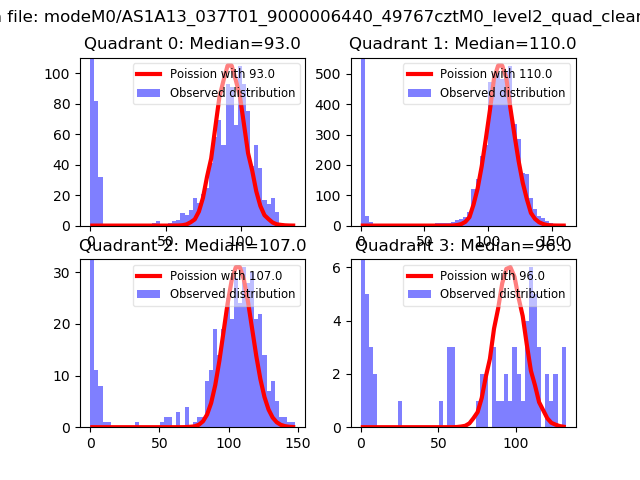 |
 |
| Quadrant-wise count rates Data is divided into 100 sec bins |
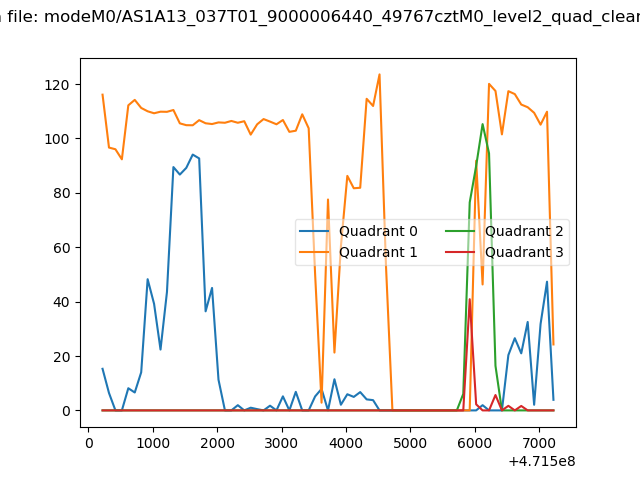 |
|
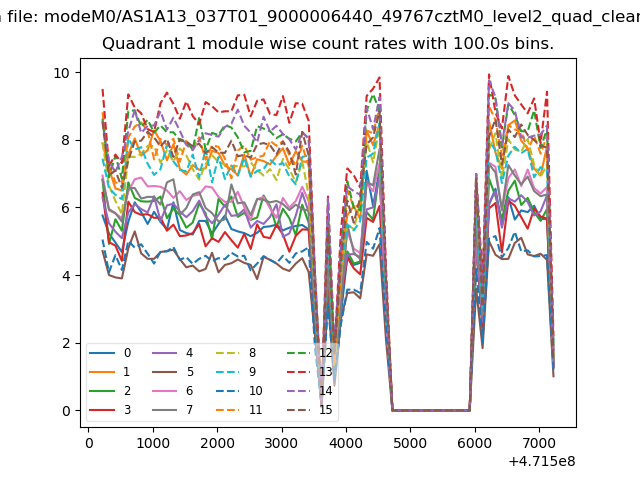
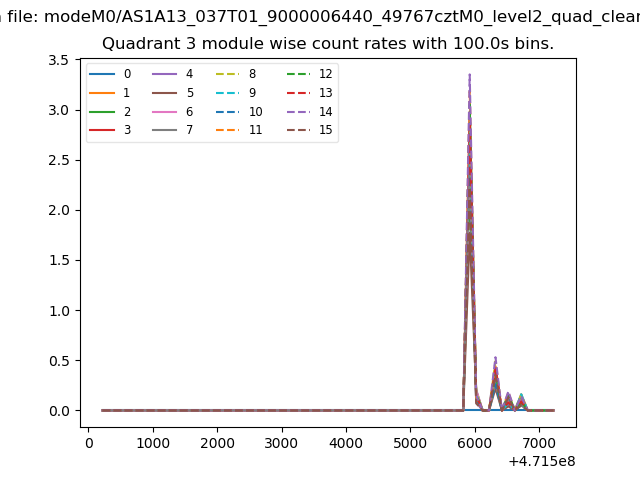
| Module-wise count rates for Quadrant A Data is divided into 100 sec bins |
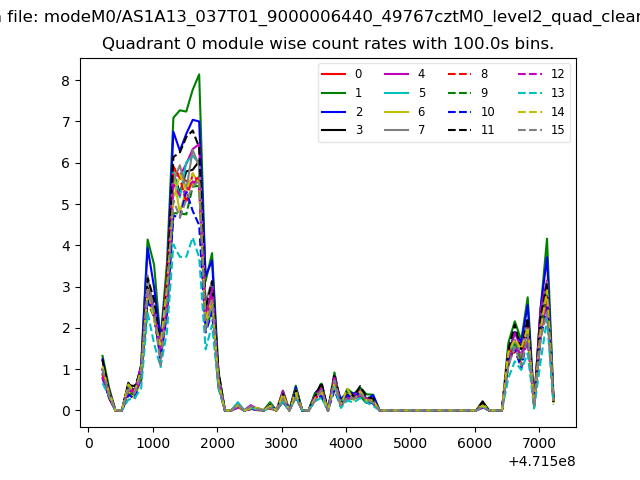 |
 |
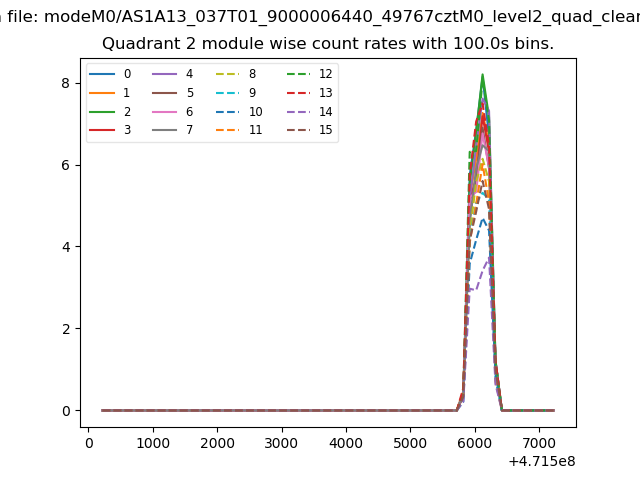
| Module-wise count rates for Quadrant B Data is divided into 100 sec bins |
 |
 |
| Module-wise count rates for Quadrant C Data is divided into 100 sec bins |
 |
 |
| Module-wise count rates for Quadrant D Data is divided into 100 sec bins |
 |
 |
| Parameter | Plot |
|---|---|
| CZT HV Monitor | 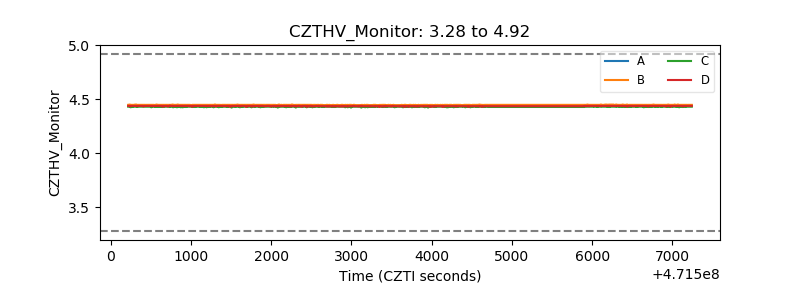 |
| D_VDD | 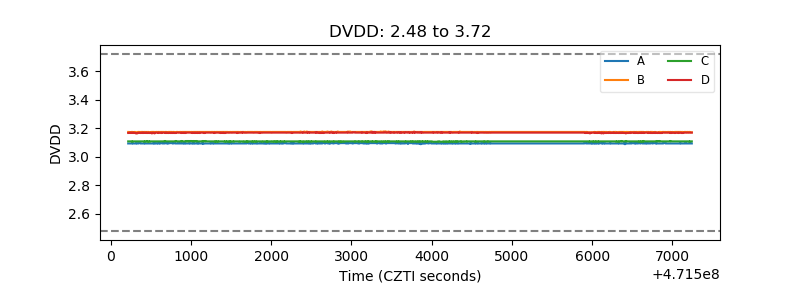 |
| Temperature 1 | 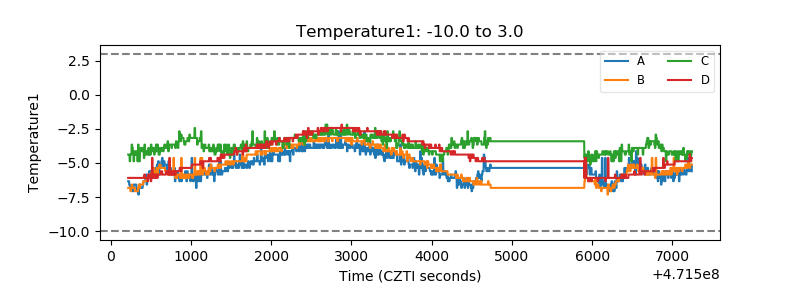 |
| Veto HV Monitor |  |
| Veto LLD | 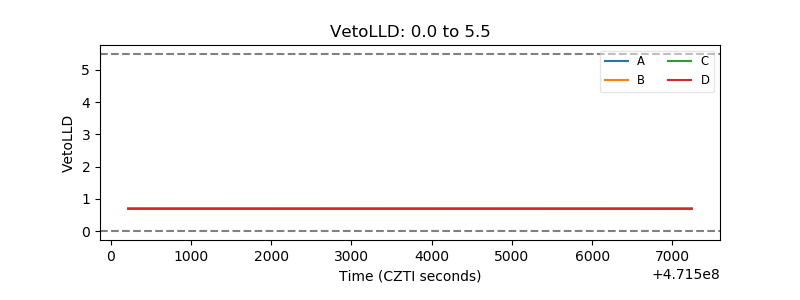 |
| Alpha Counter | 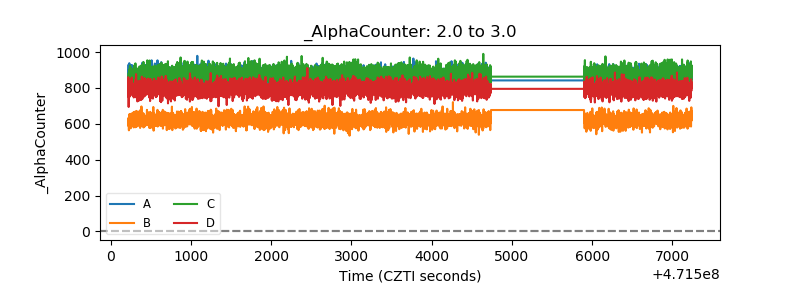 |
| _CPM_Rate | 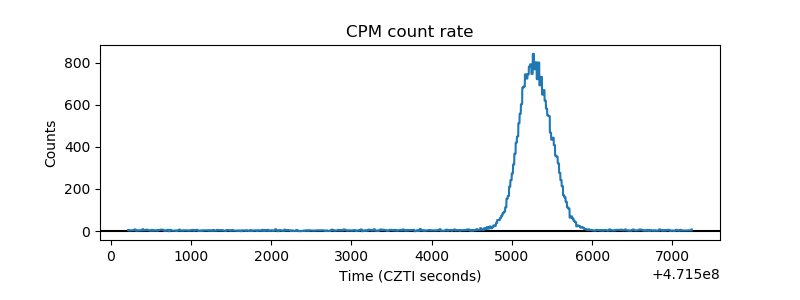 |
| CZT Counter | 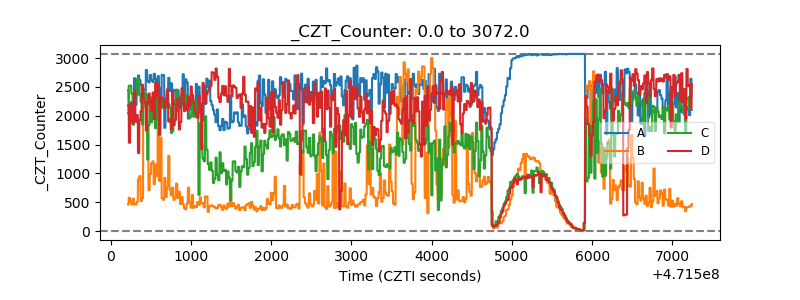 |
| +2.5 Volts monitor | 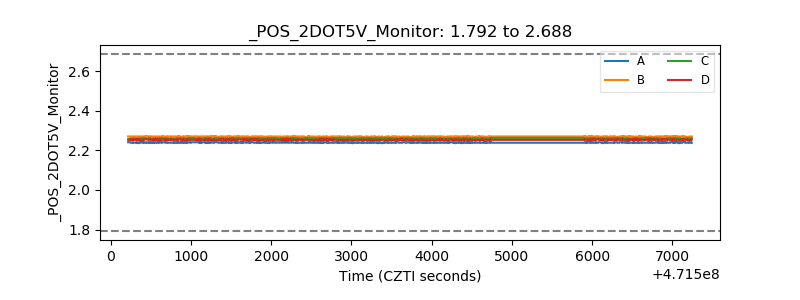 |
| +5 Volts monitor | 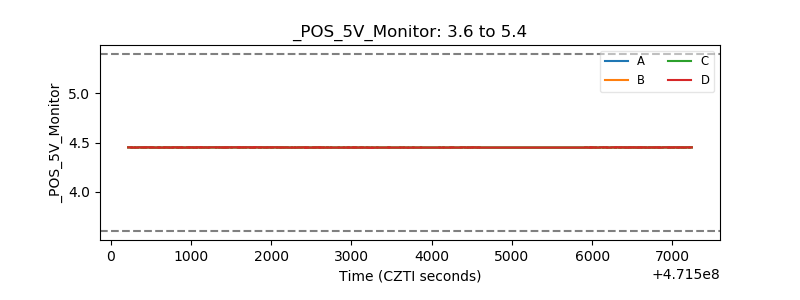 |
| _ROLL_ROT | 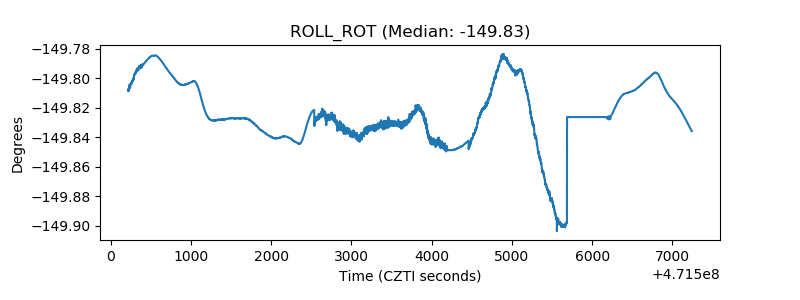 |
| _Roll_DEC | 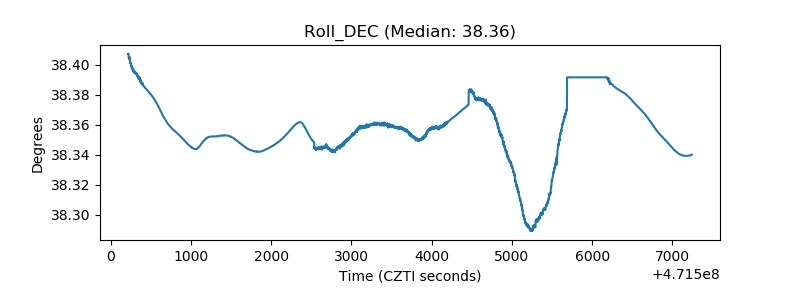 |
| _Roll_RA | 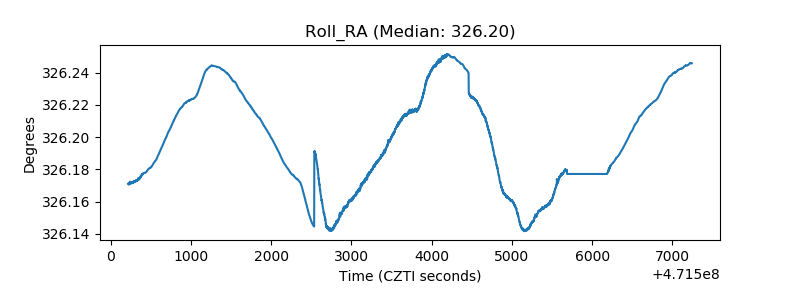 |
| Veto Counter | 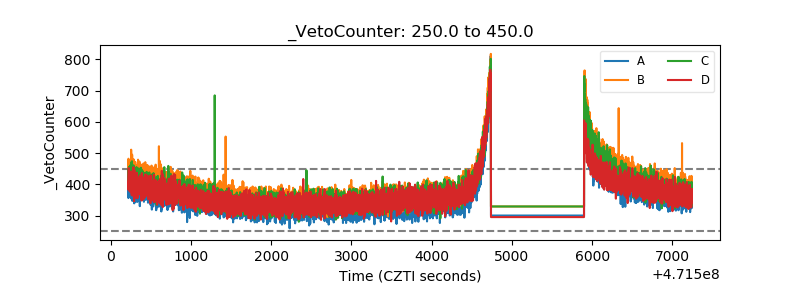 |