| Param | Original file | Final file |
|---|---|---|
| Filename | modeM0/AS1A13_037T01_9000006440_49768cztM0_level2.fits | modeM0/AS1A13_037T01_9000006440_49768cztM0_level2_quad_clean.evt |
| Size (bytes) | 1,183,996,800 | 41,512,320 |
| Size | 1.1 GB | 39.6 MB |
| Events in quadrant A | 14,511,826 | 128,948 |
| Events in quadrant B | 4,452,976 | 651,565 |
| Events in quadrant C | 9,625,357 | 28,496 |
| Events in quadrant D | 14,752,608 | 10,649 |
| Mode M9 | |||
|---|---|---|---|
| Quadrant | BADHDUFLAG | Total packets | Discarded packets |
| A | 0 | 11 | 0 |
| B | 0 | 11 | 0 |
| C | 0 | 11 | 0 |
| D | 0 | 11 | 0 |
| Mode SS | |||
|---|---|---|---|
| Quadrant | BADHDUFLAG | Total packets | Discarded packets |
| A | 0 | 126 | 0 |
| B | 0 | 126 | 0 |
| C | 0 | 126 | 0 |
| D | 0 | 126 | 0 |
| Mode M0 | |||
|---|---|---|---|
| Quadrant | BADHDUFLAG | Total packets | Discarded packets |
| A | 0 | 47379 | 18 |
| B | 0 | 17429 | 23 |
| C | 0 | 32992 | 28 |
| D | 0 | 48137 | 32 |
| Quadrant | Total seconds | Saturated seconds | Saturation percentage |
|---|---|---|---|
| A | 6266 | 5377 | 85.812320% |
| B | 6263 | 413 | 6.594284% |
| C | 6264 | 6027 | 96.216475% |
| D | 6265 | 6186 | 98.739026% |
Noise dominated data is calculated using 1-second bins in cleaned event files. If a bin has >2000 counts, and if more than 50% of those come from <1% of pixels, then it is considered to be noise-dominated and hence unusable.
| Quadrant | # 1 sec bins | Bins with >0 counts | Bins with >2000 counts | High rate bins dominated by noise | Noise dominated (total time) | Noise dominated (detector-on time) | Marked lightcurve |
|---|---|---|---|---|---|---|---|
| A | 7348 | 6269 | 5610 | 5610 | 76.35% | 89.49% | 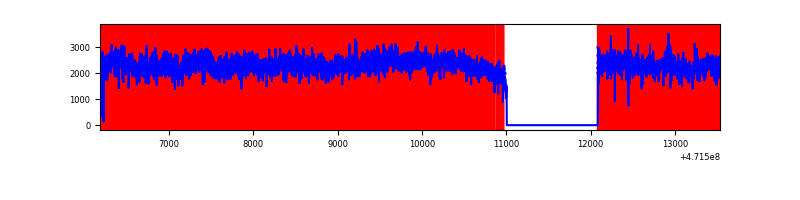 |
| B | 7348 | 6267 | 230 | 230 | 3.13% | 3.67% | 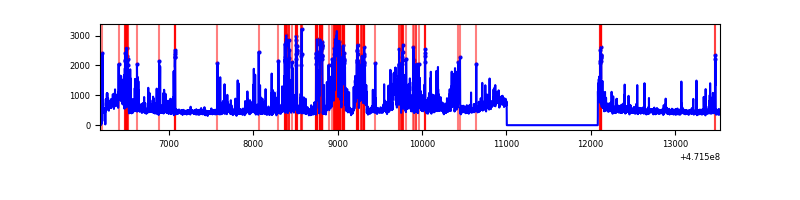 |
| C | 7348 | 6267 | 1621 | 1621 | 22.06% | 25.87% | 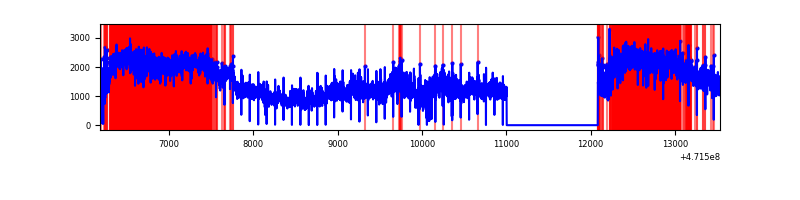 |
| D | 7349 | 6270 | 5255 | 5255 | 71.51% | 83.81% | 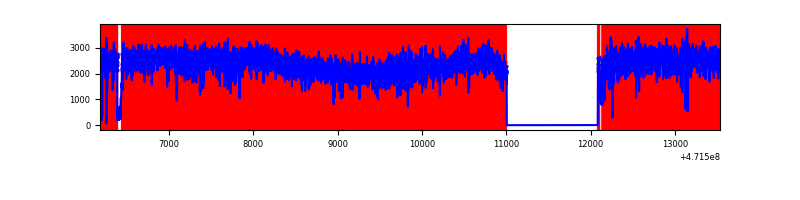 |
Top three noisy pixels from each quadrant. If the there are fewer than three noisy pixels in the level2.evt file, extra rows are filled as -1
| Pixel properties | Quadrant properties | ||||||
|---|---|---|---|---|---|---|---|
| Quadrant | DetID | PixID | Counts | Sigma | Mean | Median | Sigma |
| A | 10 | 83 | 7335672 | 49154.44 | 531 | 514 | 149.2 |
| A | 7 | 64 | 2031840 | 13612.34 | 531 | 514 | 149.2 |
| A | 15 | 63 | 513428 | 3437.14 | 531 | 514 | 149.2 |
| B | 10 | 28 | 648946 | 4383.84 | 691 | 669 | 147.9 |
| B | 1 | 207 | 342514 | 2311.66 | 691 | 669 | 147.9 |
| B | 5 | 185 | 130946 | 880.97 | 691 | 669 | 147.9 |
| C | 15 | 180 | 2985538 | 83245.5 | 105 | 103 | 35.9 |
| C | 15 | 190 | 2353763 | 65629.17 | 105 | 103 | 35.9 |
| C | 15 | 163 | 1026219 | 28612.09 | 105 | 103 | 35.9 |
| D | 15 | 142 | 3668588 | 47539.62 | 218 | 207 | 77.2 |
| D | 7 | 61 | 3180457 | 41213.78 | 218 | 207 | 77.2 |
| D | 15 | 40 | 1032290 | 13375.06 | 218 | 207 | 77.2 |
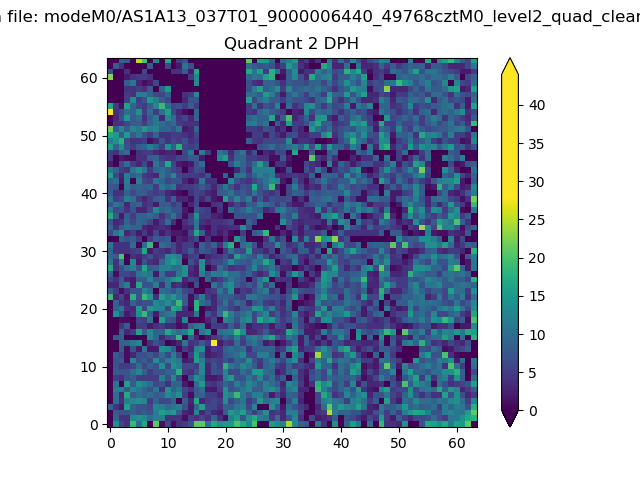
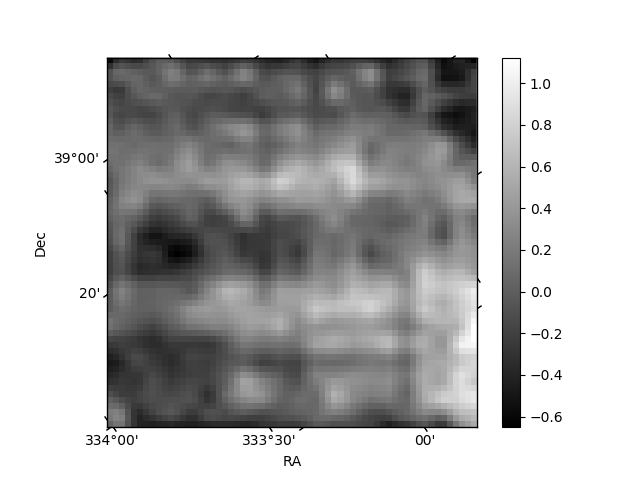
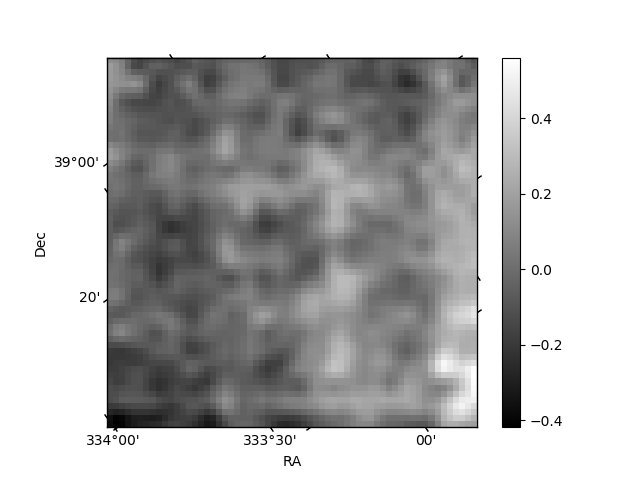
Histogram calculated using DETX and DETY for each event in the final _common_clean file
| Quadrant A | 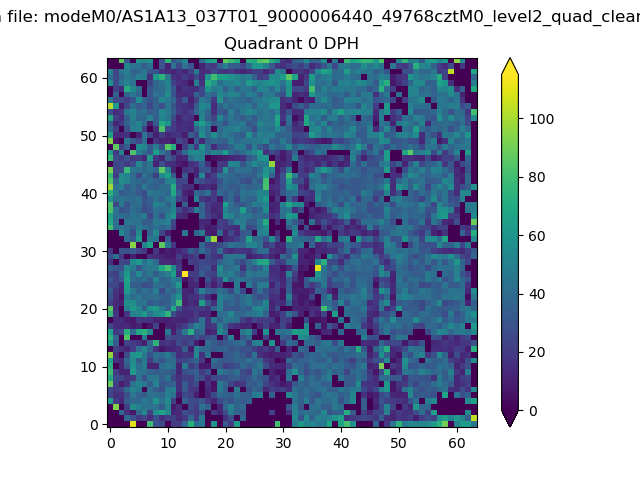 |
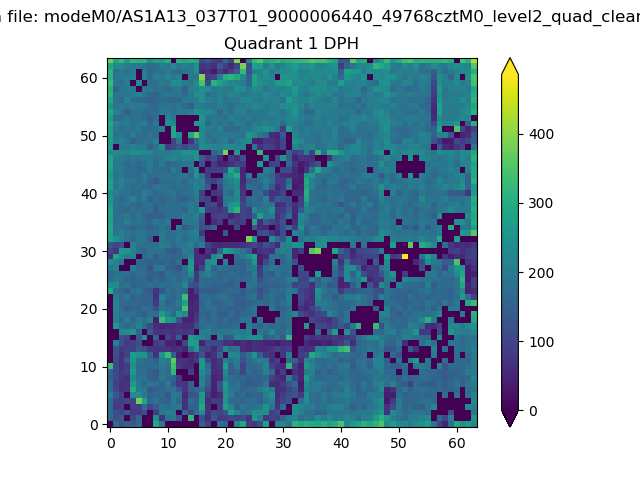 |
Quadrant B |
|---|---|---|---|
| Quadrant D | 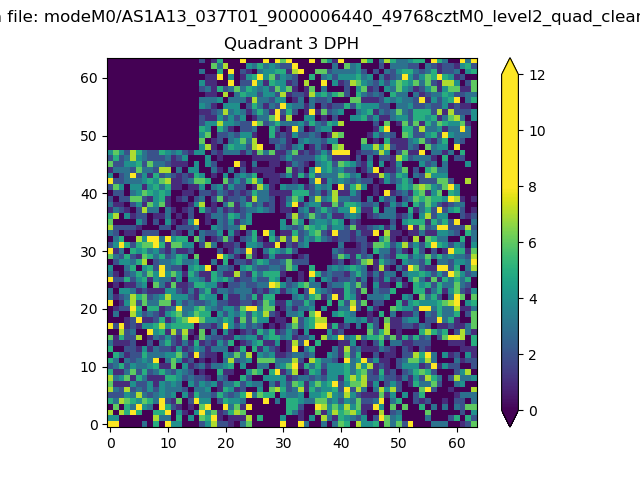 |
 |
Quadrant C |
| Plot type | Count rate plots | Images |
|---|---|---|
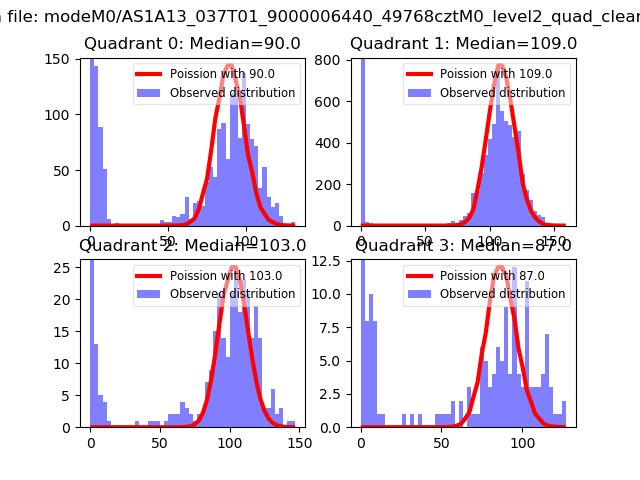
| Comparison with Poisson distribution Blue bars denote a histogram of data divided into 1 sec bins. Red curve is a Poisson curve with rate = median count rate of data. |
 |
 |
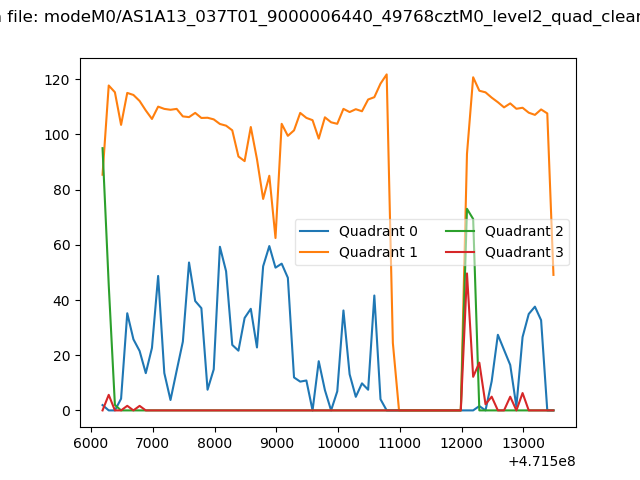
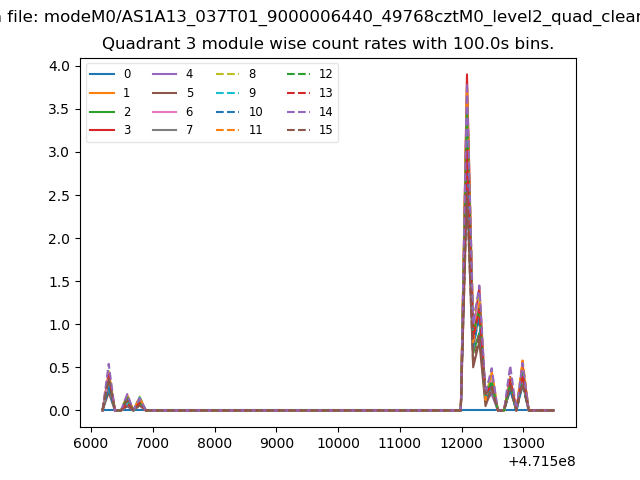
| Quadrant-wise count rates Data is divided into 100 sec bins |
 |
|
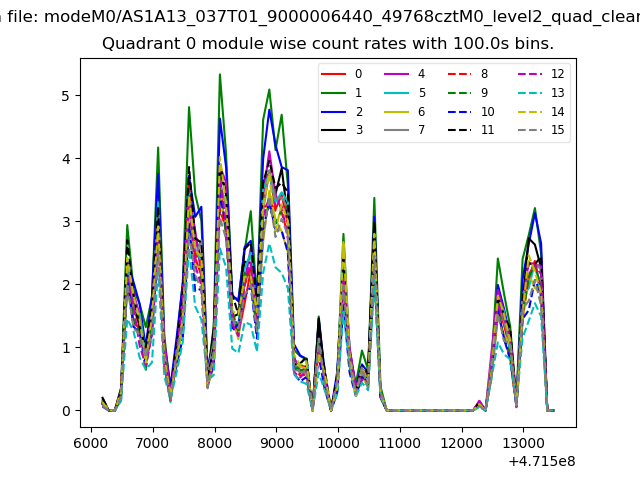
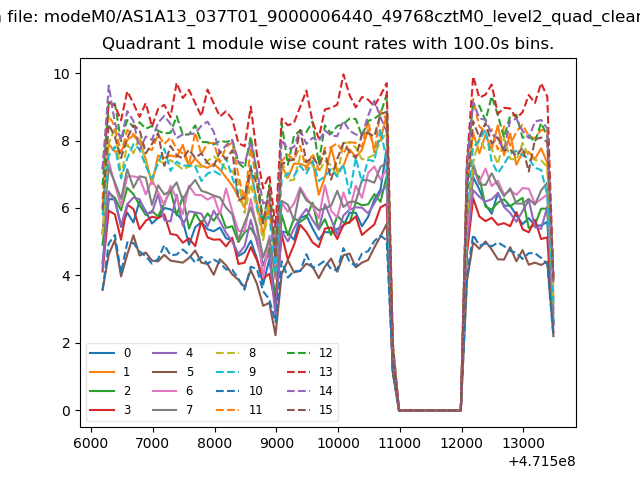
| Module-wise count rates for Quadrant A Data is divided into 100 sec bins |
 |
 |
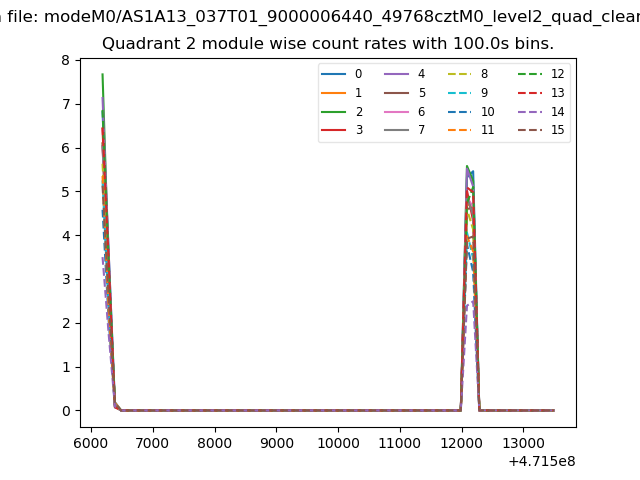
| Module-wise count rates for Quadrant B Data is divided into 100 sec bins |
 |
 |
| Module-wise count rates for Quadrant C Data is divided into 100 sec bins |
 |
 |
| Module-wise count rates for Quadrant D Data is divided into 100 sec bins |
 |
 |
| Parameter | Plot |
|---|---|
| CZT HV Monitor | 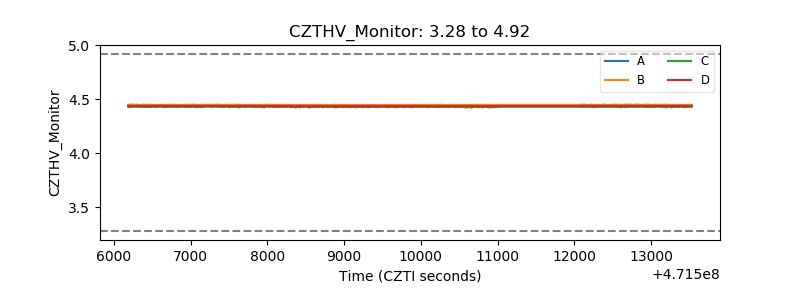 |
| D_VDD | 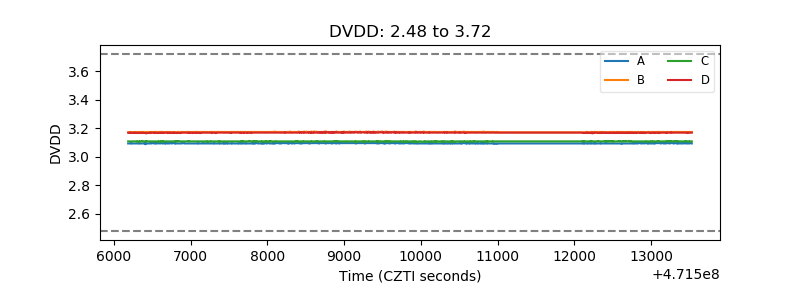 |
| Temperature 1 | 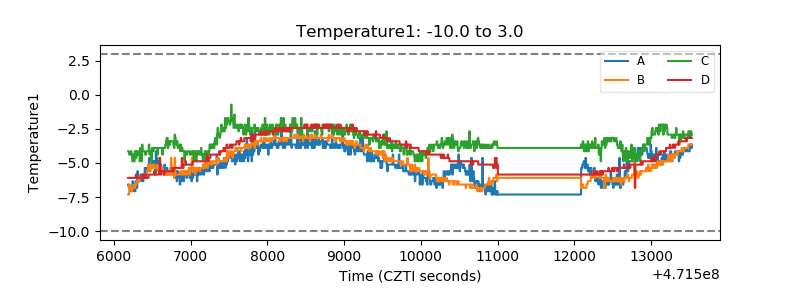 |
| Veto HV Monitor | 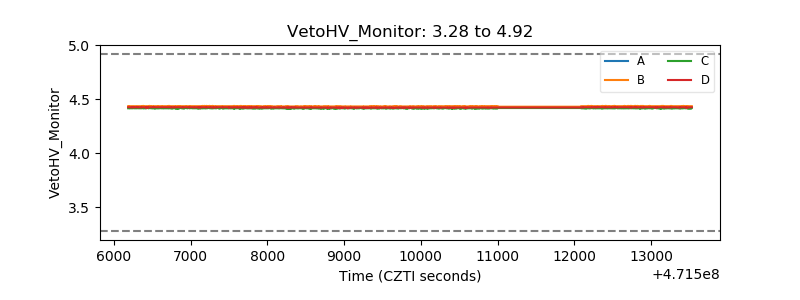 |
| Veto LLD | 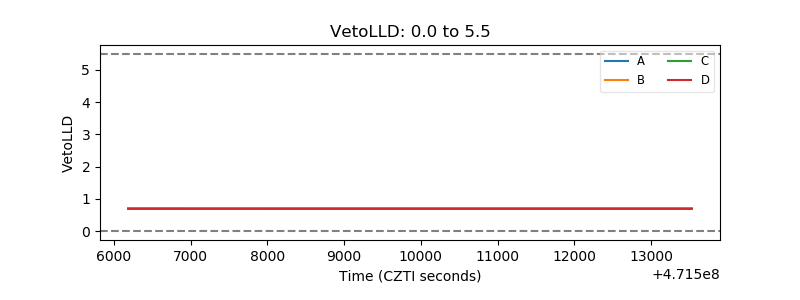 |
| Alpha Counter | 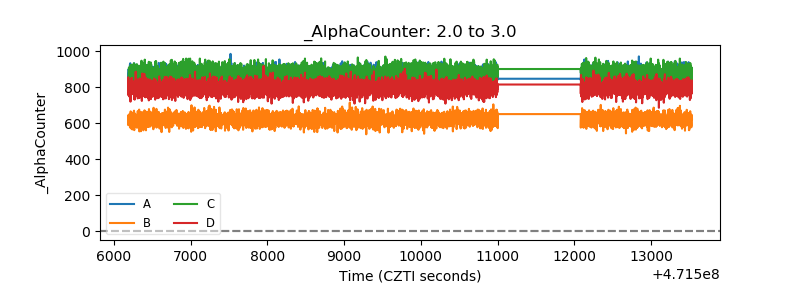 |
| _CPM_Rate | 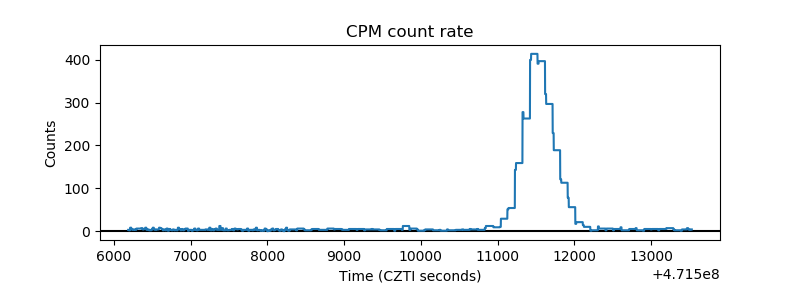 |
| CZT Counter | 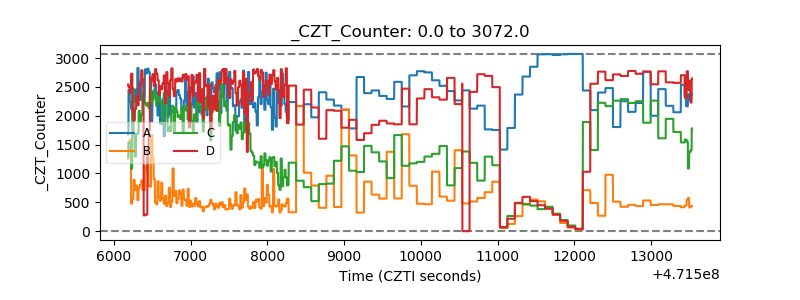 |
| +2.5 Volts monitor | 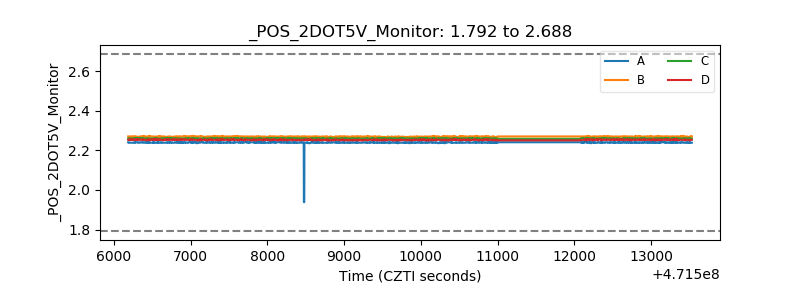 |
| +5 Volts monitor | 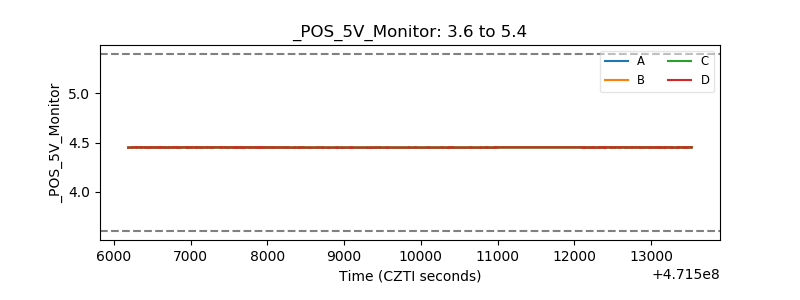 |
| _ROLL_ROT | 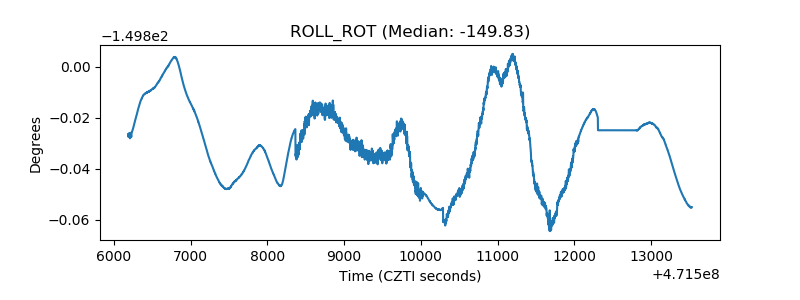 |
| _Roll_DEC | 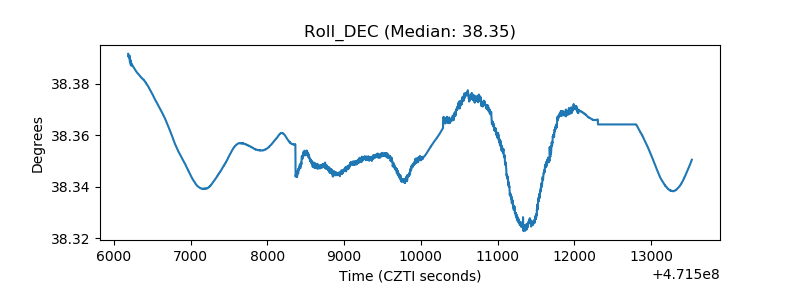 |
| _Roll_RA | 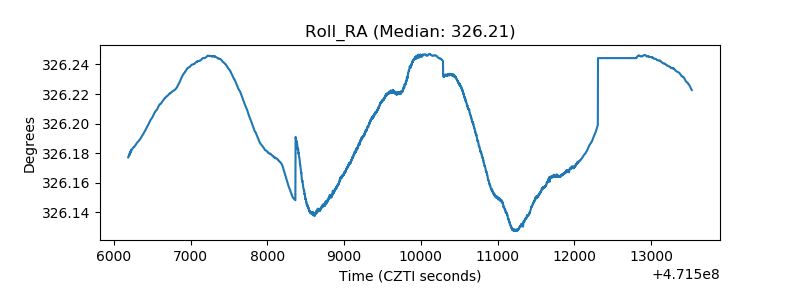 |
| Veto Counter | 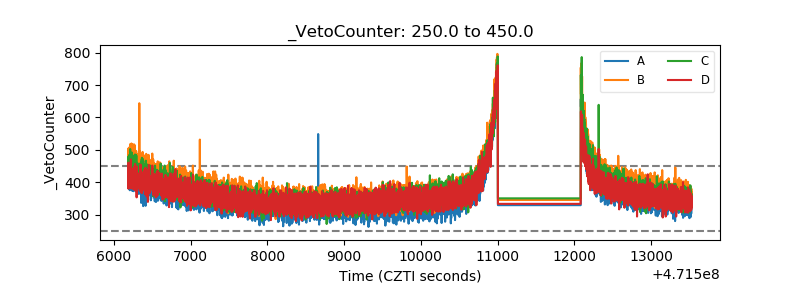 |