| Param | Original file | Final file |
|---|---|---|
| Filename | modeM0/AS1A13_037T01_9000006440_49770cztM0_level2.fits | modeM0/AS1A13_037T01_9000006440_49770cztM0_level2_quad_clean.evt |
| Size (bytes) | 1,202,074,560 | 55,298,880 |
| Size | 1.1 GB | 52.7 MB |
| Events in quadrant A | 10,163,881 | 430,057 |
| Events in quadrant B | 4,110,682 | 645,445 |
| Events in quadrant C | 14,008,404 | 89,895 |
| Events in quadrant D | 15,710,667 | 53,712 |
| Mode M9 | |||
|---|---|---|---|
| Quadrant | BADHDUFLAG | Total packets | Discarded packets |
| A | 0 | 6 | 0 |
| B | 0 | 6 | 0 |
| C | 0 | 6 | 0 |
| D | 0 | 6 | 0 |
| Mode SS | |||
|---|---|---|---|
| Quadrant | BADHDUFLAG | Total packets | Discarded packets |
| A | 0 | 130 | 0 |
| B | 0 | 130 | 0 |
| C | 0 | 130 | 0 |
| D | 0 | 130 | 0 |
| Mode M0 | |||
|---|---|---|---|
| Quadrant | BADHDUFLAG | Total packets | Discarded packets |
| A | 0 | 34791 | 1 |
| B | 0 | 16580 | 1 |
| C | 0 | 46092 | 1 |
| D | 0 | 51083 | 9 |
| Quadrant | Total seconds | Saturated seconds | Saturation percentage |
|---|---|---|---|
| A | 6527 | 2321 | 35.559982% |
| B | 6527 | 333 | 5.101884% |
| C | 6528 | 5698 | 87.285539% |
| D | 6527 | 6025 | 92.308871% |
Noise dominated data is calculated using 1-second bins in cleaned event files. If a bin has >2000 counts, and if more than 50% of those come from <1% of pixels, then it is considered to be noise-dominated and hence unusable.
| Quadrant | # 1 sec bins | Bins with >0 counts | Bins with >2000 counts | High rate bins dominated by noise | Noise dominated (total time) | Noise dominated (detector-on time) | Marked lightcurve |
|---|---|---|---|---|---|---|---|
| A | 7072 | 6528 | 1948 | 1948 | 27.55% | 29.84% | 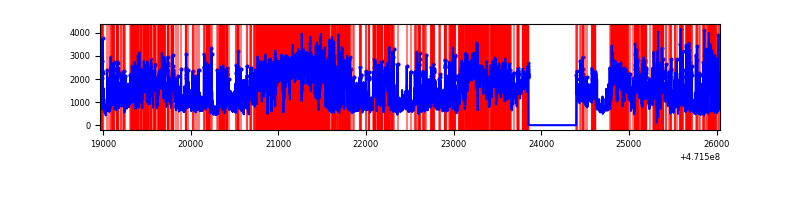 |
| B | 7072 | 6528 | 125 | 125 | 1.77% | 1.91% | 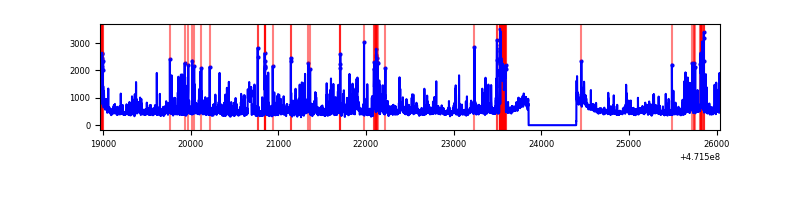 |
| C | 7073 | 6529 | 4519 | 4519 | 63.89% | 69.21% | 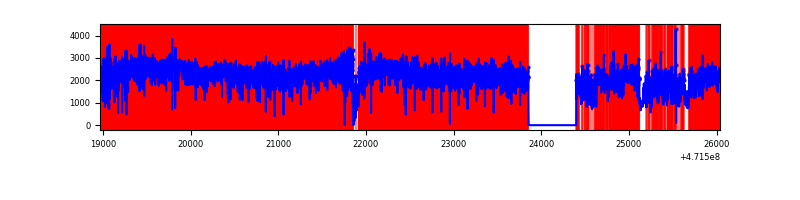 |
| D | 7073 | 6529 | 5537 | 5537 | 78.28% | 84.81% | 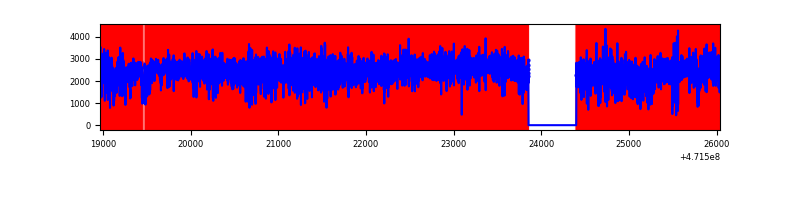 |
Top three noisy pixels from each quadrant. If the there are fewer than three noisy pixels in the level2.evt file, extra rows are filled as -1
| Pixel properties | Quadrant properties | ||||||
|---|---|---|---|---|---|---|---|
| Quadrant | DetID | PixID | Counts | Sigma | Mean | Median | Sigma |
| A | 12 | 50 | 1478512 | 9051.73 | 626 | 613 | 163.3 |
| A | 15 | 63 | 1158286 | 7090.43 | 626 | 613 | 163.3 |
| A | 3 | 99 | 994367 | 6086.48 | 626 | 613 | 163.3 |
| B | 4 | 206 | 186163 | 1244.16 | 698 | 678 | 149.1 |
| B | 10 | 44 | 127792 | 852.63 | 698 | 678 | 149.1 |
| B | 0 | 200 | 110553 | 737.0 | 698 | 678 | 149.1 |
| C | 1 | 23 | 3233688 | 37306.7 | 258 | 252 | 86.7 |
| C | 15 | 197 | 1973050 | 22761.73 | 258 | 252 | 86.7 |
| C | 15 | 174 | 1395118 | 16093.67 | 258 | 252 | 86.7 |
| D | 8 | 129 | 2800985 | 28085.63 | 308 | 294 | 99.7 |
| D | 7 | 61 | 2038519 | 20439.54 | 308 | 294 | 99.7 |
| D | 15 | 168 | 1990154 | 19954.53 | 308 | 294 | 99.7 |
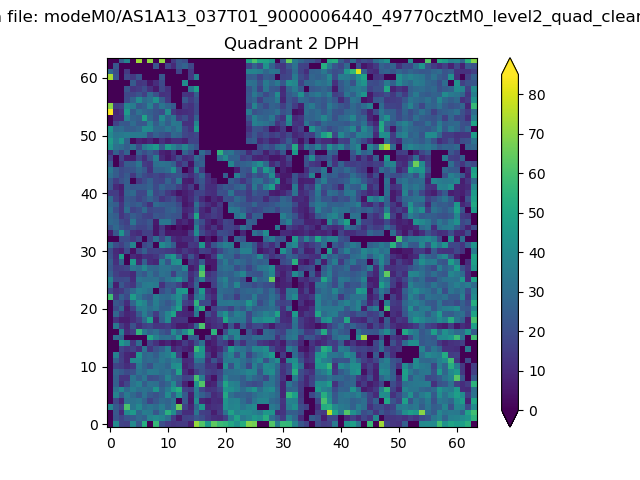
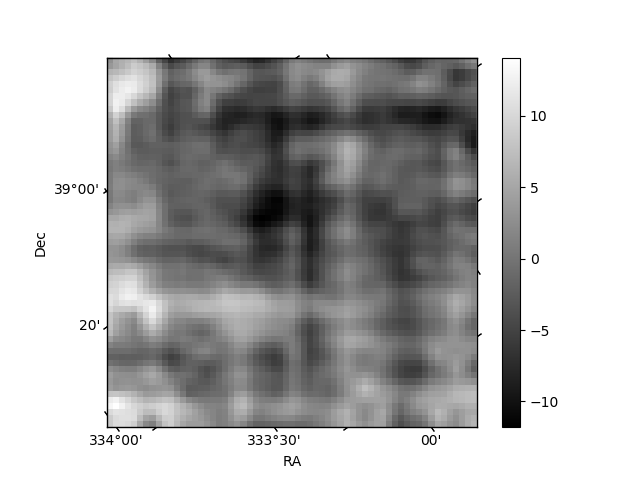
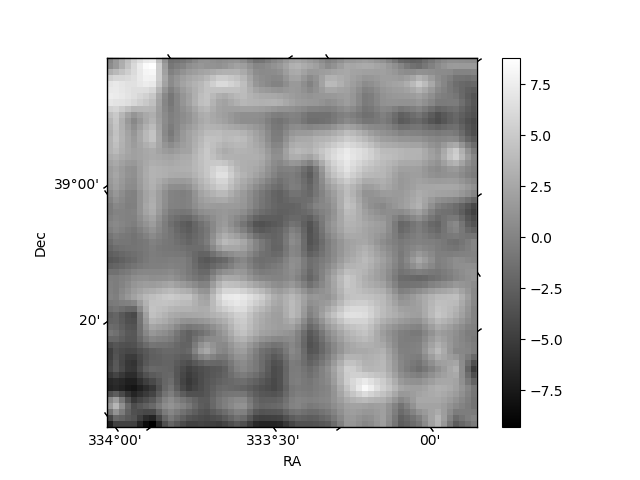
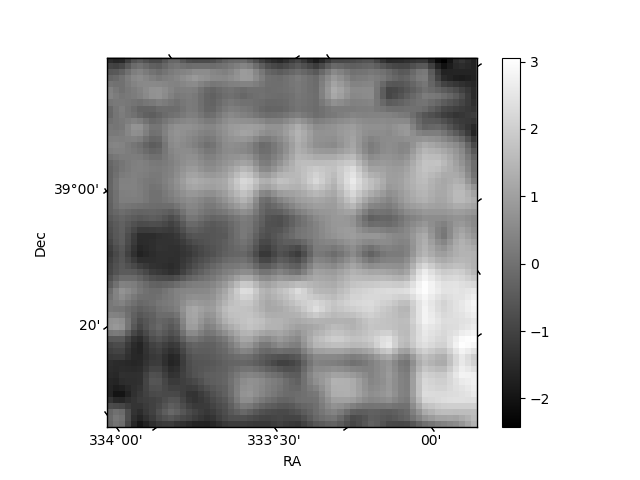
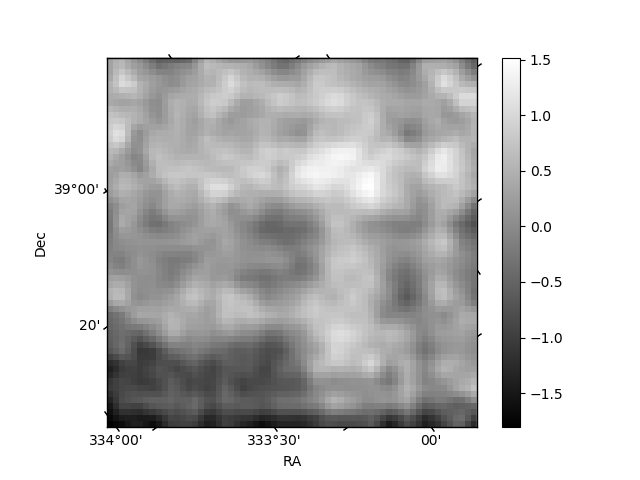
Histogram calculated using DETX and DETY for each event in the final _common_clean file
| Quadrant A | 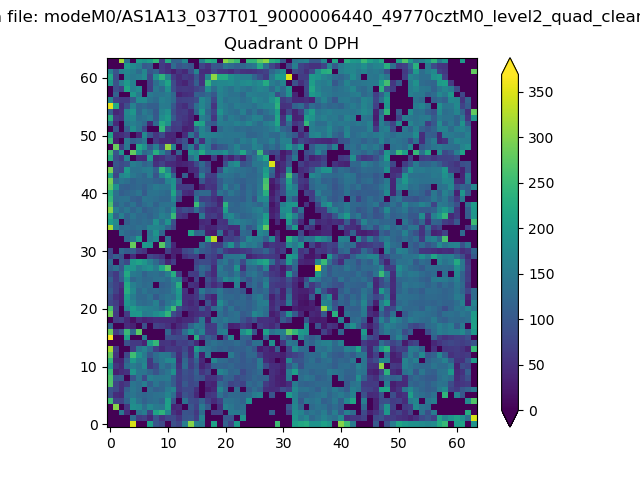 |
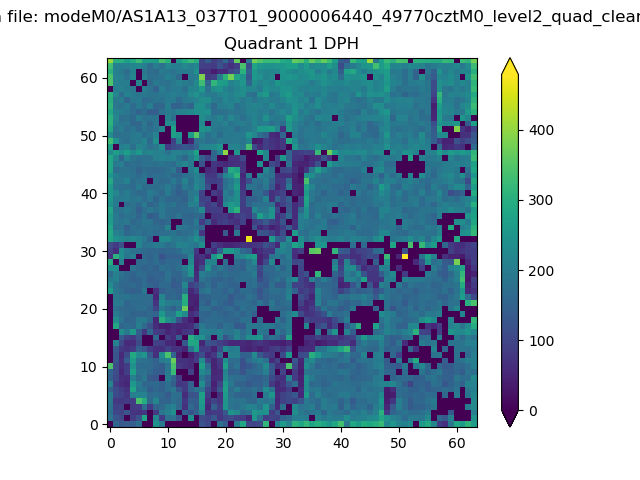 |
Quadrant B |
|---|---|---|---|
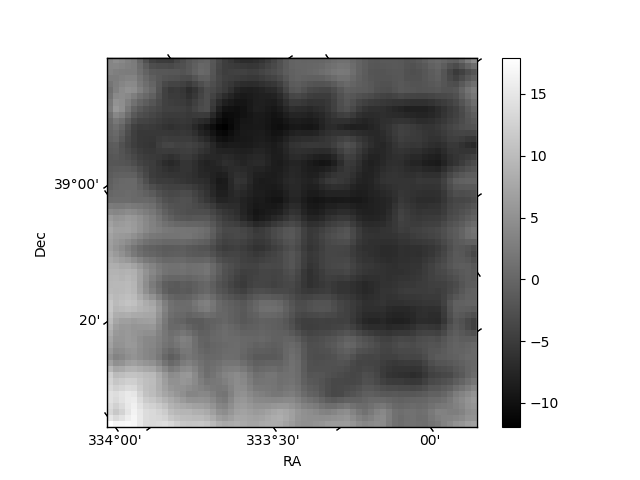
| Quadrant D | 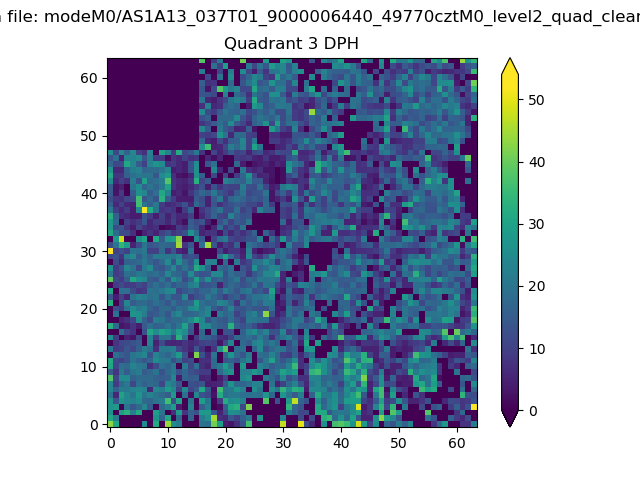 |
 |
Quadrant C |
| Plot type | Count rate plots | Images |
|---|---|---|
| Comparison with Poisson distribution Blue bars denote a histogram of data divided into 1 sec bins. Red curve is a Poisson curve with rate = median count rate of data. |
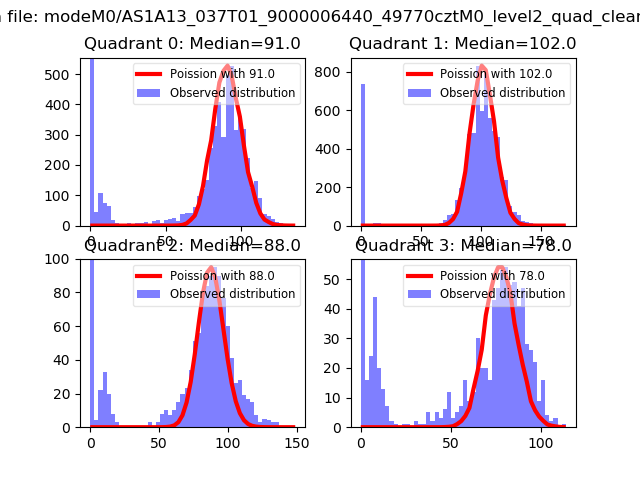 |
 |
| Quadrant-wise count rates Data is divided into 100 sec bins |
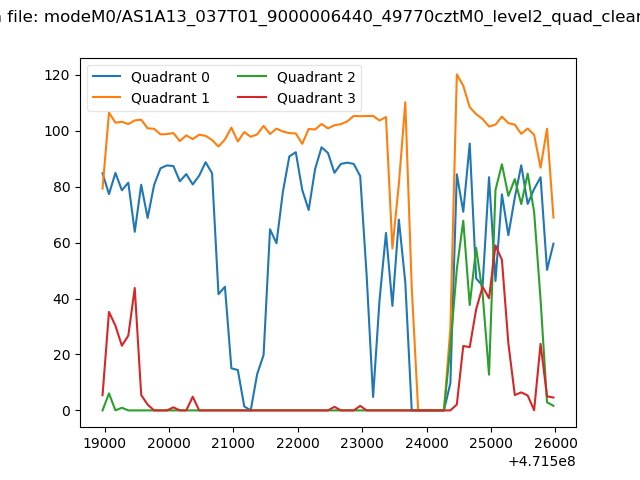 |
|
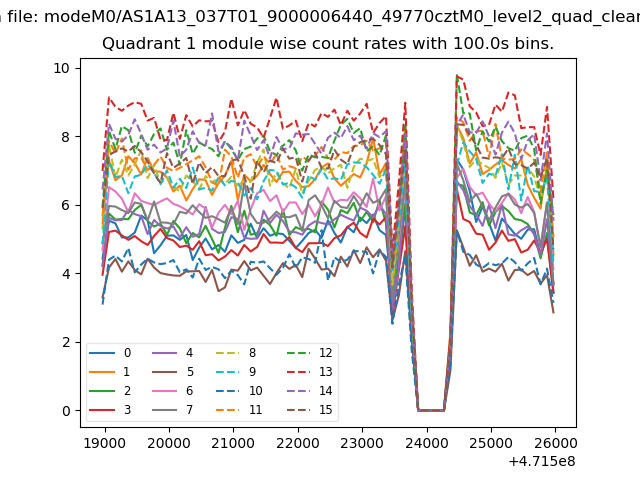
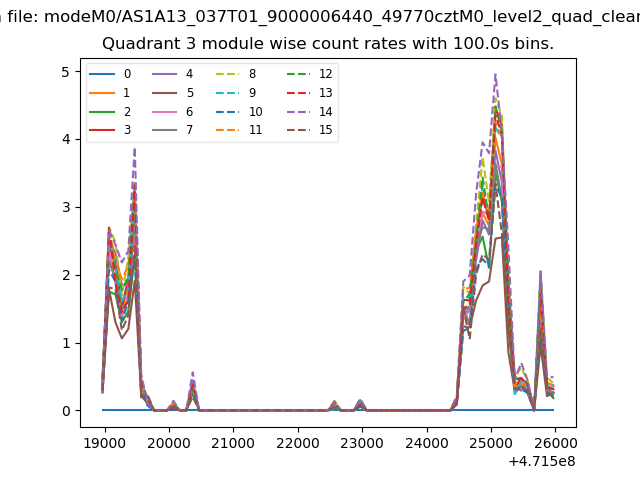
| Module-wise count rates for Quadrant A Data is divided into 100 sec bins |
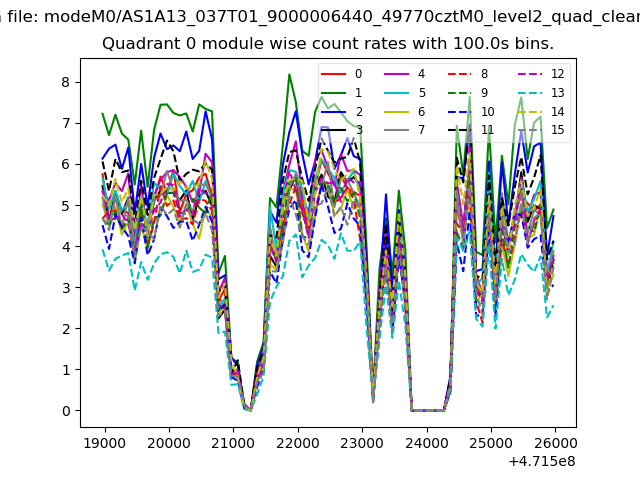 |
 |
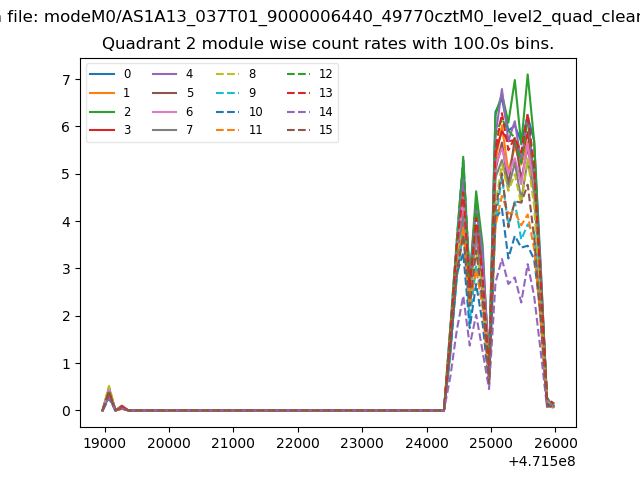
| Module-wise count rates for Quadrant B Data is divided into 100 sec bins |
 |
 |
| Module-wise count rates for Quadrant C Data is divided into 100 sec bins |
 |
 |
| Module-wise count rates for Quadrant D Data is divided into 100 sec bins |
 |
 |
| Parameter | Plot |
|---|---|
| CZT HV Monitor |  |
| D_VDD | 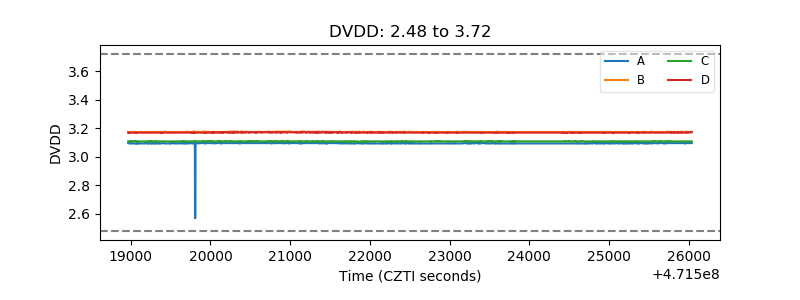 |
| Temperature 1 | 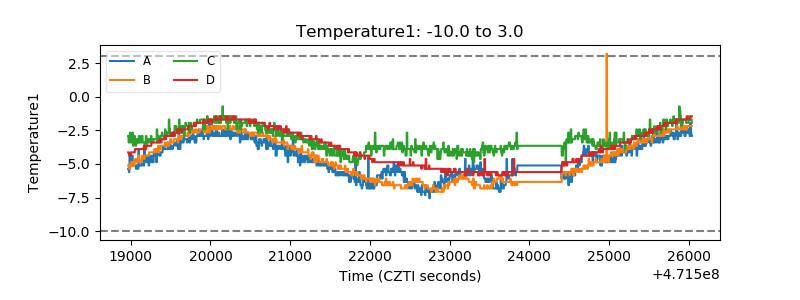 |
| Veto HV Monitor | 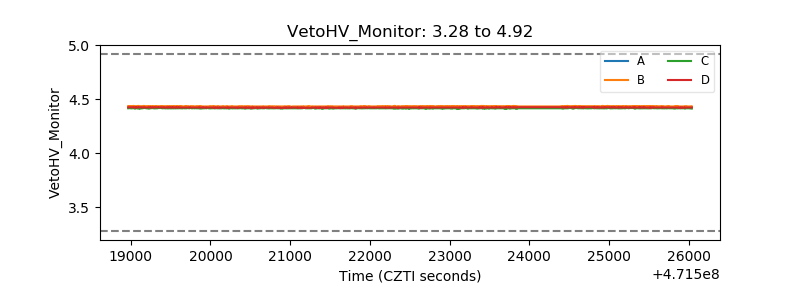 |
| Veto LLD | 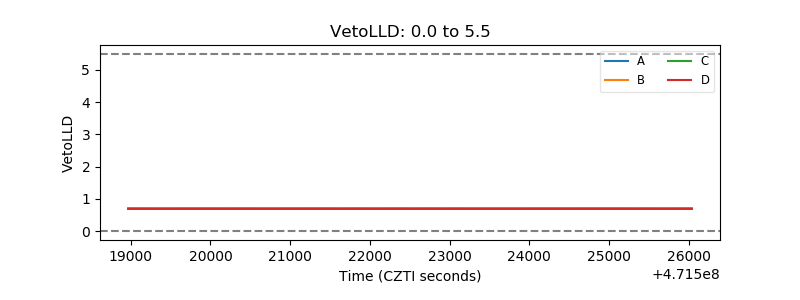 |
| Alpha Counter | 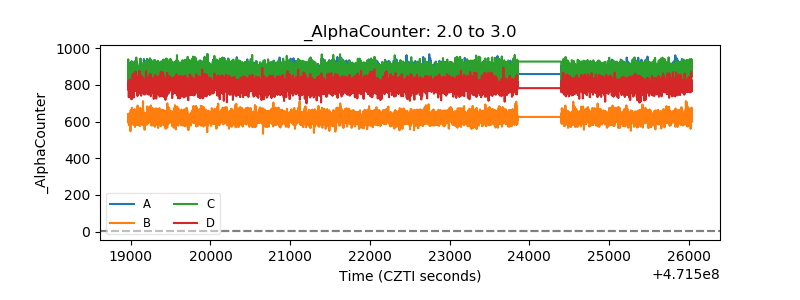 |
| _CPM_Rate | 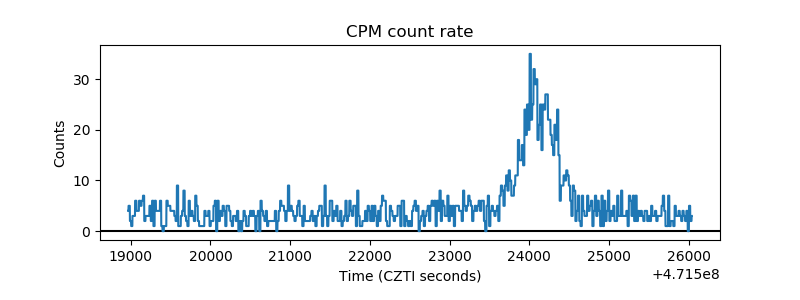 |
| CZT Counter | 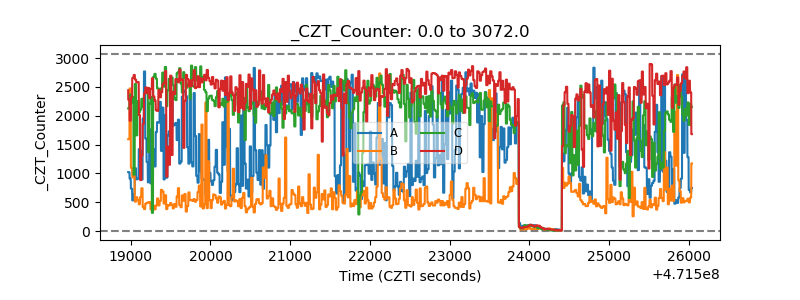 |
| +2.5 Volts monitor | 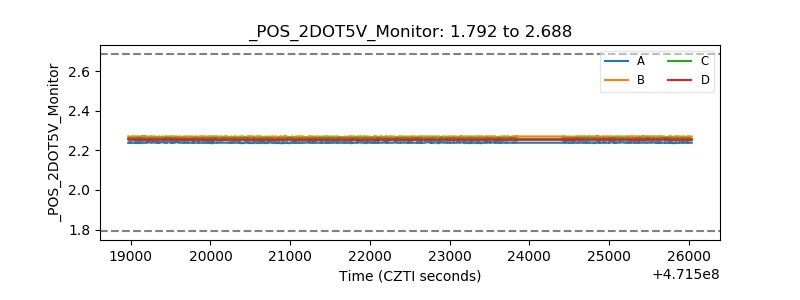 |
| +5 Volts monitor | 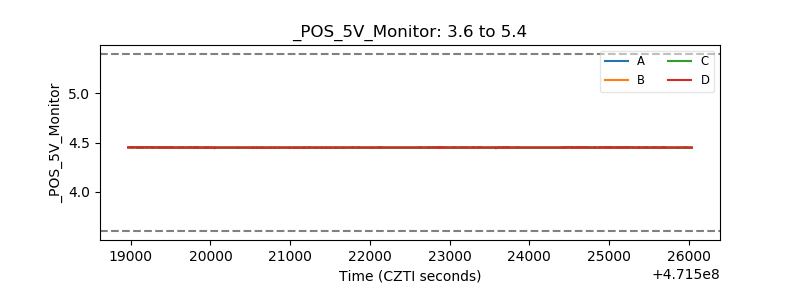 |
| _ROLL_ROT | 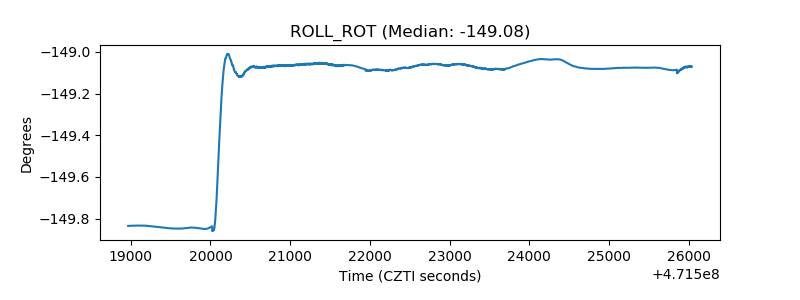 |
| _Roll_DEC | 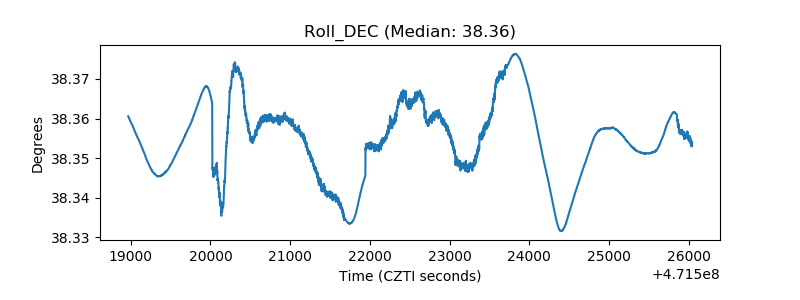 |
| _Roll_RA | 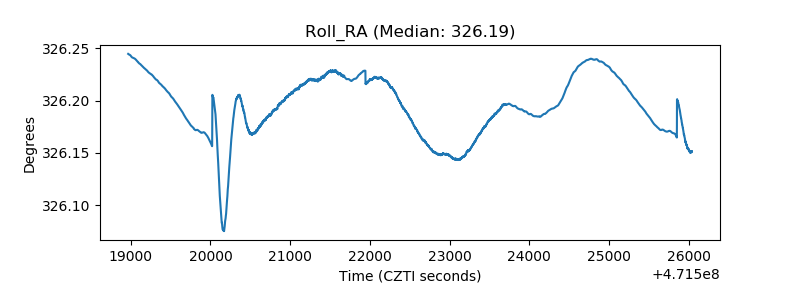 |
| Veto Counter | 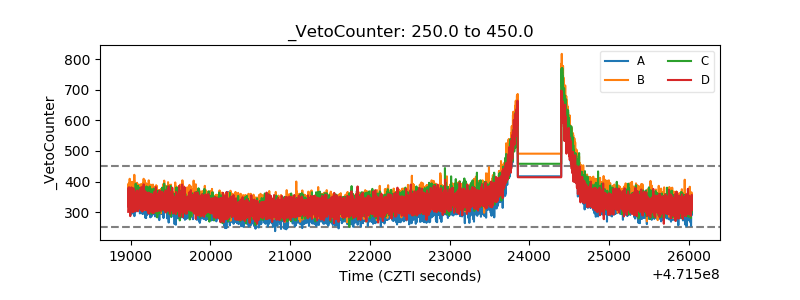 |