| Param | Original file | Final file |
|---|---|---|
| Filename | modeM0/AS1A13_037T01_9000006440_49771cztM0_level2.fits | modeM0/AS1A13_037T01_9000006440_49771cztM0_level2_quad_clean.evt |
| Size (bytes) | 1,388,162,880 | 53,559,360 |
| Size | 1.3 GB | 51.1 MB |
| Events in quadrant A | 14,022,613 | 310,667 |
| Events in quadrant B | 4,649,434 | 725,370 |
| Events in quadrant C | 15,067,752 | 59,740 |
| Events in quadrant D | 17,090,740 | 24,192 |
| Mode SS | |||
|---|---|---|---|
| Quadrant | BADHDUFLAG | Total packets | Discarded packets |
| A | 0 | 144 | 0 |
| B | 0 | 144 | 0 |
| C | 0 | 144 | 0 |
| D | 0 | 144 | 0 |
| Mode M0 | |||
|---|---|---|---|
| Quadrant | BADHDUFLAG | Total packets | Discarded packets |
| A | 0 | 46653 | 0 |
| B | 0 | 18708 | 0 |
| C | 0 | 49629 | 1 |
| D | 0 | 55616 | 0 |
| Quadrant | Total seconds | Saturated seconds | Saturation percentage |
|---|---|---|---|
| A | 7201 | 4172 | 57.936398% |
| B | 7202 | 237 | 3.290753% |
| C | 7201 | 6608 | 91.765033% |
| D | 7201 | 6973 | 96.833773% |
Noise dominated data is calculated using 1-second bins in cleaned event files. If a bin has >2000 counts, and if more than 50% of those come from <1% of pixels, then it is considered to be noise-dominated and hence unusable.
| Quadrant | # 1 sec bins | Bins with >0 counts | Bins with >2000 counts | High rate bins dominated by noise | Noise dominated (total time) | Noise dominated (detector-on time) | Marked lightcurve |
|---|---|---|---|---|---|---|---|
| A | 7201 | 7200 | 3841 | 3841 | 53.34% | 53.35% | 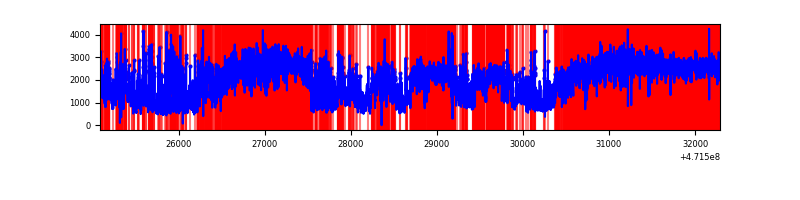 |
| B | 7202 | 7202 | 136 | 136 | 1.89% | 1.89% | 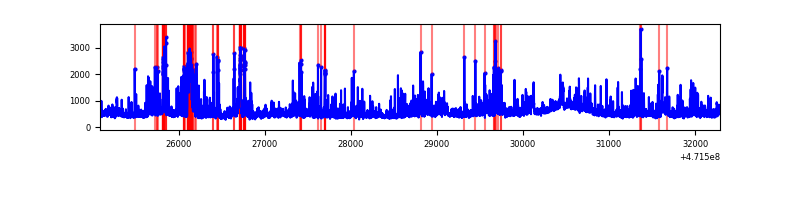 |
| C | 7201 | 7201 | 4372 | 4372 | 60.71% | 60.71% | 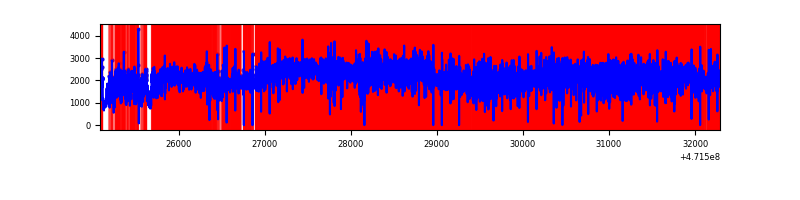 |
| D | 7200 | 7200 | 5642 | 5642 | 78.36% | 78.36% | 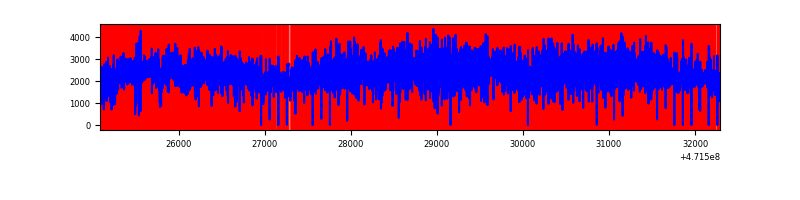 |
Top three noisy pixels from each quadrant. If the there are fewer than three noisy pixels in the level2.evt file, extra rows are filled as -1
| Pixel properties | Quadrant properties | ||||||
|---|---|---|---|---|---|---|---|
| Quadrant | DetID | PixID | Counts | Sigma | Mean | Median | Sigma |
| A | 0 | 98 | 3356935 | 21811.75 | 570 | 554 | 153.9 |
| A | 12 | 50 | 2272634 | 14765.32 | 570 | 554 | 153.9 |
| A | 3 | 99 | 1272683 | 8267.05 | 570 | 554 | 153.9 |
| B | 0 | 200 | 208958 | 1227.67 | 778 | 752 | 169.6 |
| B | 10 | 28 | 148230 | 869.59 | 778 | 752 | 169.6 |
| B | 4 | 21 | 125297 | 734.37 | 778 | 752 | 169.6 |
| C | 15 | 174 | 2775834 | 36349.73 | 227 | 224 | 76.4 |
| C | 15 | 197 | 2572980 | 33693.13 | 227 | 224 | 76.4 |
| C | 15 | 196 | 1576860 | 20647.82 | 227 | 224 | 76.4 |
| D | 15 | 142 | 4086917 | 53312.26 | 196 | 186 | 76.7 |
| D | 8 | 129 | 4021558 | 52459.64 | 196 | 186 | 76.7 |
| D | 15 | 168 | 2329598 | 30387.67 | 196 | 186 | 76.7 |
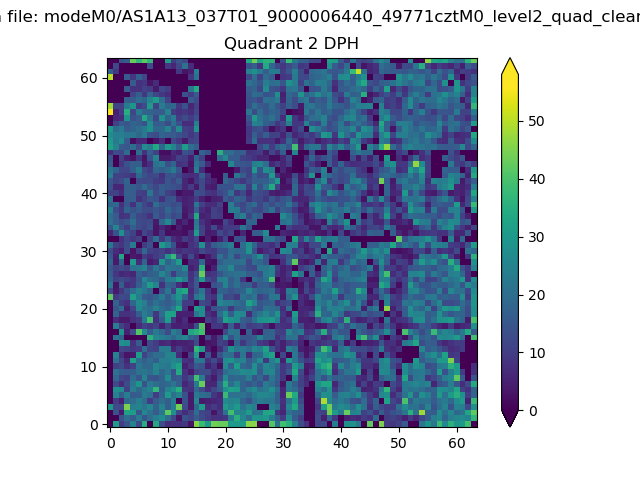
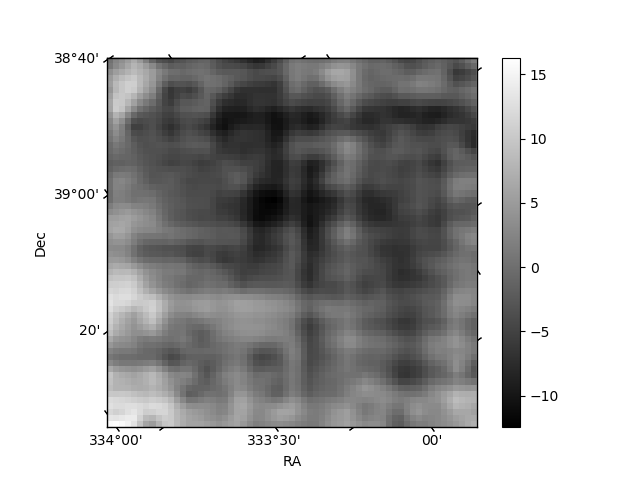
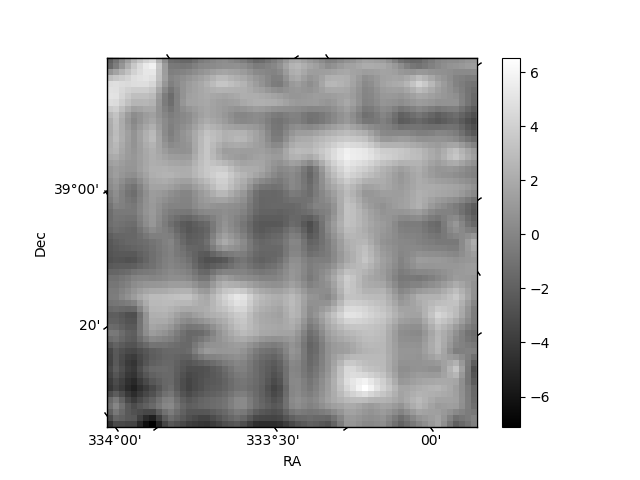
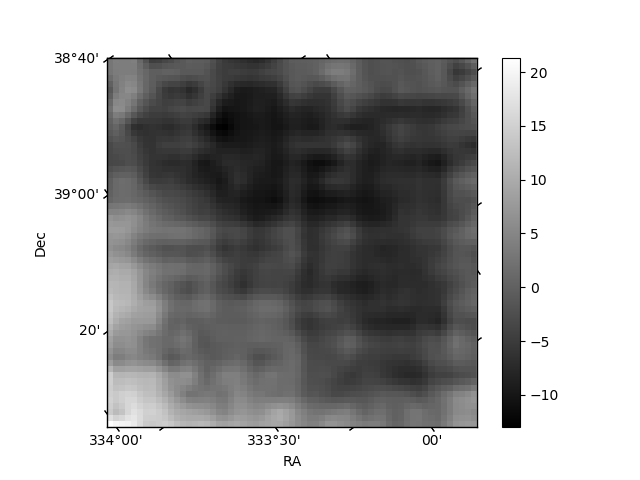
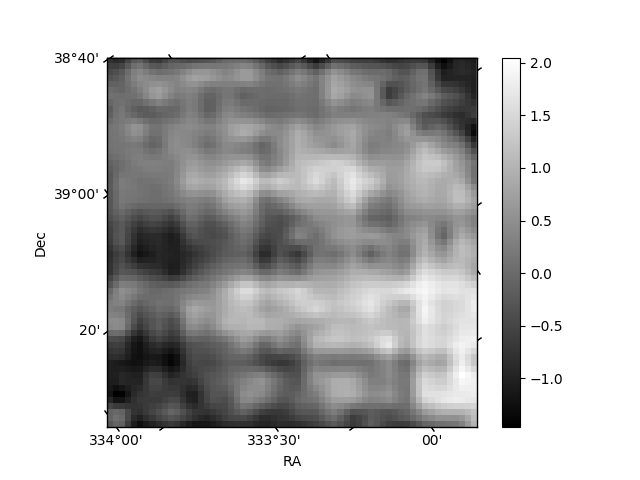
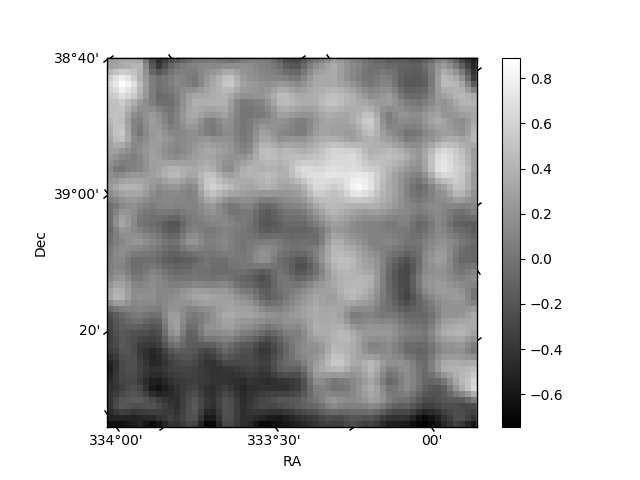
Histogram calculated using DETX and DETY for each event in the final _common_clean file
| Quadrant A | 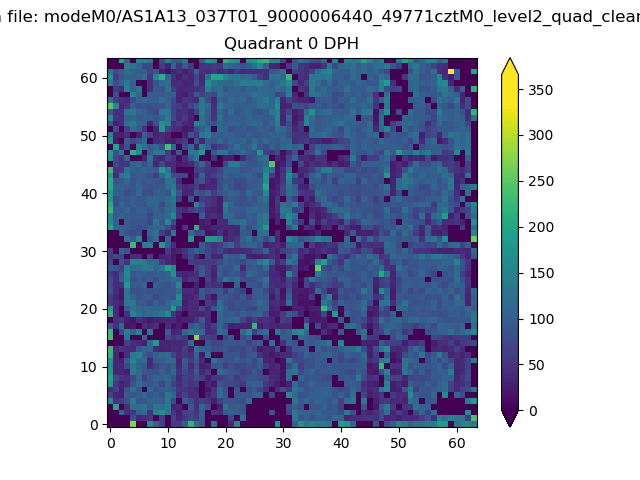 |
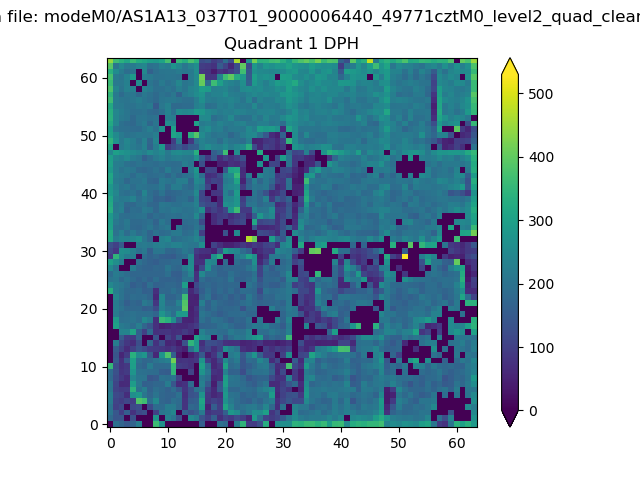 |
Quadrant B |
|---|---|---|---|
| Quadrant D | 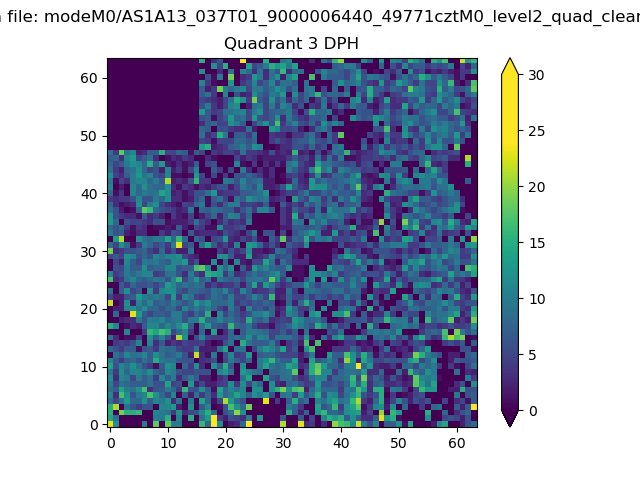 |
 |
Quadrant C |
| Plot type | Count rate plots | Images |
|---|---|---|
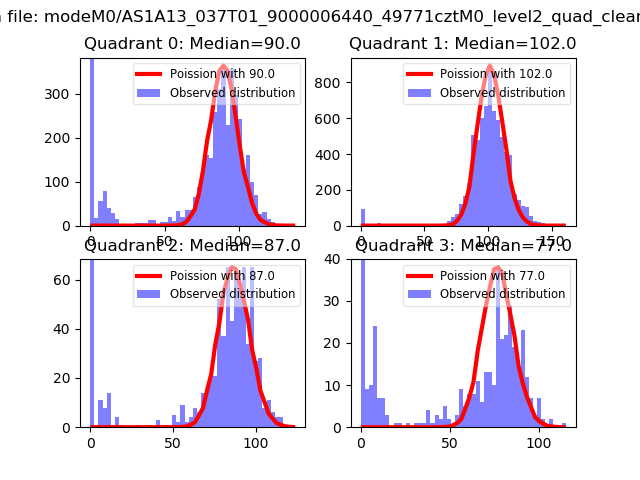
| Comparison with Poisson distribution Blue bars denote a histogram of data divided into 1 sec bins. Red curve is a Poisson curve with rate = median count rate of data. |
 |
 |
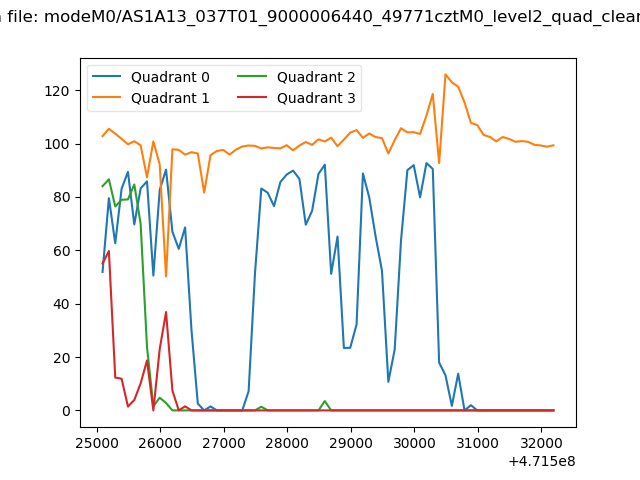
| Quadrant-wise count rates Data is divided into 100 sec bins |
 |
|
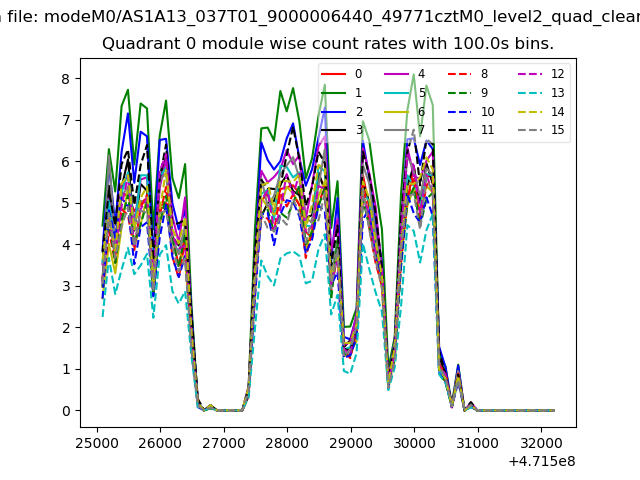
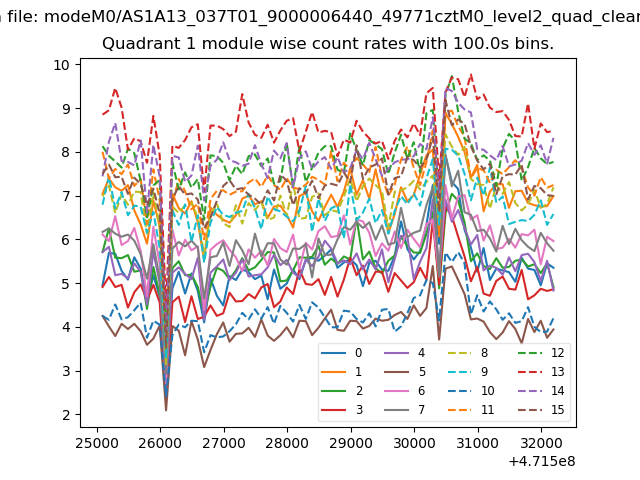
| Module-wise count rates for Quadrant A Data is divided into 100 sec bins |
 |
 |
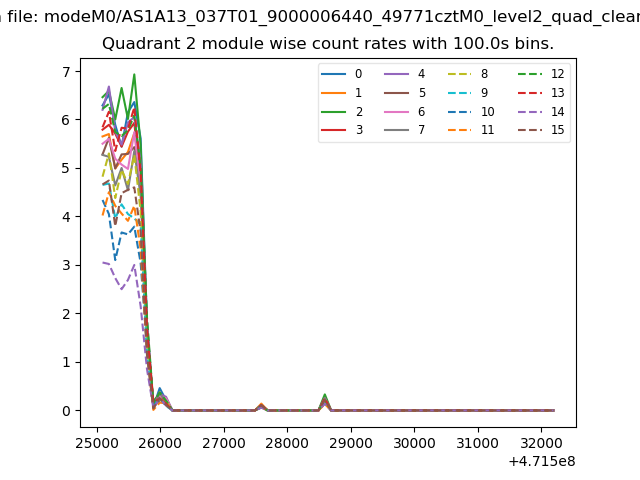
| Module-wise count rates for Quadrant B Data is divided into 100 sec bins |
 |
 |
| Module-wise count rates for Quadrant C Data is divided into 100 sec bins |
 |
 |
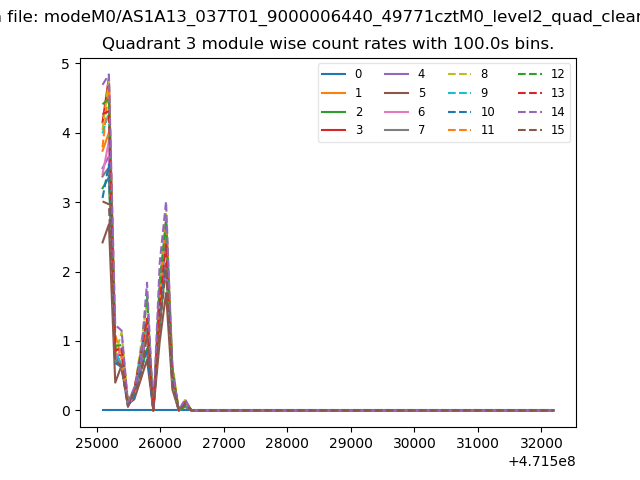
| Module-wise count rates for Quadrant D Data is divided into 100 sec bins |
 |
 |
| Parameter | Plot |
|---|---|
| CZT HV Monitor | 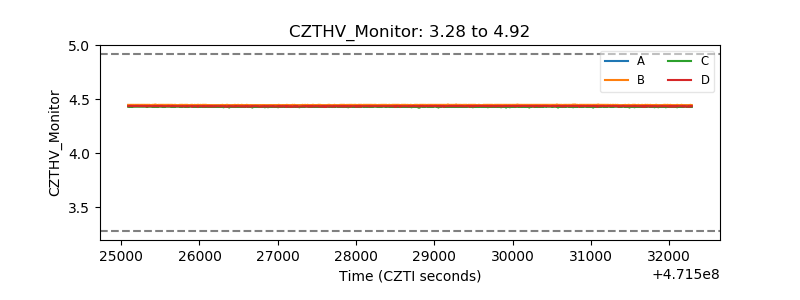 |
| D_VDD | 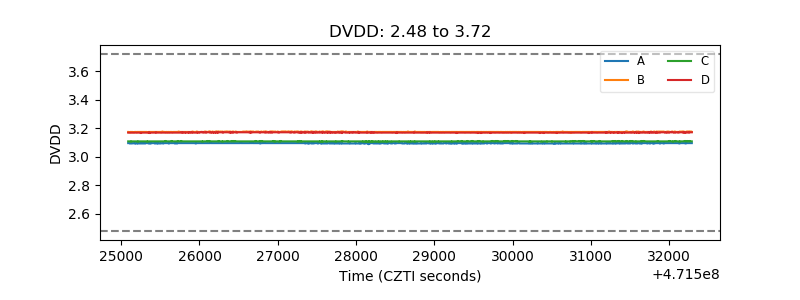 |
| Temperature 1 | 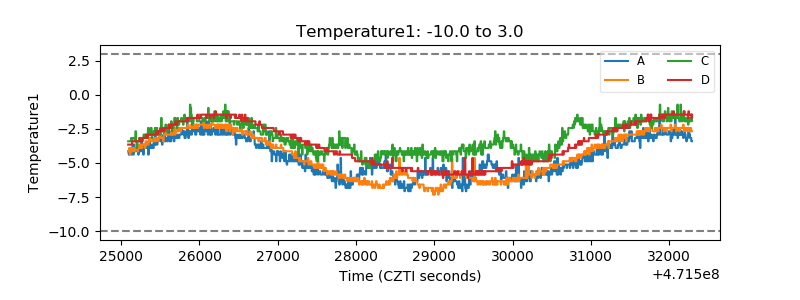 |
| Veto HV Monitor | 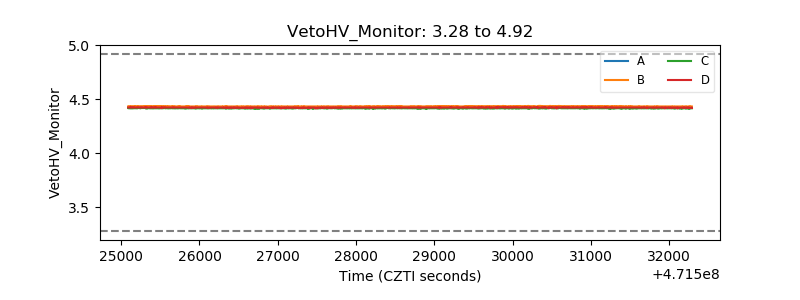 |
| Veto LLD | 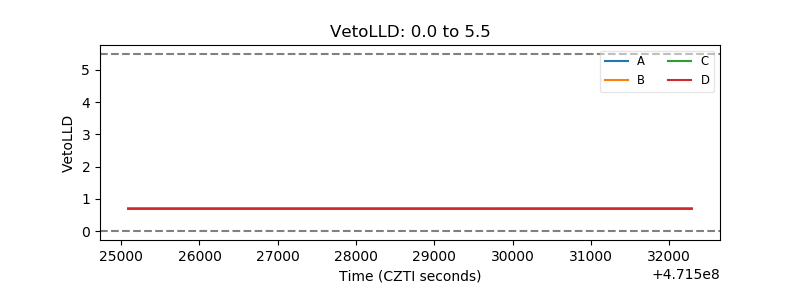 |
| Alpha Counter | 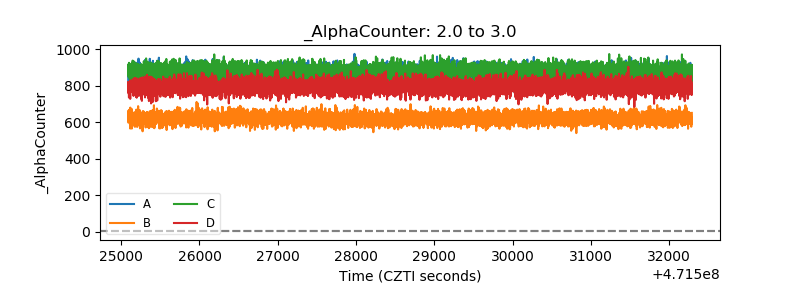 |
| _CPM_Rate | 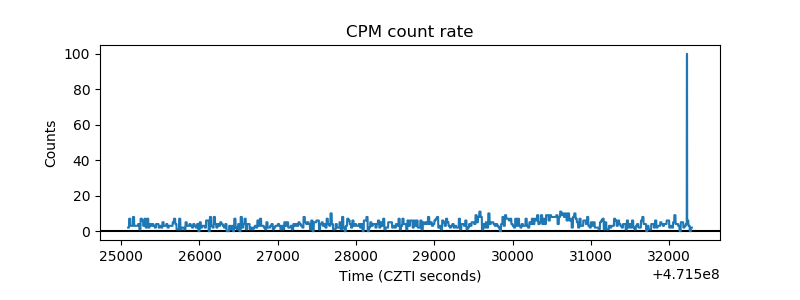 |
| CZT Counter | 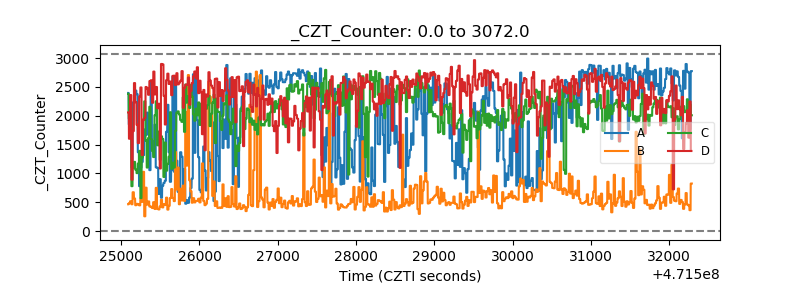 |
| +2.5 Volts monitor | 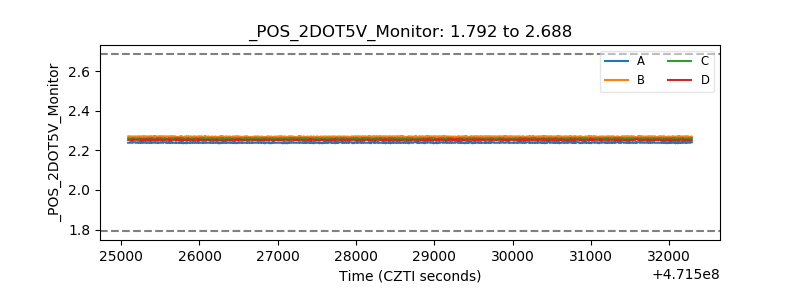 |
| +5 Volts monitor | 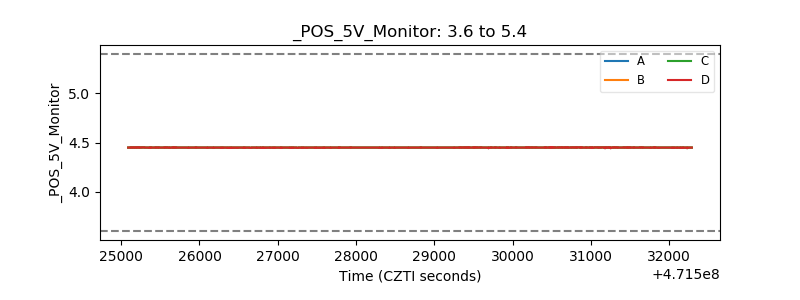 |
| _ROLL_ROT | 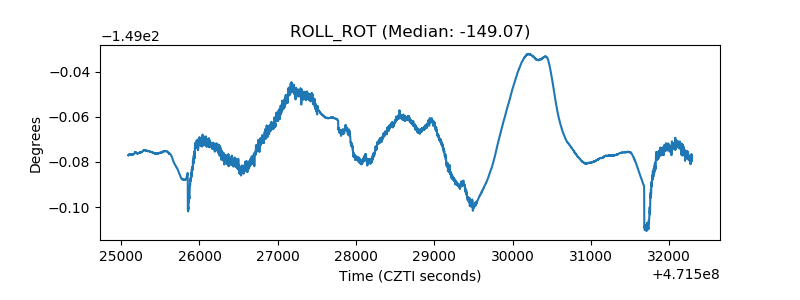 |
| _Roll_DEC | 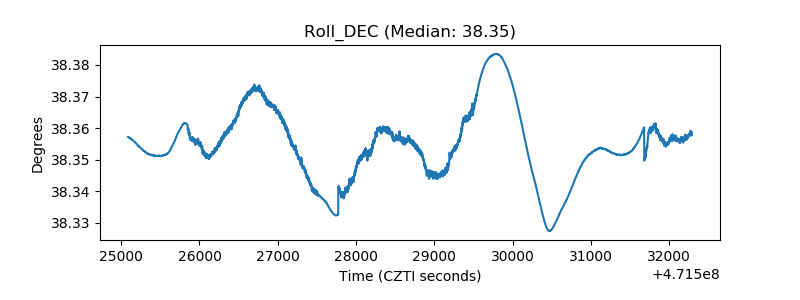 |
| _Roll_RA | 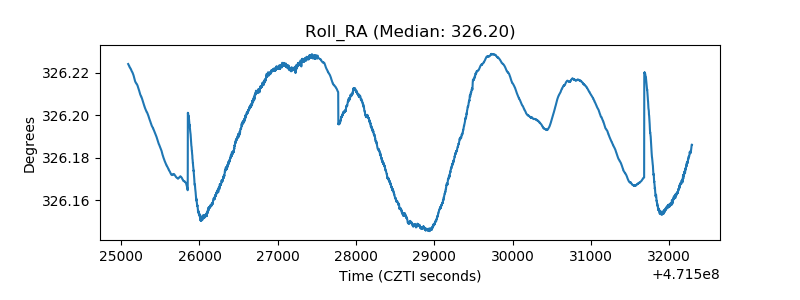 |
| Veto Counter | 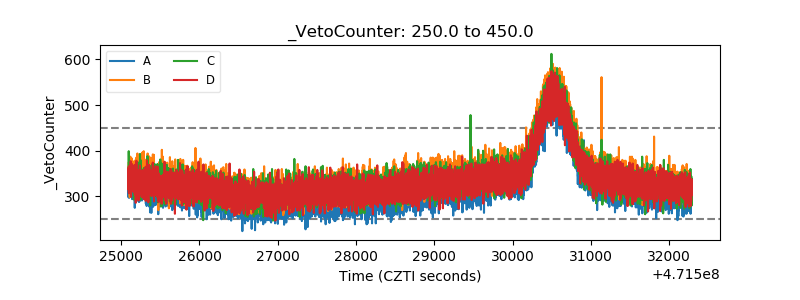 |