| Param | Original file | Final file |
|---|---|---|
| Filename | modeM0/AS1A13_037T01_9000006440_49772cztM0_level2.fits | modeM0/AS1A13_037T01_9000006440_49772cztM0_level2_quad_clean.evt |
| Size (bytes) | 1,499,178,240 | 56,802,240 |
| Size | 1.4 GB | 54.2 MB |
| Events in quadrant A | 18,374,060 | 335,116 |
| Events in quadrant B | 5,388,494 | 743,205 |
| Events in quadrant C | 15,104,059 | 60,844 |
| Events in quadrant D | 16,051,476 | 50,350 |
| Mode SS | |||
|---|---|---|---|
| Quadrant | BADHDUFLAG | Total packets | Discarded packets |
| A | 0 | 148 | 0 |
| B | 0 | 148 | 0 |
| C | 0 | 148 | 0 |
| D | 0 | 148 | 0 |
| Mode M0 | |||
|---|---|---|---|
| Quadrant | BADHDUFLAG | Total packets | Discarded packets |
| A | 0 | 59726 | 0 |
| B | 0 | 21026 | 0 |
| C | 0 | 49992 | 0 |
| D | 0 | 52864 | 0 |
| Quadrant | Total seconds | Saturated seconds | Saturation percentage |
|---|---|---|---|
| A | 7476 | 6647 | 88.911182% |
| B | 7476 | 287 | 3.838951% |
| C | 7476 | 7476 | 100.000000% |
| D | 7475 | 7475 | 100.000000% |
Noise dominated data is calculated using 1-second bins in cleaned event files. If a bin has >2000 counts, and if more than 50% of those come from <1% of pixels, then it is considered to be noise-dominated and hence unusable.
| Quadrant | # 1 sec bins | Bins with >0 counts | Bins with >2000 counts | High rate bins dominated by noise | Noise dominated (total time) | Noise dominated (detector-on time) | Marked lightcurve |
|---|---|---|---|---|---|---|---|
| A | 7476 | 7476 | 6406 | 6406 | 85.69% | 85.69% | 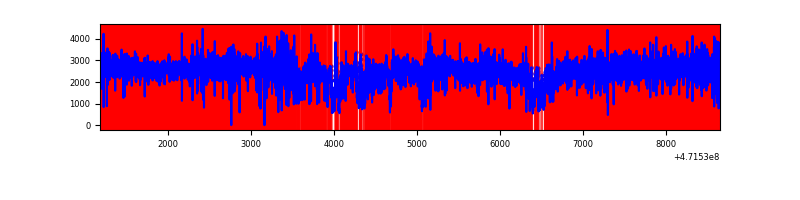 |
| B | 7476 | 7476 | 183 | 183 | 2.45% | 2.45% | 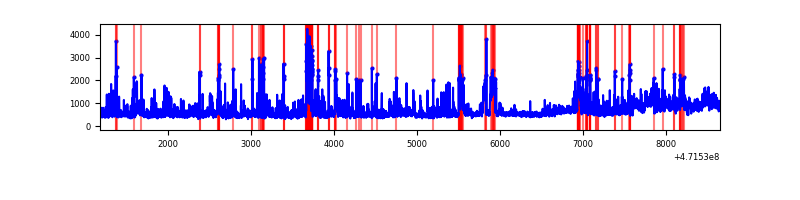 |
| C | 7475 | 7475 | 3938 | 3938 | 52.68% | 52.68% | 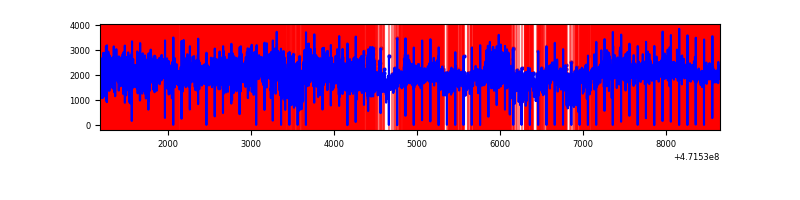 |
| D | 7474 | 7474 | 4692 | 4692 | 62.78% | 62.78% | 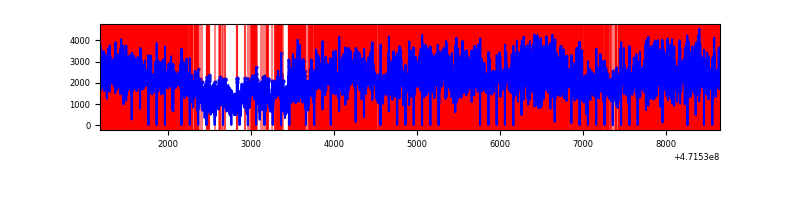 |
Top three noisy pixels from each quadrant. If the there are fewer than three noisy pixels in the level2.evt file, extra rows are filled as -1
| Pixel properties | Quadrant properties | ||||||
|---|---|---|---|---|---|---|---|
| Quadrant | DetID | PixID | Counts | Sigma | Mean | Median | Sigma |
| A | 0 | 98 | 8632832 | 70985.77 | 400 | 386 | 121.6 |
| A | 12 | 50 | 3263548 | 26833.42 | 400 | 386 | 121.6 |
| A | 4 | 205 | 730587 | 6004.54 | 400 | 386 | 121.6 |
| B | 5 | 172 | 468021 | 2828.0 | 776 | 751 | 165.2 |
| B | 0 | 229 | 276533 | 1669.08 | 776 | 751 | 165.2 |
| B | 5 | 185 | 176938 | 1066.31 | 776 | 751 | 165.2 |
| C | 15 | 197 | 3734957 | 77446.0 | 87 | 83 | 48.2 |
| C | 15 | 174 | 2250954 | 46673.85 | 87 | 83 | 48.2 |
| C | 15 | 214 | 1757446 | 36440.52 | 87 | 83 | 48.2 |
| D | 8 | 129 | 4815240 | 85818.78 | 83 | 75 | 56.1 |
| D | 15 | 142 | 3717056 | 66246.28 | 83 | 75 | 56.1 |
| D | 15 | 168 | 1919501 | 34209.17 | 83 | 75 | 56.1 |
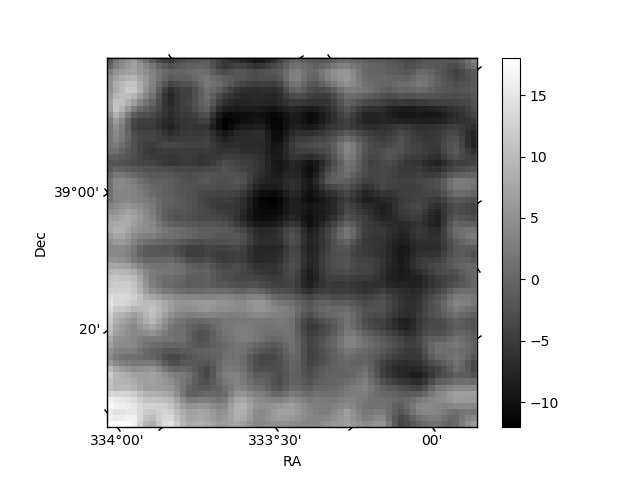
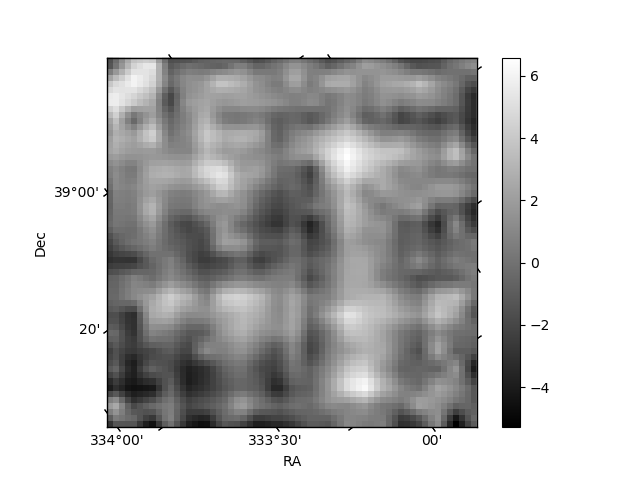
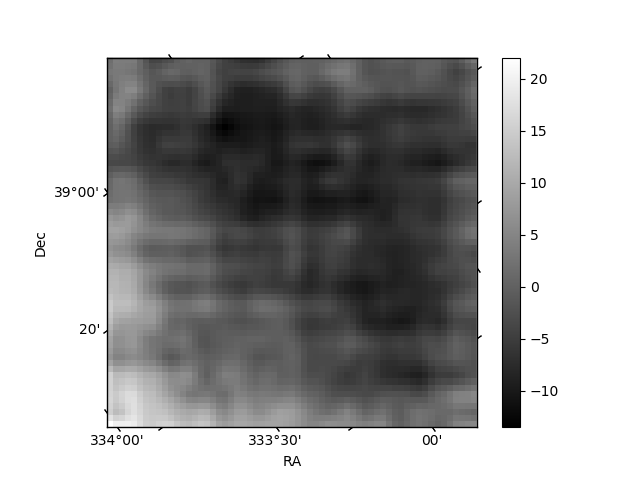
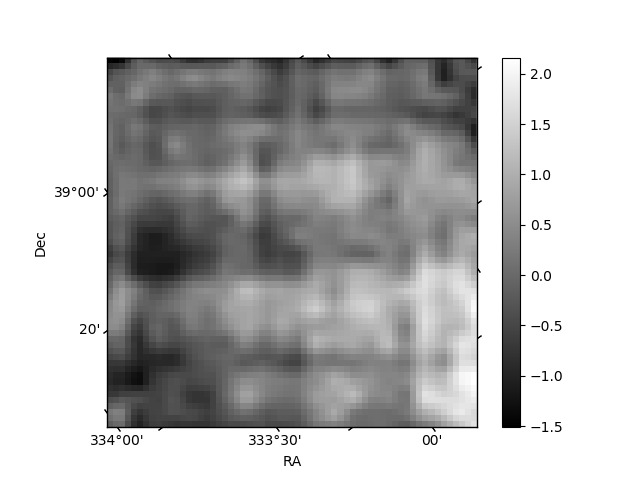
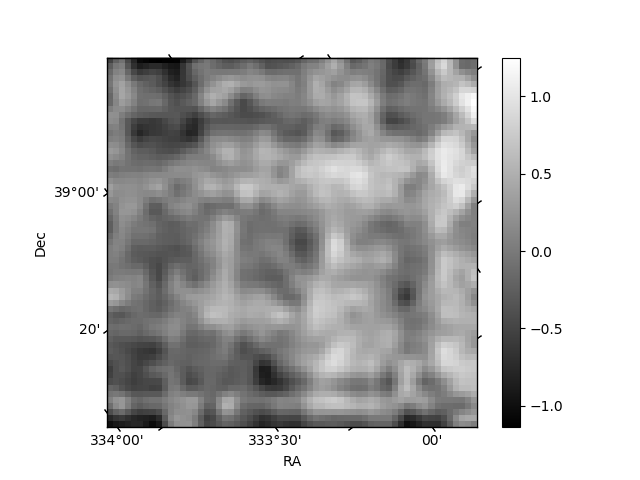
Histogram calculated using DETX and DETY for each event in the final _common_clean file
| Quadrant A | 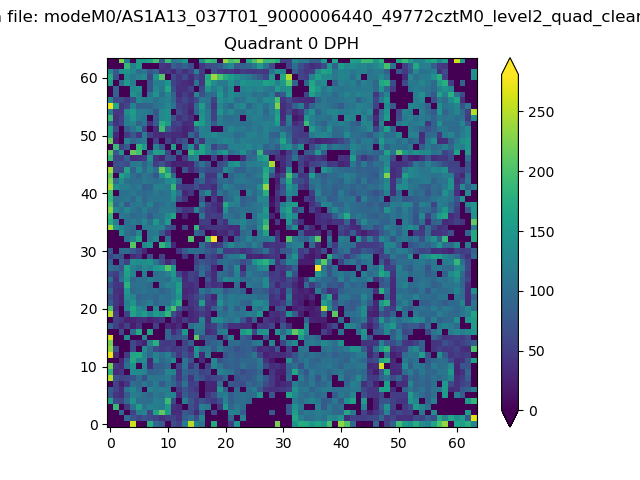 |
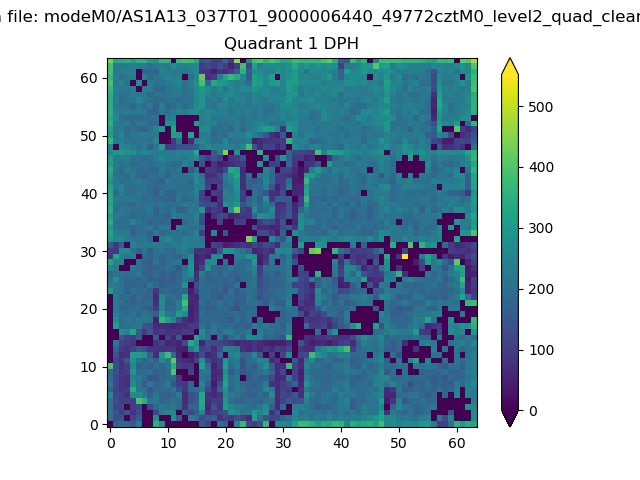 |
Quadrant B |
|---|---|---|---|
| Quadrant D | 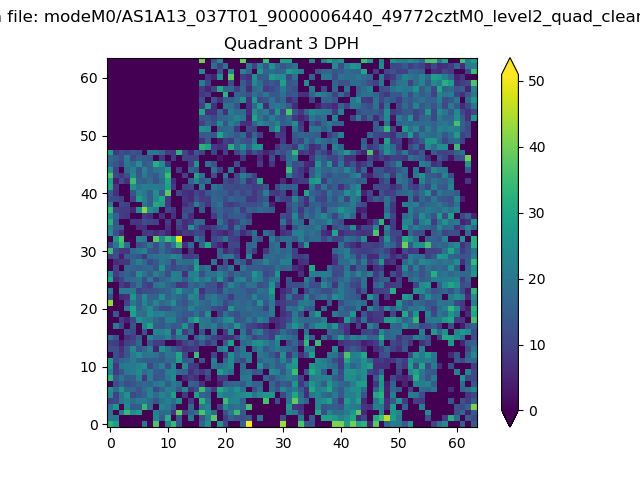 |
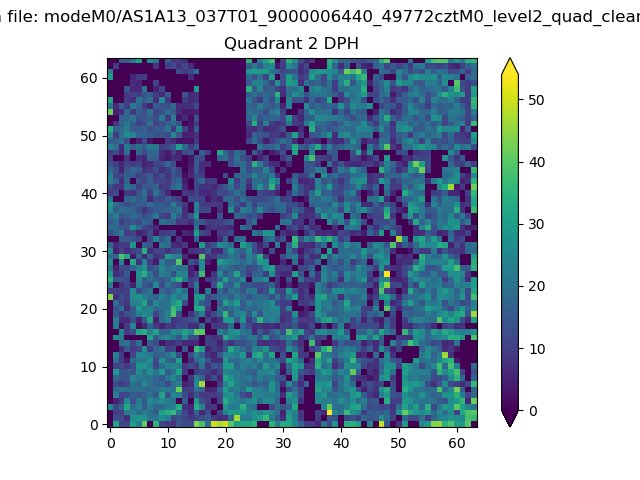 |
Quadrant C |
| Plot type | Count rate plots | Images |
|---|---|---|
| Comparison with Poisson distribution Blue bars denote a histogram of data divided into 1 sec bins. Red curve is a Poisson curve with rate = median count rate of data. |
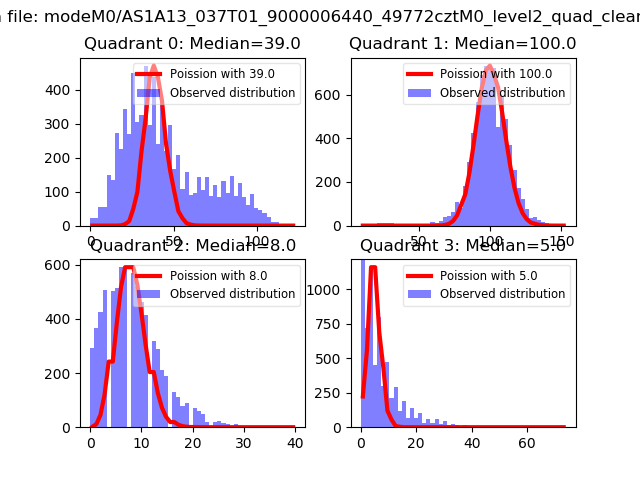 |
 |
| Quadrant-wise count rates Data is divided into 100 sec bins |
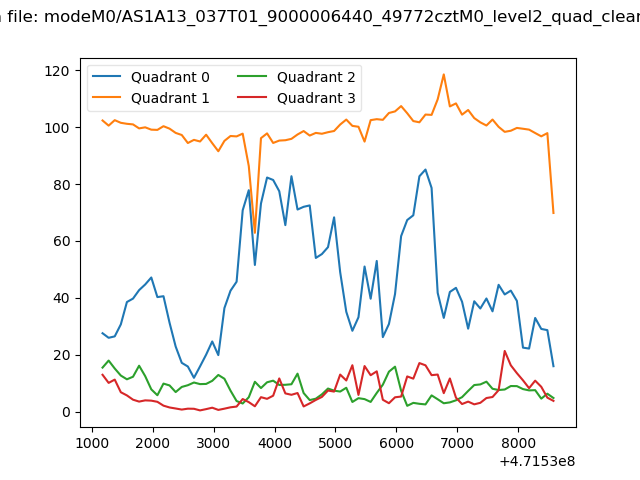 |
|
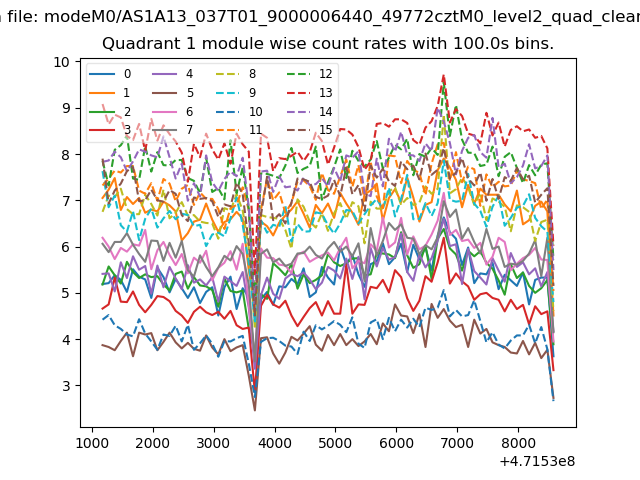
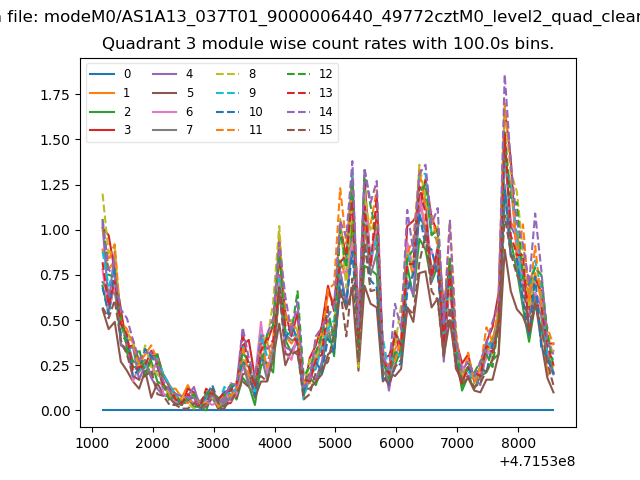
| Module-wise count rates for Quadrant A Data is divided into 100 sec bins |
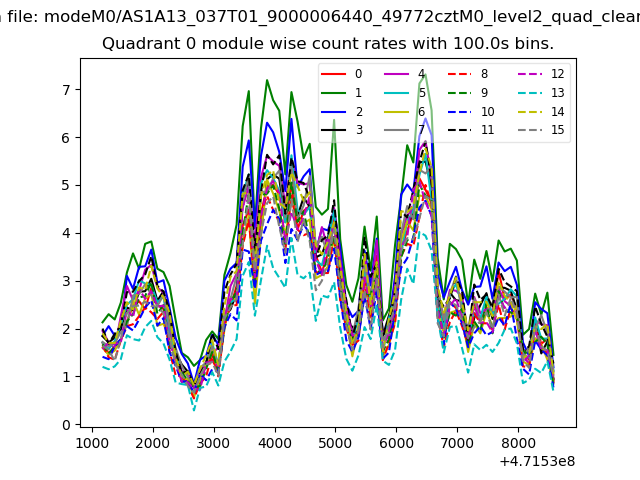 |
 |
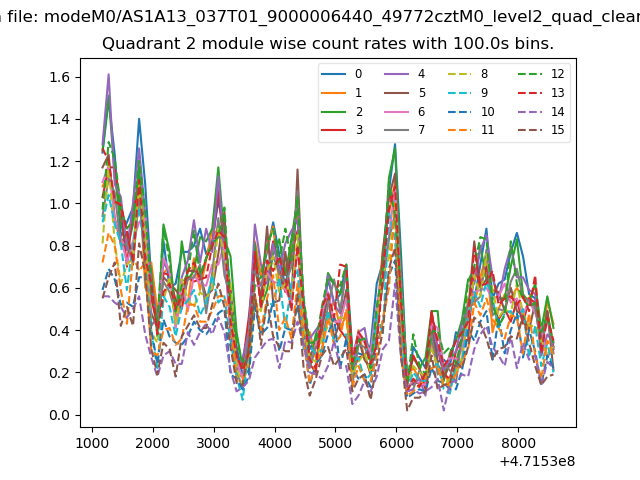
| Module-wise count rates for Quadrant B Data is divided into 100 sec bins |
 |
 |
| Module-wise count rates for Quadrant C Data is divided into 100 sec bins |
 |
 |
| Module-wise count rates for Quadrant D Data is divided into 100 sec bins |
 |
 |
| Parameter | Plot |
|---|---|
| CZT HV Monitor | 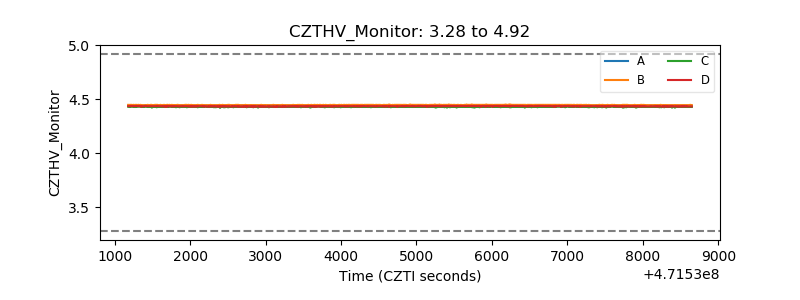 |
| D_VDD | 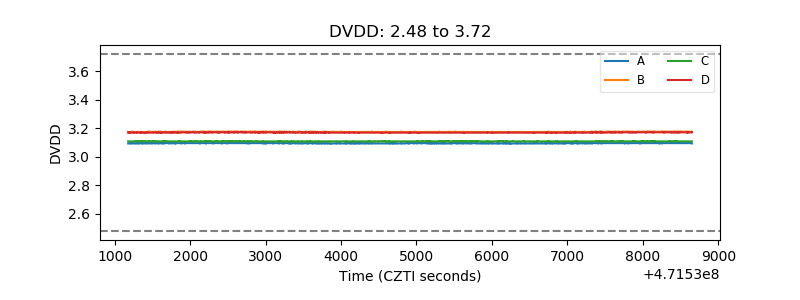 |
| Temperature 1 | 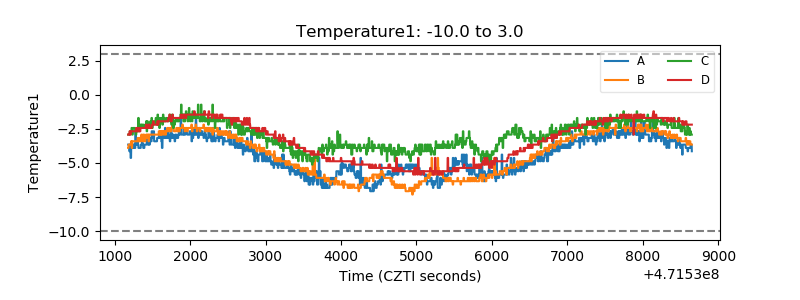 |
| Veto HV Monitor | 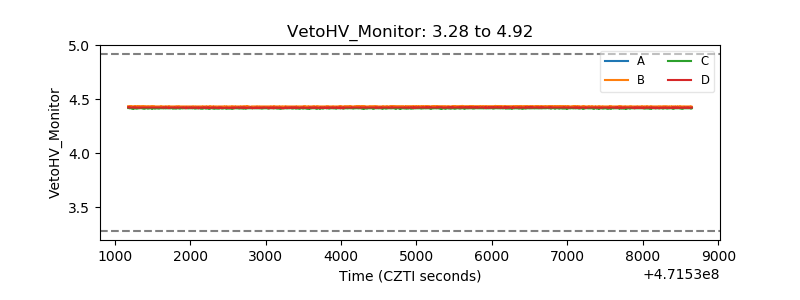 |
| Veto LLD | 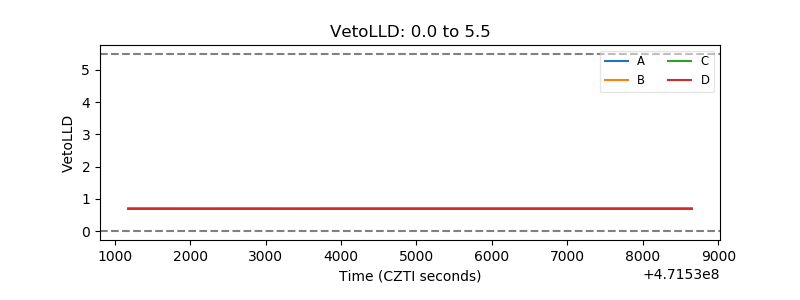 |
| Alpha Counter | 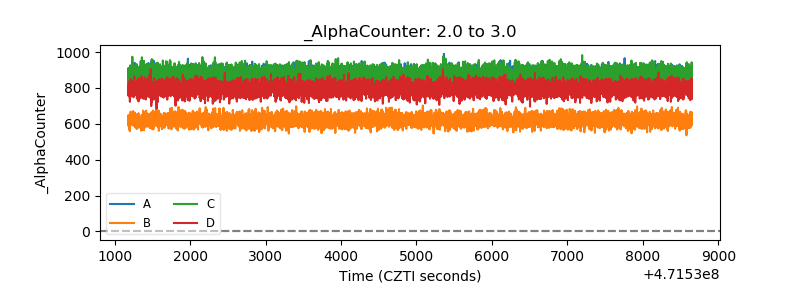 |
| _CPM_Rate | 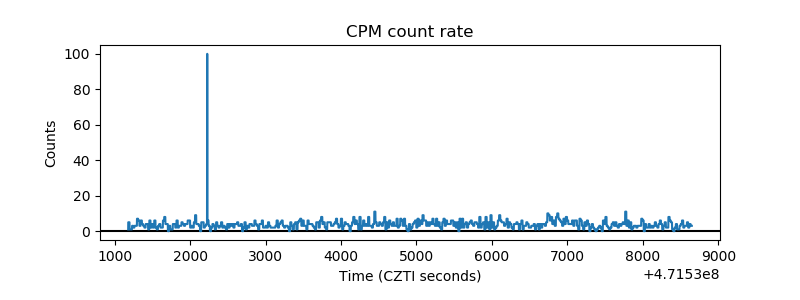 |
| CZT Counter | 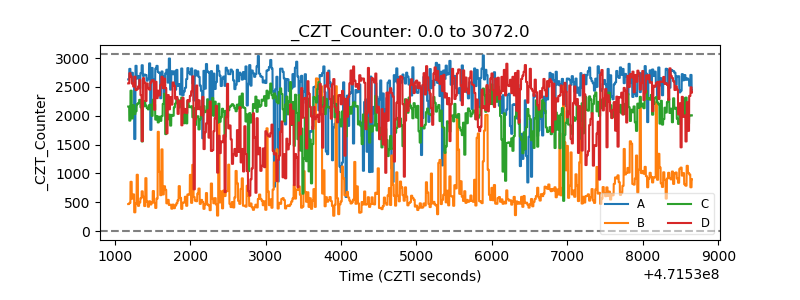 |
| +2.5 Volts monitor | 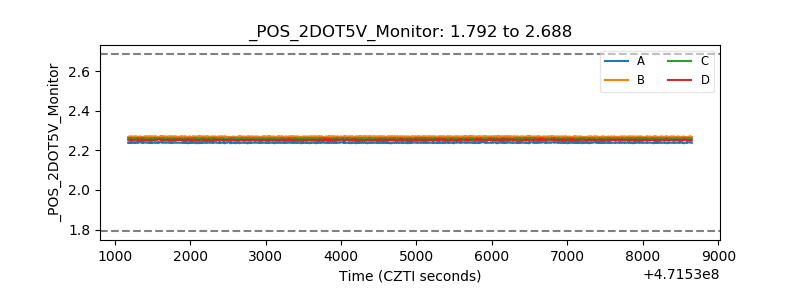 |
| +5 Volts monitor | 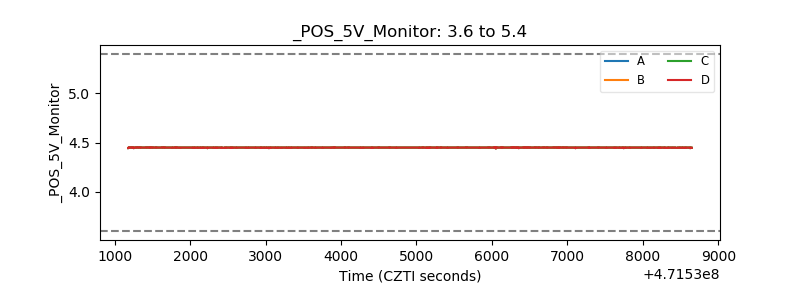 |
| _ROLL_ROT | 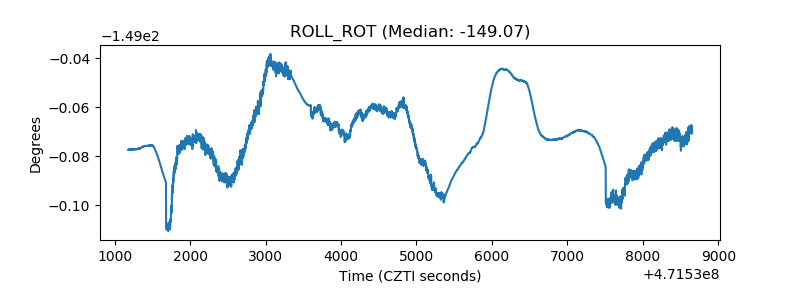 |
| _Roll_DEC | 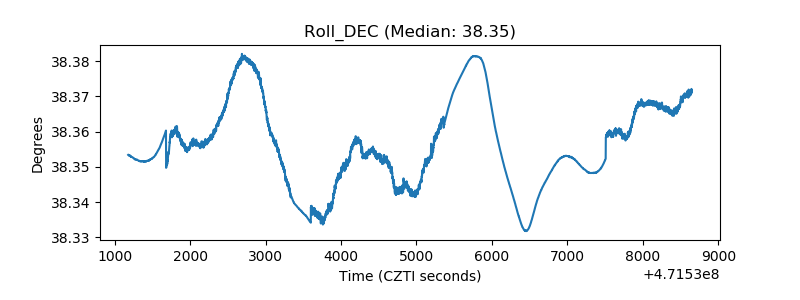 |
| _Roll_RA | 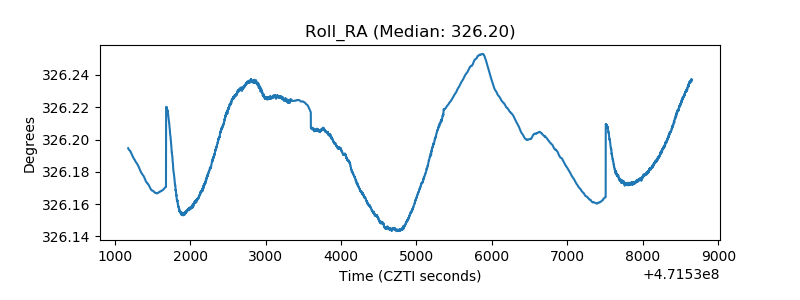 |
| Veto Counter | 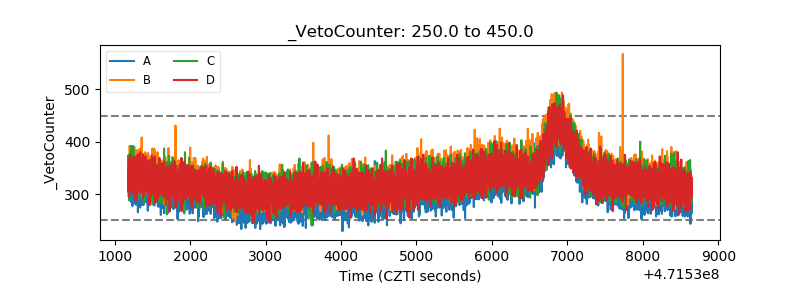 |