| Param | Original file | Final file |
|---|---|---|
| Filename | modeM0/AS1A13_037T01_9000006440_49773cztM0_level2.fits | modeM0/AS1A13_037T01_9000006440_49773cztM0_level2_quad_clean.evt |
| Size (bytes) | 1,440,408,960 | 52,848,000 |
| Size | 1.3 GB | 50.4 MB |
| Events in quadrant A | 17,529,555 | 308,360 |
| Events in quadrant B | 5,798,586 | 700,918 |
| Events in quadrant C | 12,650,330 | 30,516 |
| Events in quadrant D | 16,791,051 | 53,984 |
| Mode SS | |||
|---|---|---|---|
| Quadrant | BADHDUFLAG | Total packets | Discarded packets |
| A | 0 | 142 | 0 |
| B | 0 | 142 | 0 |
| C | 0 | 142 | 0 |
| D | 0 | 142 | 0 |
| Mode M0 | |||
|---|---|---|---|
| Quadrant | BADHDUFLAG | Total packets | Discarded packets |
| A | 0 | 56971 | 0 |
| B | 0 | 22056 | 0 |
| C | 0 | 42501 | 0 |
| D | 0 | 54707 | 0 |
| Quadrant | Total seconds | Saturated seconds | Saturation percentage |
|---|---|---|---|
| A | 7124 | 6522 | 91.549691% |
| B | 7125 | 538 | 7.550877% |
| C | 7125 | 7125 | 100.000000% |
| D | 7124 | 7124 | 100.000000% |
Noise dominated data is calculated using 1-second bins in cleaned event files. If a bin has >2000 counts, and if more than 50% of those come from <1% of pixels, then it is considered to be noise-dominated and hence unusable.
| Quadrant | # 1 sec bins | Bins with >0 counts | Bins with >2000 counts | High rate bins dominated by noise | Noise dominated (total time) | Noise dominated (detector-on time) | Marked lightcurve |
|---|---|---|---|---|---|---|---|
| A | 7124 | 7124 | 5988 | 5988 | 84.05% | 84.05% | 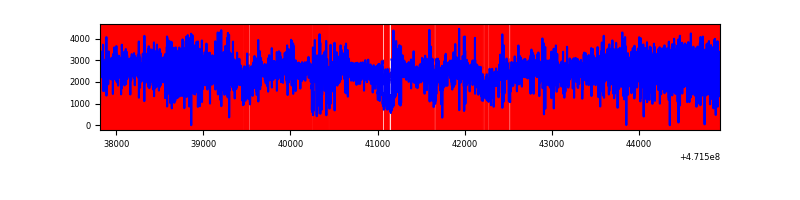 |
| B | 7125 | 7125 | 337 | 337 | 4.73% | 4.73% | 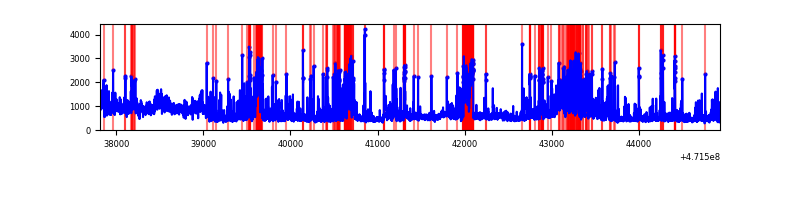 |
| C | 7124 | 7124 | 2306 | 2306 | 32.37% | 32.37% | 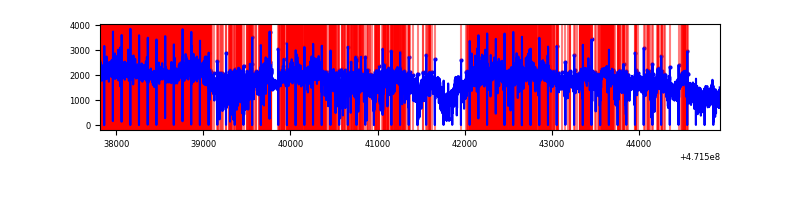 |
| D | 7123 | 7123 | 5766 | 5766 | 80.95% | 80.95% |  |
Top three noisy pixels from each quadrant. If the there are fewer than three noisy pixels in the level2.evt file, extra rows are filled as -1
| Pixel properties | Quadrant properties | ||||||
|---|---|---|---|---|---|---|---|
| Quadrant | DetID | PixID | Counts | Sigma | Mean | Median | Sigma |
| A | 0 | 98 | 5586350 | 46457.51 | 370 | 354 | 120.2 |
| A | 12 | 50 | 4502195 | 37440.83 | 370 | 354 | 120.2 |
| A | 3 | 99 | 1086761 | 9035.41 | 370 | 354 | 120.2 |
| B | 5 | 172 | 598430 | 3838.1 | 732 | 707 | 155.7 |
| B | 3 | 232 | 372378 | 2386.58 | 732 | 707 | 155.7 |
| B | 10 | 247 | 246631 | 1579.13 | 732 | 707 | 155.7 |
| C | 15 | 197 | 2396309 | 81563.89 | 54 | 51 | 29.4 |
| C | 1 | 23 | 1149679 | 39131.07 | 54 | 51 | 29.4 |
| C | 15 | 174 | 965324 | 32855.99 | 54 | 51 | 29.4 |
| D | 8 | 129 | 8634628 | 94405.07 | 93 | 80 | 91.5 |
| D | 15 | 168 | 1926334 | 21060.53 | 93 | 80 | 91.5 |
| D | 15 | 25 | 760556 | 8314.6 | 93 | 80 | 91.5 |
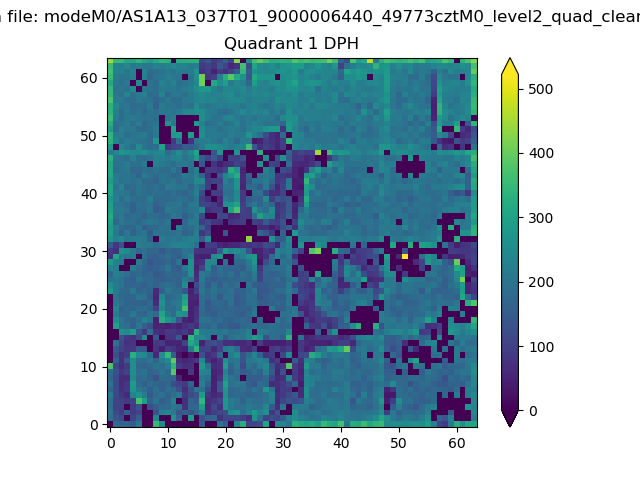
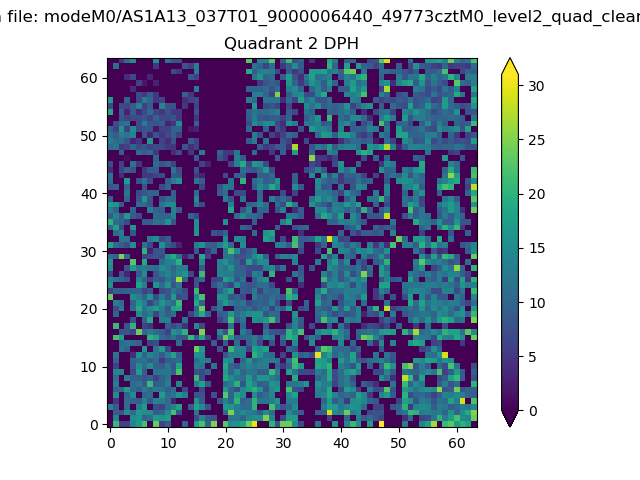
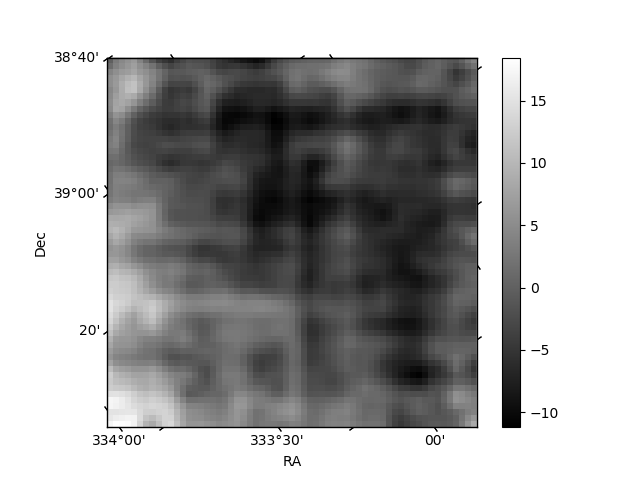
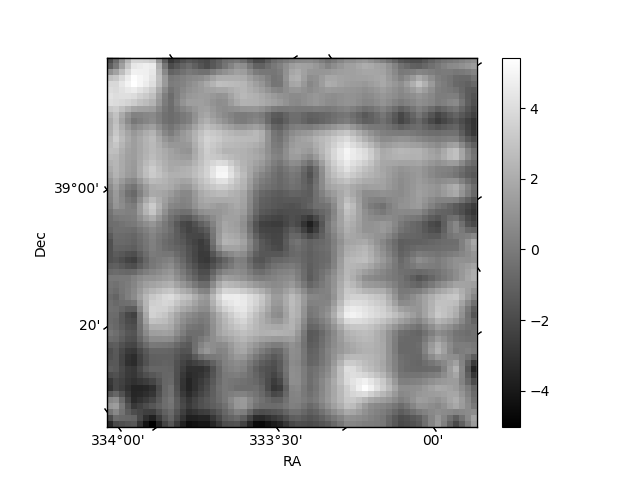
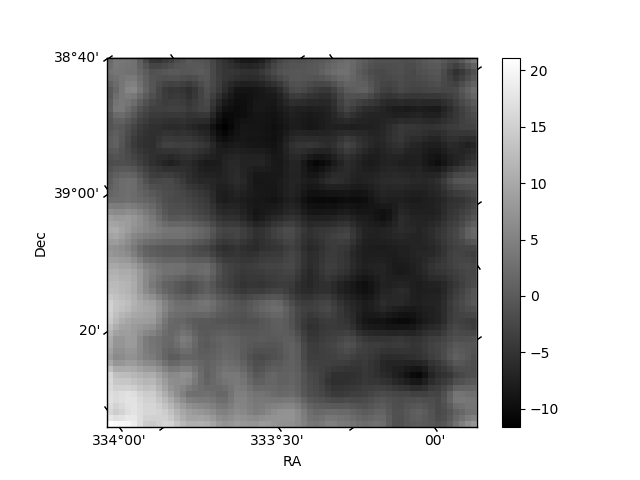
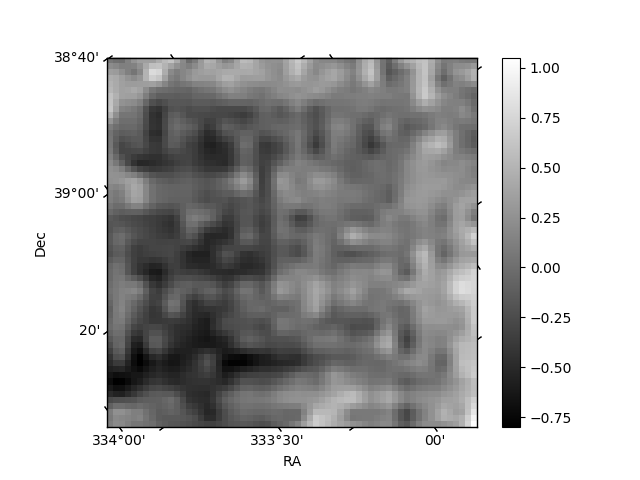
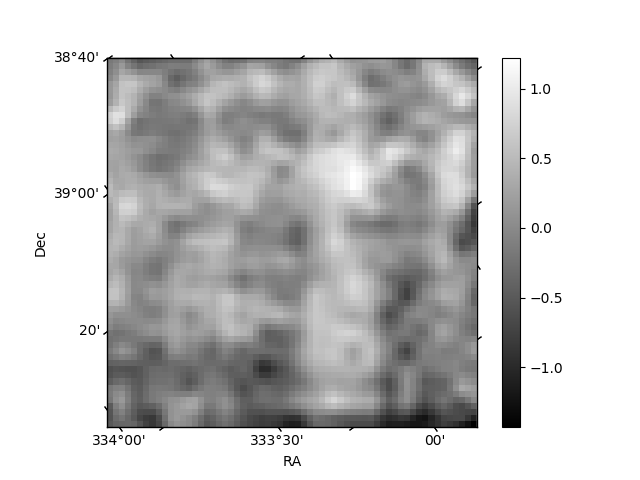
Histogram calculated using DETX and DETY for each event in the final _common_clean file
| Quadrant A | 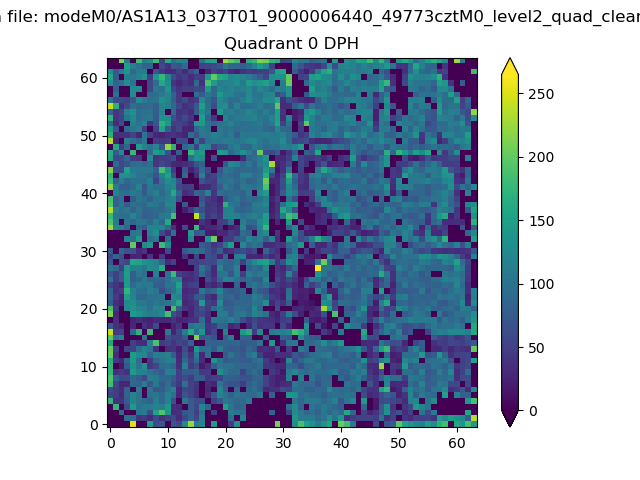 |
 |
Quadrant B |
|---|---|---|---|
| Quadrant D | 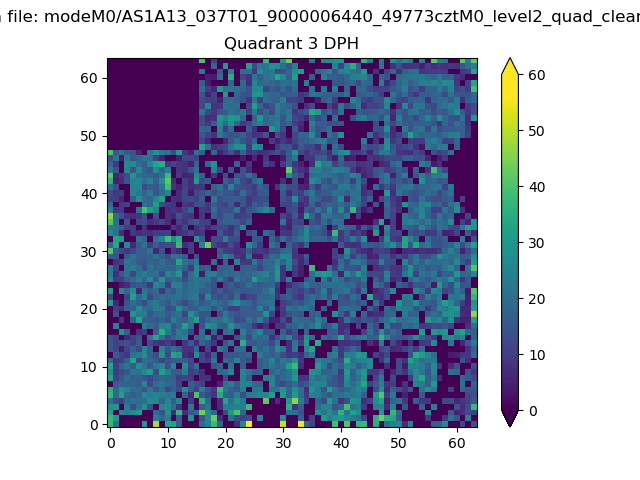 |
 |
Quadrant C |
| Plot type | Count rate plots | Images |
|---|---|---|
| Comparison with Poisson distribution Blue bars denote a histogram of data divided into 1 sec bins. Red curve is a Poisson curve with rate = median count rate of data. |
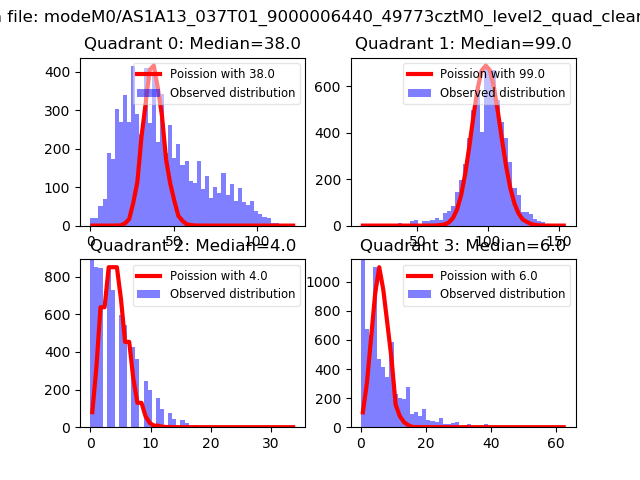 |
 |
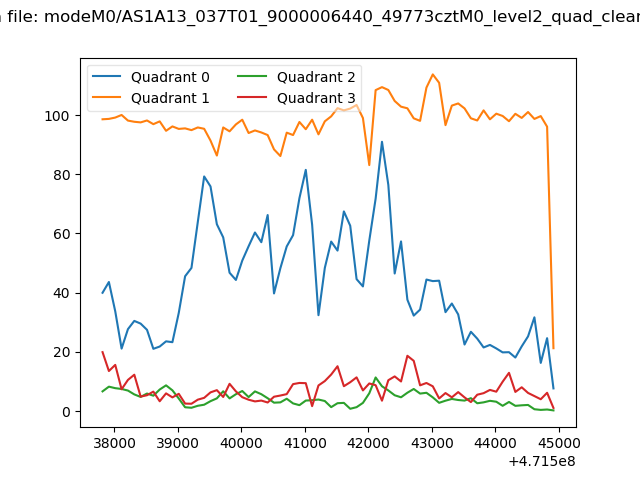
| Quadrant-wise count rates Data is divided into 100 sec bins |
 |
|
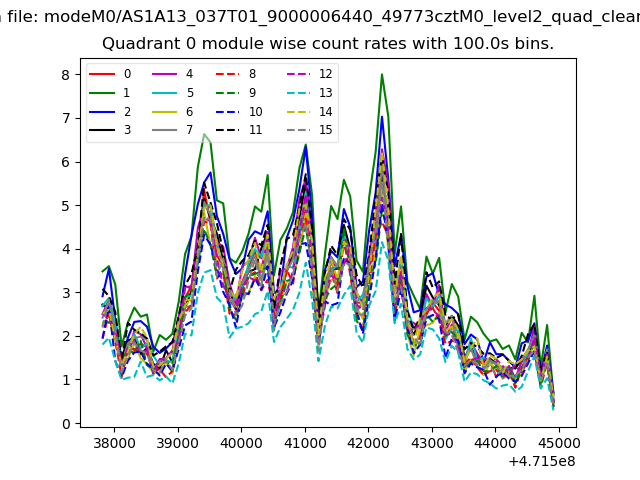
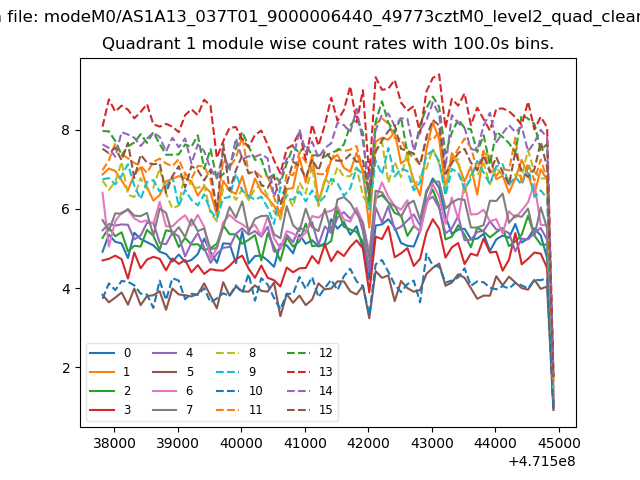
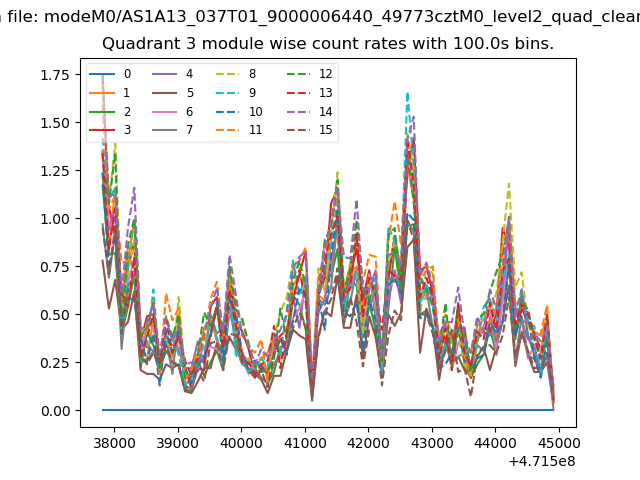
| Module-wise count rates for Quadrant A Data is divided into 100 sec bins |
 |
 |
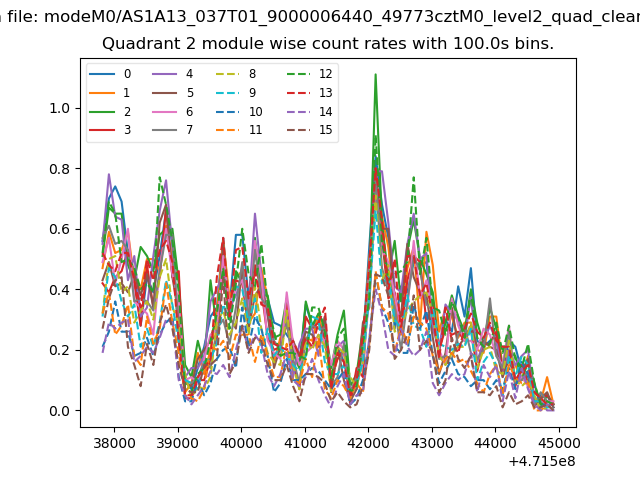
| Module-wise count rates for Quadrant B Data is divided into 100 sec bins |
 |
 |
| Module-wise count rates for Quadrant C Data is divided into 100 sec bins |
 |
 |
| Module-wise count rates for Quadrant D Data is divided into 100 sec bins |
 |
 |
| Parameter | Plot |
|---|---|
| CZT HV Monitor | 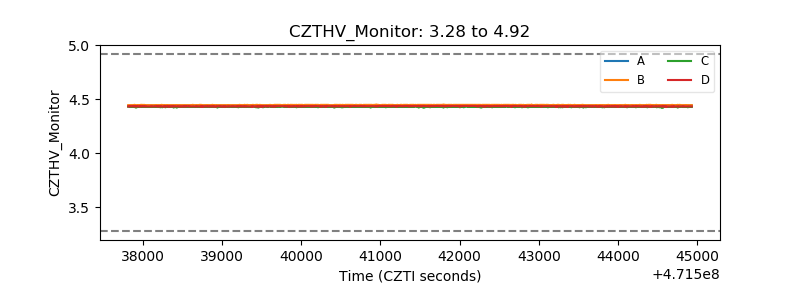 |
| D_VDD | 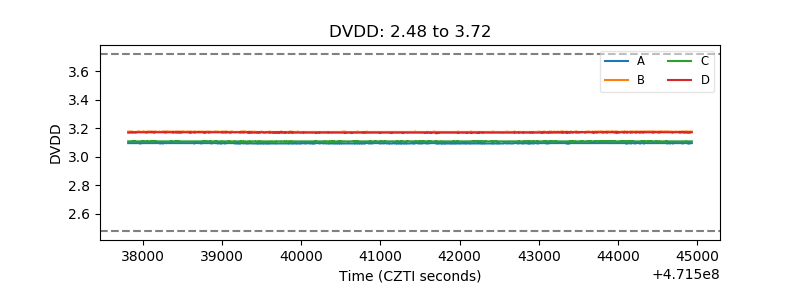 |
| Temperature 1 | 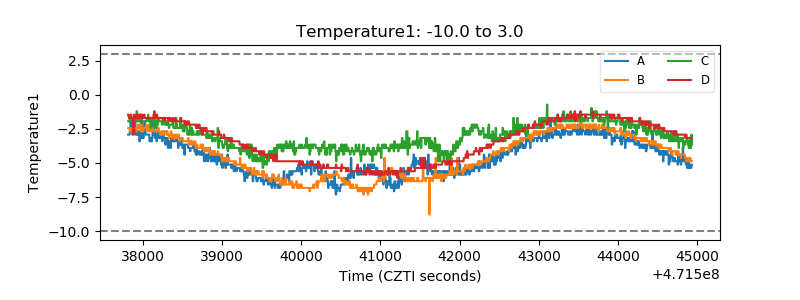 |
| Veto HV Monitor |  |
| Veto LLD | 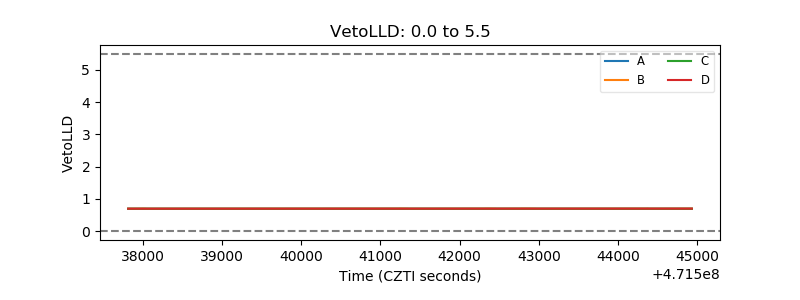 |
| Alpha Counter | 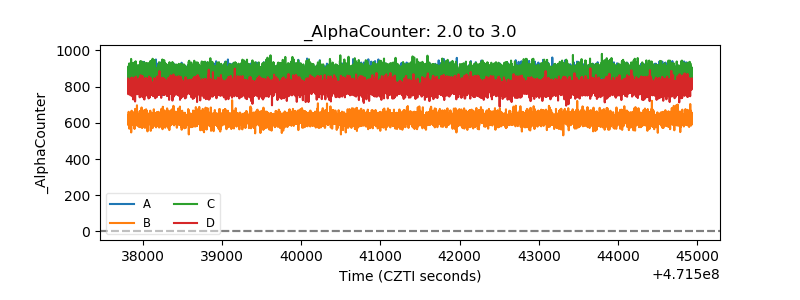 |
| _CPM_Rate | 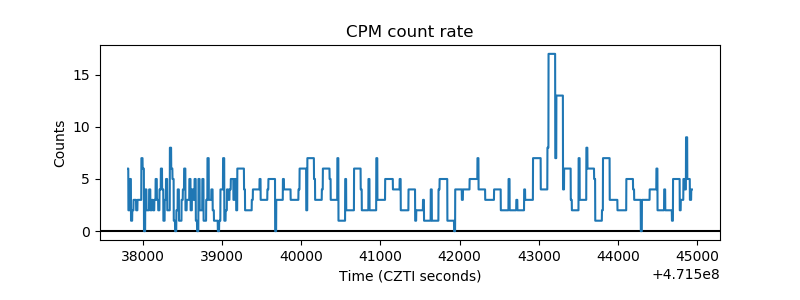 |
| CZT Counter | 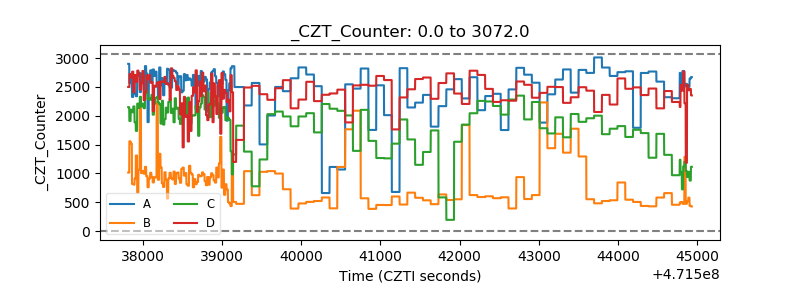 |
| +2.5 Volts monitor | 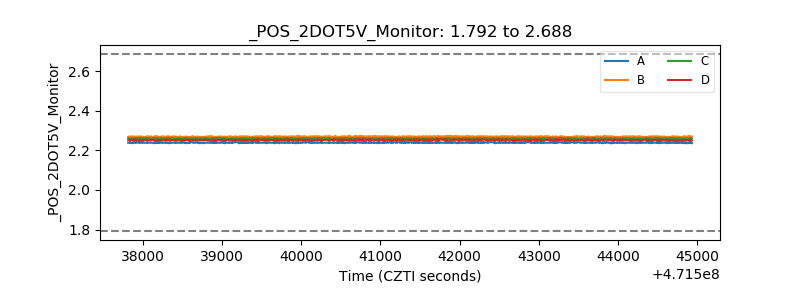 |
| +5 Volts monitor |  |
| _ROLL_ROT | 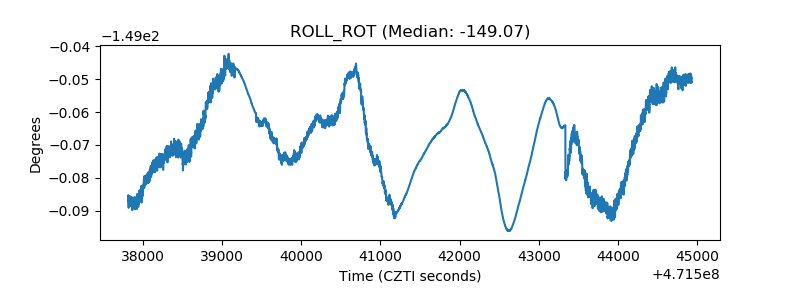 |
| _Roll_DEC | 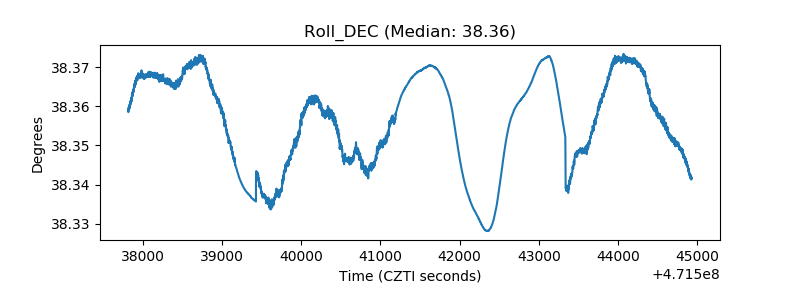 |
| _Roll_RA | 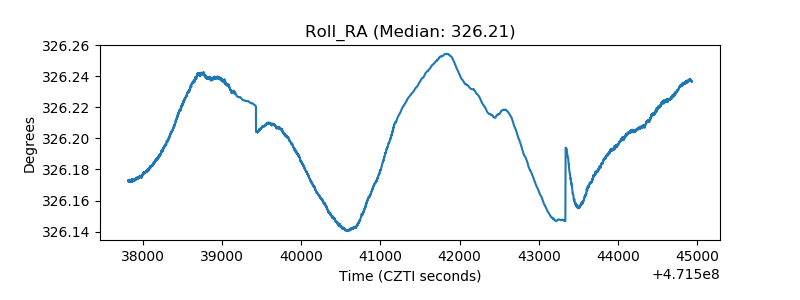 |
| Veto Counter | 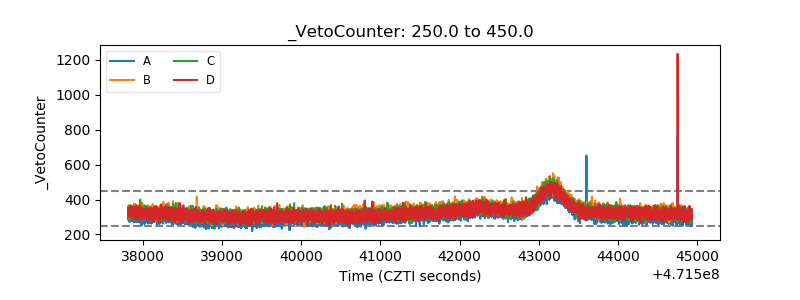 |