| Param | Original file | Final file |
|---|---|---|
| Filename | modeM0/AS1A13_037T01_9000006440_49776cztM0_level2.fits | modeM0/AS1A13_037T01_9000006440_49776cztM0_level2_quad_clean.evt |
| Size (bytes) | 3,262,752,000 | 138,905,280 |
| Size | 3.0 GB | 132.5 MB |
| Events in quadrant A | 32,707,416 | 926,935 |
| Events in quadrant B | 10,892,566 | 1,831,892 |
| Events in quadrant C | 30,204,463 | 13,774 |
| Events in quadrant D | 45,521,730 | 136,189 |
| Mode M9 | |||
|---|---|---|---|
| Quadrant | BADHDUFLAG | Total packets | Discarded packets |
| A | 0 | 14 | 0 |
| B | 0 | 14 | 0 |
| C | 0 | 14 | 0 |
| D | 0 | 14 | 0 |
| Mode SS | |||
|---|---|---|---|
| Quadrant | BADHDUFLAG | Total packets | Discarded packets |
| A | 0 | 378 | 0 |
| B | 0 | 378 | 0 |
| C | 0 | 378 | 0 |
| D | 0 | 378 | 0 |
| Mode M0 | |||
|---|---|---|---|
| Quadrant | BADHDUFLAG | Total packets | Discarded packets |
| A | 0 | 110240 | 10 |
| B | 0 | 45199 | 3 |
| C | 0 | 102933 | 3 |
| D | 0 | 148220 | 3 |
| Quadrant | Total seconds | Saturated seconds | Saturation percentage |
|---|---|---|---|
| A | 18814 | 8989 | 47.778250% |
| B | 18815 | 581 | 3.087962% |
| C | 18815 | 18686 | 99.314377% |
| D | 18815 | 17490 | 92.957746% |
Noise dominated data is calculated using 1-second bins in cleaned event files. If a bin has >2000 counts, and if more than 50% of those come from <1% of pixels, then it is considered to be noise-dominated and hence unusable.
| Quadrant | # 1 sec bins | Bins with >0 counts | Bins with >2000 counts | High rate bins dominated by noise | Noise dominated (total time) | Noise dominated (detector-on time) | Marked lightcurve |
|---|---|---|---|---|---|---|---|
| A | 20058 | 18815 | 7896 | 7896 | 39.37% | 41.97% | 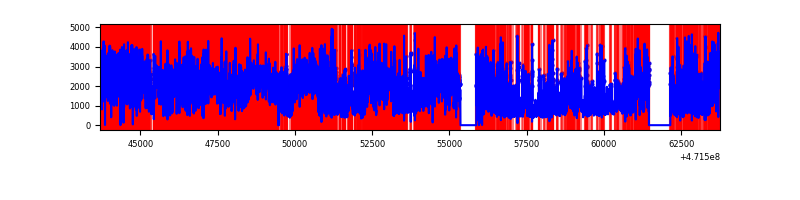 |
| B | 20060 | 18818 | 235 | 235 | 1.17% | 1.25% | 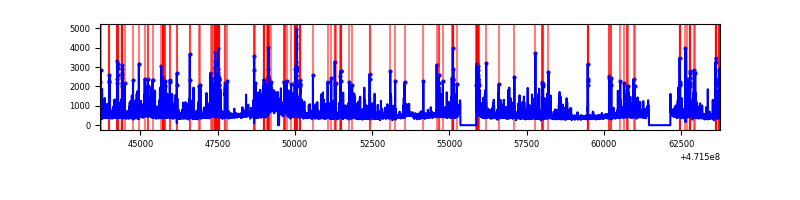 |
| C | 20060 | 18812 | 5192 | 5192 | 25.88% | 27.60% | 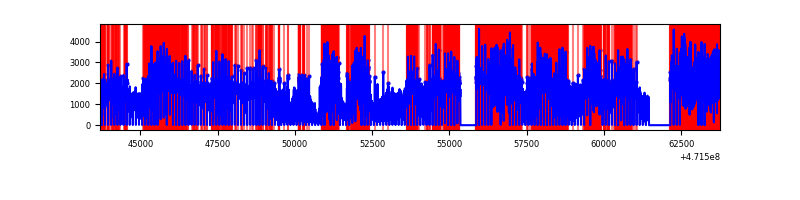 |
| D | 20060 | 18818 | 15027 | 15027 | 74.91% | 79.85% | 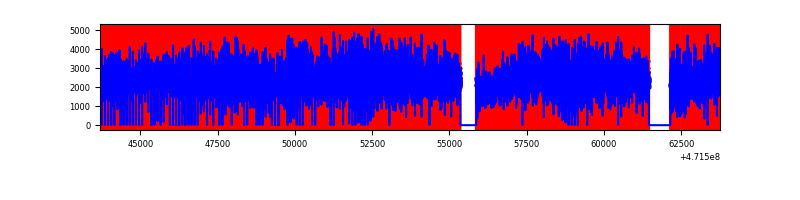 |
Top three noisy pixels from each quadrant. If the there are fewer than three noisy pixels in the level2.evt file, extra rows are filled as -1
| Pixel properties | Quadrant properties | ||||||
|---|---|---|---|---|---|---|---|
| Quadrant | DetID | PixID | Counts | Sigma | Mean | Median | Sigma |
| A | 12 | 50 | 5226010 | 12545.09 | 1563 | 1519 | 416.5 |
| A | 0 | 98 | 3284714 | 7883.63 | 1563 | 1519 | 416.5 |
| A | 8 | 8 | 2373104 | 5694.67 | 1563 | 1519 | 416.5 |
| B | 5 | 185 | 417219 | 997.13 | 1989 | 1921 | 416.5 |
| B | 4 | 206 | 350149 | 836.1 | 1989 | 1921 | 416.5 |
| B | 7 | 0 | 298795 | 712.79 | 1989 | 1921 | 416.5 |
| C | 15 | 148 | 5157860 | 36025.29 | 230 | 215 | 143.2 |
| C | 15 | 147 | 4880314 | 34086.68 | 230 | 215 | 143.2 |
| C | 15 | 197 | 2467565 | 17234.03 | 230 | 215 | 143.2 |
| D | 8 | 129 | 14534899 | 45800.04 | 694 | 646 | 317.3 |
| D | 15 | 168 | 8182641 | 25782.93 | 694 | 646 | 317.3 |
| D | 15 | 142 | 3295531 | 10382.77 | 694 | 646 | 317.3 |
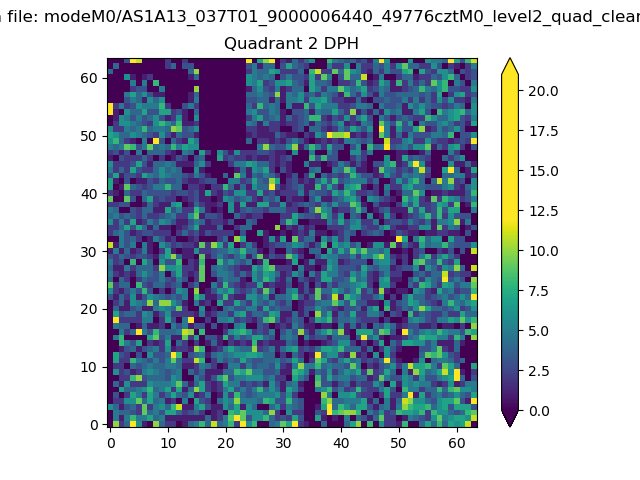
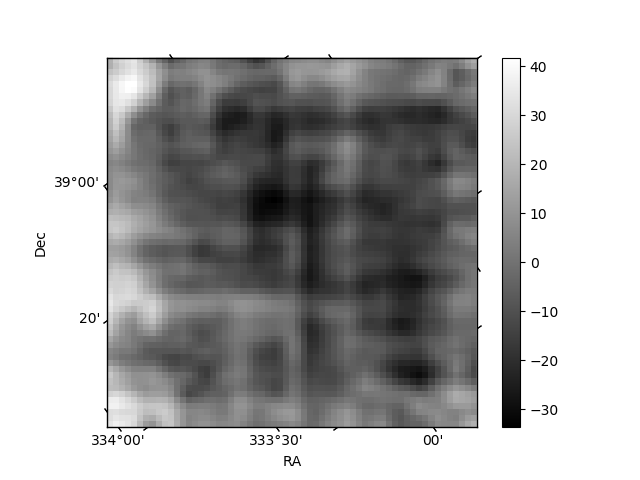
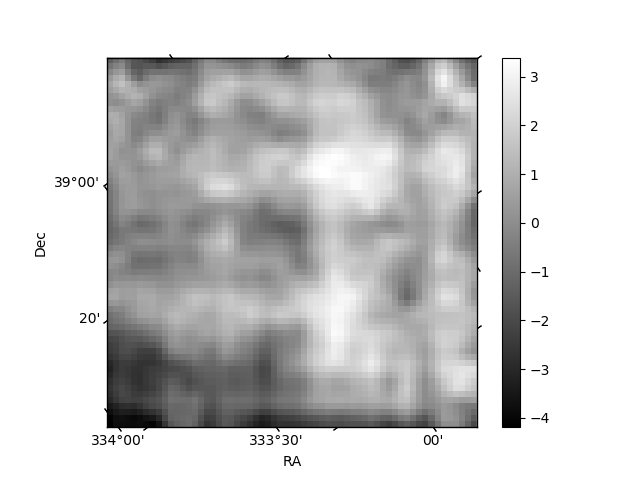
Histogram calculated using DETX and DETY for each event in the final _common_clean file
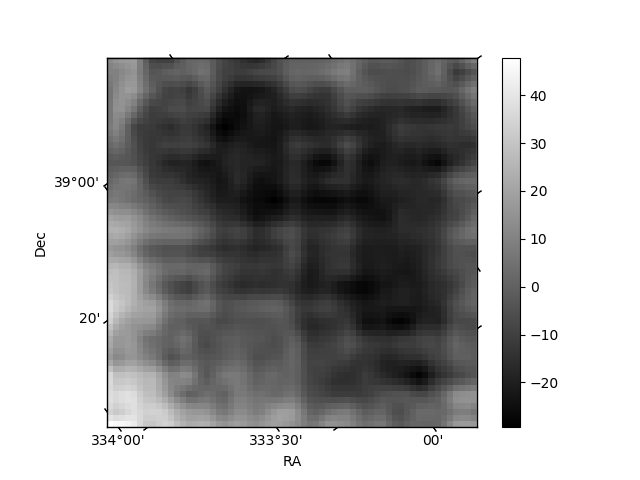
| Quadrant A | 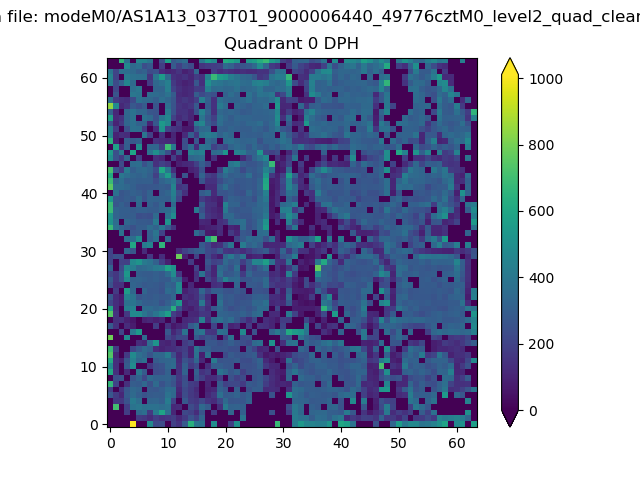 |
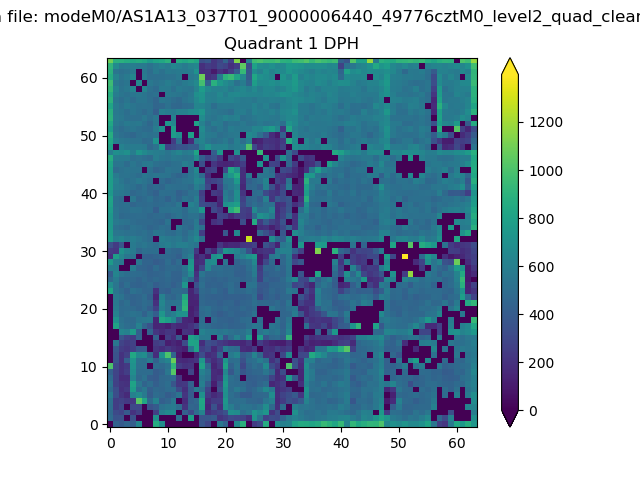 |
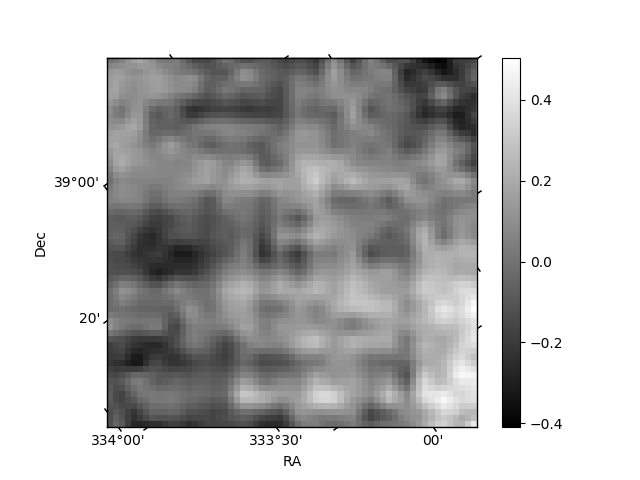
Quadrant B |
|---|---|---|---|
| Quadrant D | 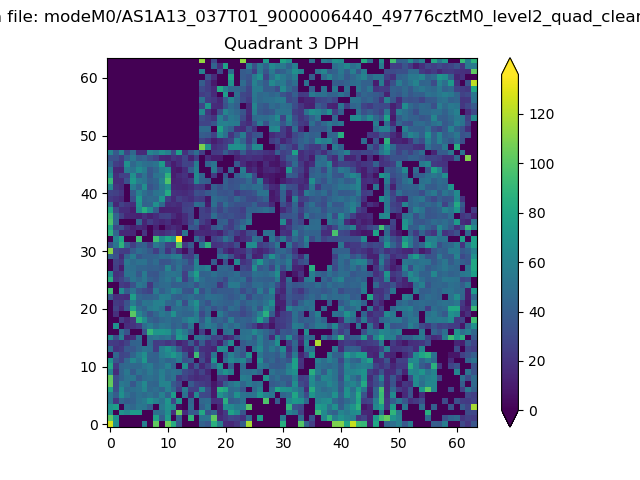 |
 |
Quadrant C |
| Plot type | Count rate plots | Images |
|---|---|---|
| Comparison with Poisson distribution Blue bars denote a histogram of data divided into 1 sec bins. Red curve is a Poisson curve with rate = median count rate of data. |
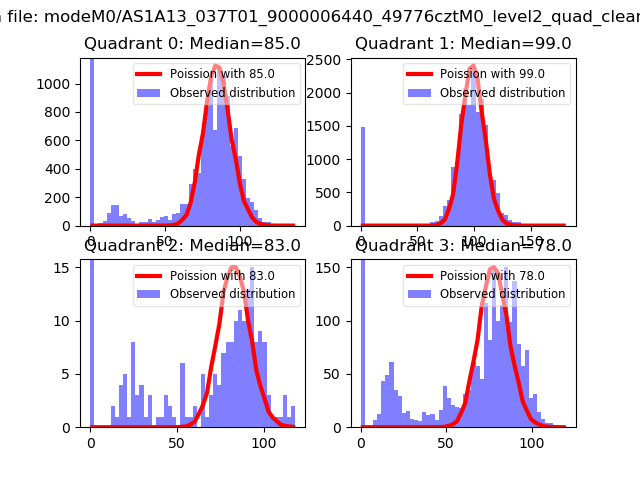 |
 |
| Quadrant-wise count rates Data is divided into 100 sec bins |
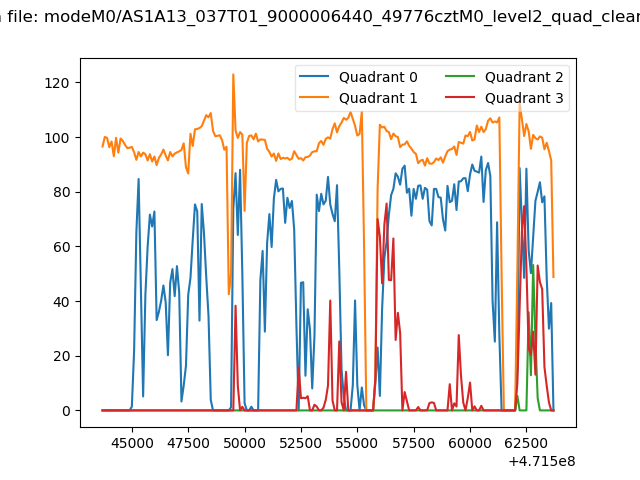 |
|
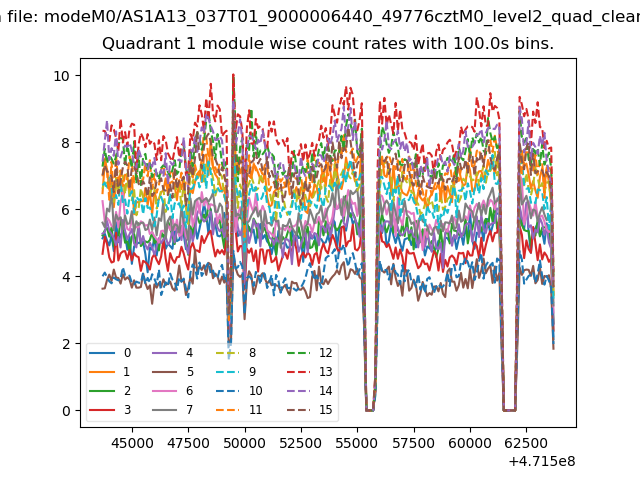
| Module-wise count rates for Quadrant A Data is divided into 100 sec bins |
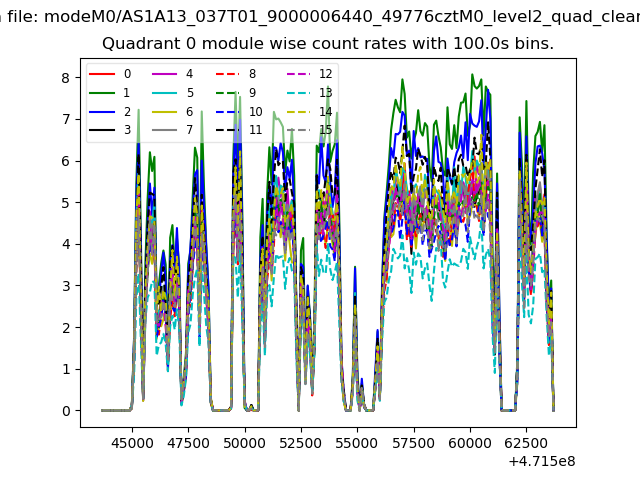 |
 |
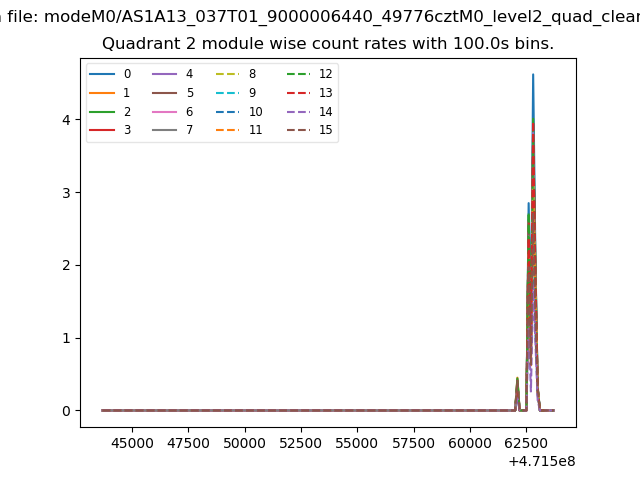
| Module-wise count rates for Quadrant B Data is divided into 100 sec bins |
 |
 |
| Module-wise count rates for Quadrant C Data is divided into 100 sec bins |
 |
 |
| Module-wise count rates for Quadrant D Data is divided into 100 sec bins |
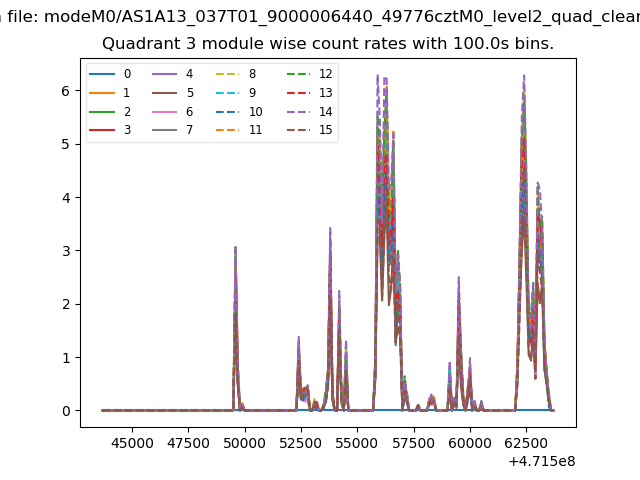 |
 |
| Parameter | Plot |
|---|---|
| CZT HV Monitor | 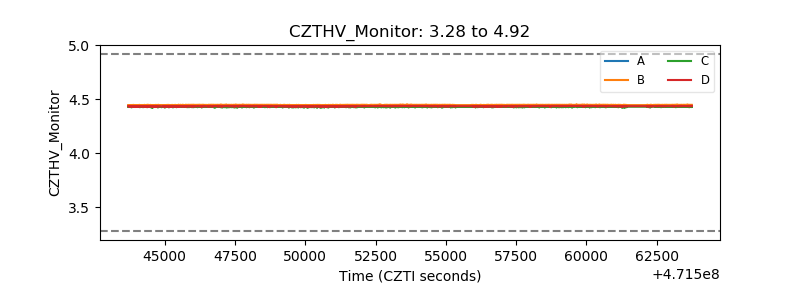 |
| D_VDD | 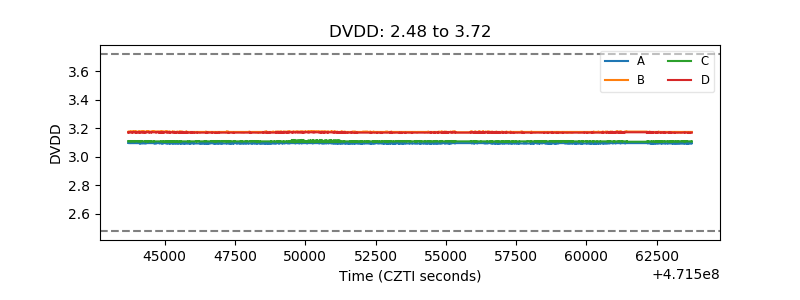 |
| Temperature 1 | 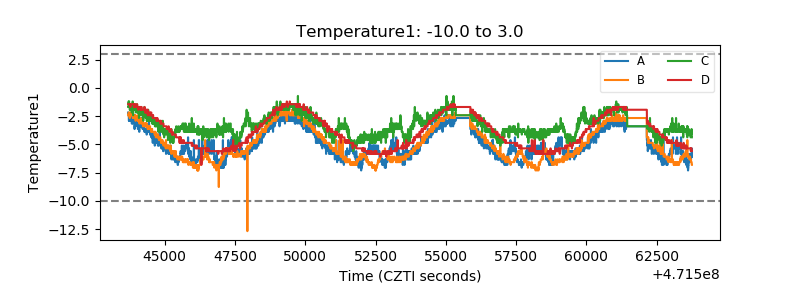 |
| Veto HV Monitor | 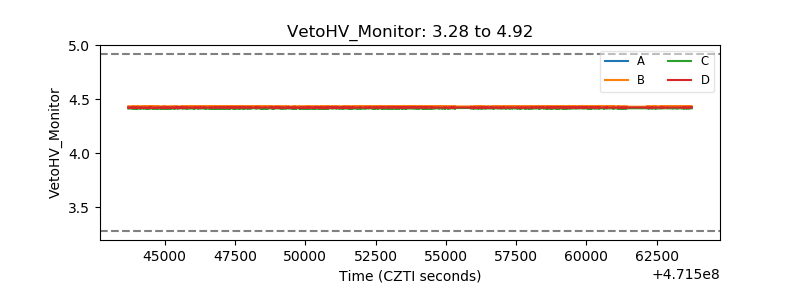 |
| Veto LLD | 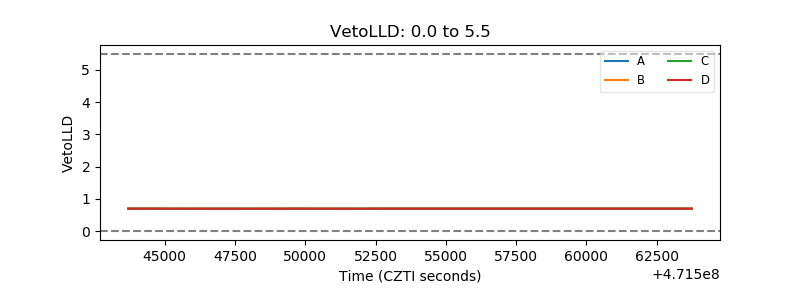 |
| Alpha Counter | 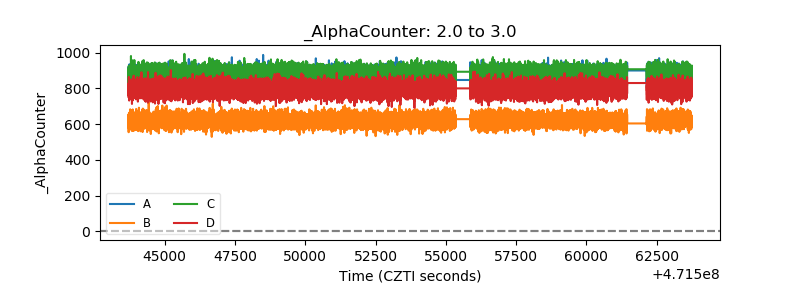 |
| _CPM_Rate | 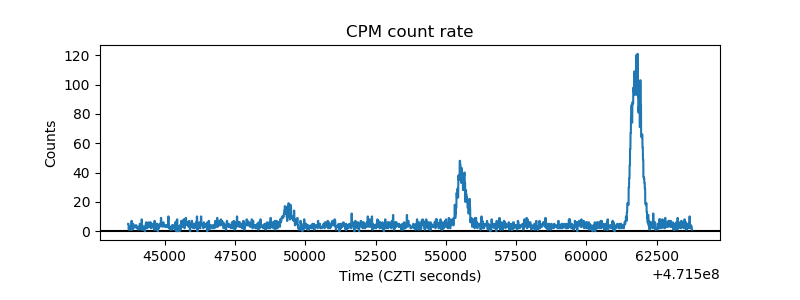 |
| CZT Counter | 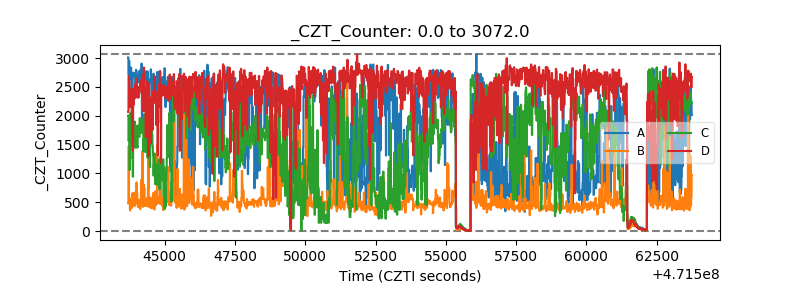 |
| +2.5 Volts monitor | 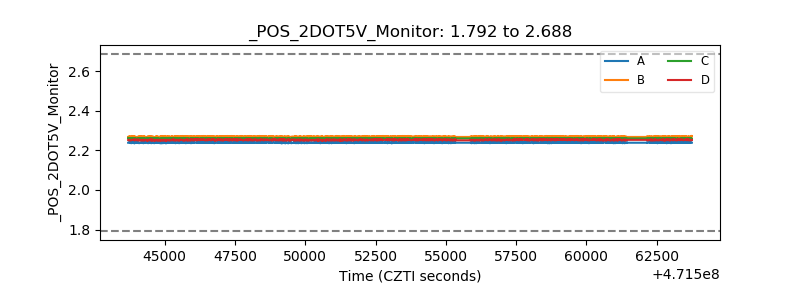 |
| +5 Volts monitor | 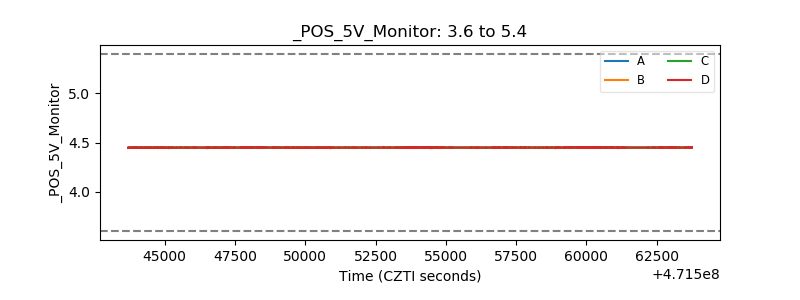 |
| _ROLL_ROT | 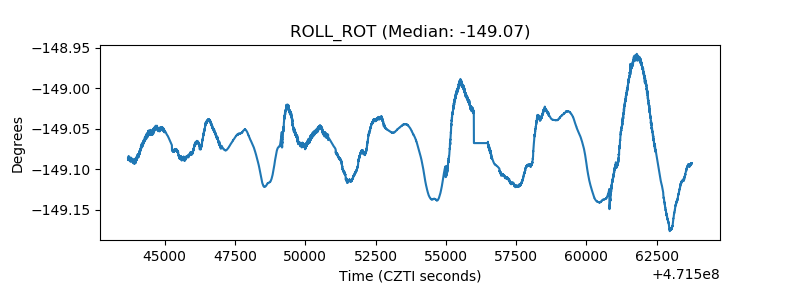 |
| _Roll_DEC | 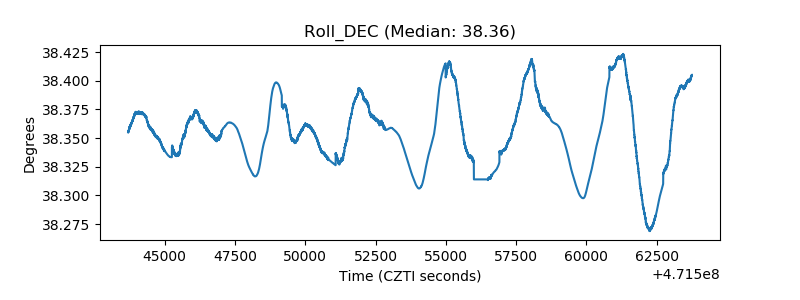 |
| _Roll_RA | 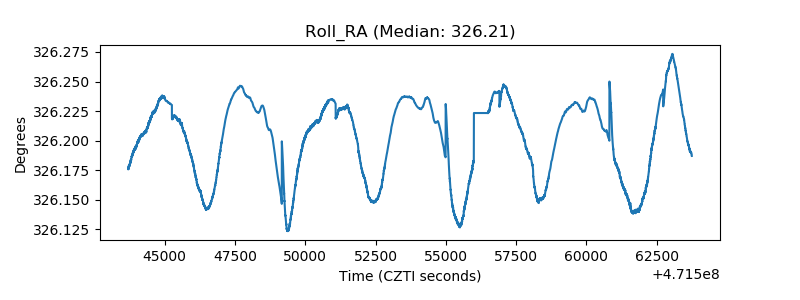 |
| Veto Counter | 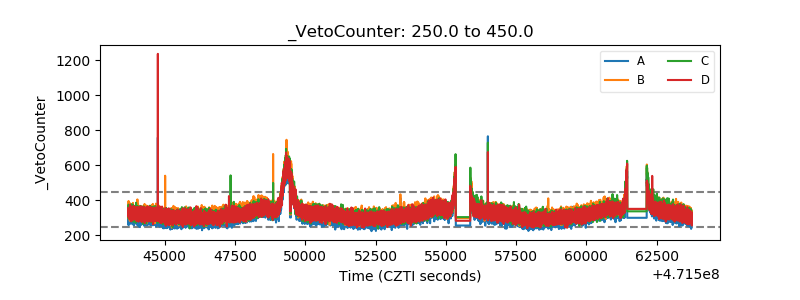 |