| Param | Original file | Final file |
|---|---|---|
| Filename | modeM0/AS1A13_037T01_9000006440_49777cztM0_level2.fits | modeM0/AS1A13_037T01_9000006440_49777cztM0_level2_quad_clean.evt |
| Size (bytes) | 1,083,024,000 | 54,622,080 |
| Size | 1.0 GB | 52.1 MB |
| Events in quadrant A | 8,401,069 | 488,306 |
| Events in quadrant B | 3,398,140 | 637,148 |
| Events in quadrant C | 11,985,907 | 17,148 |
| Events in quadrant D | 15,807,873 | 62,339 |
| Mode M9 | |||
|---|---|---|---|
| Quadrant | BADHDUFLAG | Total packets | Discarded packets |
| A | 0 | 8 | 0 |
| B | 0 | 8 | 0 |
| C | 0 | 8 | 0 |
| D | 0 | 8 | 0 |
| Mode SS | |||
|---|---|---|---|
| Quadrant | BADHDUFLAG | Total packets | Discarded packets |
| A | 0 | 132 | 0 |
| B | 0 | 132 | 0 |
| C | 0 | 132 | 0 |
| D | 0 | 132 | 0 |
| Mode M0 | |||
|---|---|---|---|
| Quadrant | BADHDUFLAG | Total packets | Discarded packets |
| A | 0 | 29466 | 1 |
| B | 0 | 14677 | 1 |
| C | 0 | 40024 | 2 |
| D | 0 | 51389 | 1 |
| Quadrant | Total seconds | Saturated seconds | Saturation percentage |
|---|---|---|---|
| A | 6424 | 1304 | 20.298879% |
| B | 6424 | 148 | 2.303861% |
| C | 6424 | 6266 | 97.540473% |
| D | 6424 | 5855 | 91.142590% |
Noise dominated data is calculated using 1-second bins in cleaned event files. If a bin has >2000 counts, and if more than 50% of those come from <1% of pixels, then it is considered to be noise-dominated and hence unusable.
| Quadrant | # 1 sec bins | Bins with >0 counts | Bins with >2000 counts | High rate bins dominated by noise | Noise dominated (total time) | Noise dominated (detector-on time) | Marked lightcurve |
|---|---|---|---|---|---|---|---|
| A | 7304 | 6423 | 1079 | 1079 | 14.77% | 16.80% |  |
| B | 7304 | 6425 | 60 | 60 | 0.82% | 0.93% | 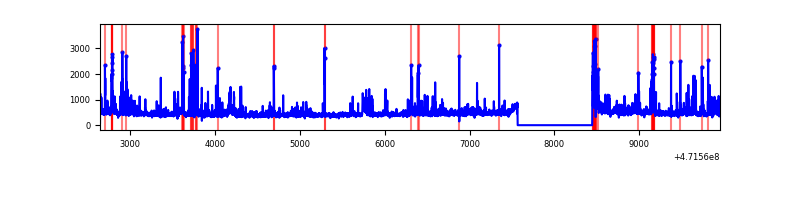 |
| C | 7303 | 6420 | 3223 | 3223 | 44.13% | 50.20% | 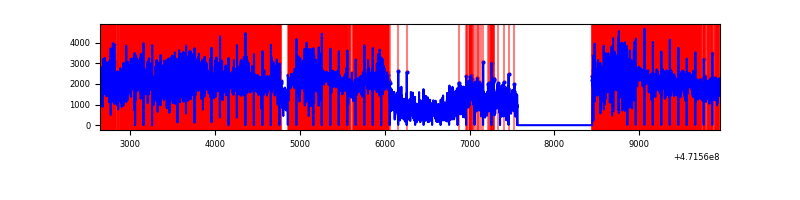 |
| D | 7303 | 6423 | 5244 | 5244 | 71.81% | 81.64% | 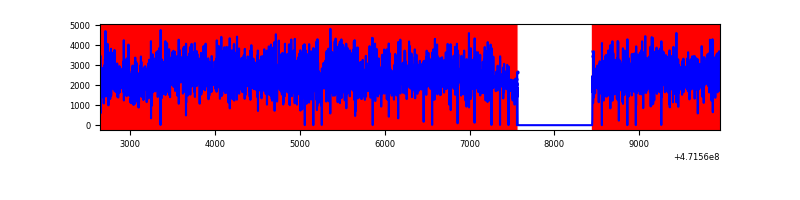 |
Top three noisy pixels from each quadrant. If the there are fewer than three noisy pixels in the level2.evt file, extra rows are filled as -1
| Pixel properties | Quadrant properties | ||||||
|---|---|---|---|---|---|---|---|
| Quadrant | DetID | PixID | Counts | Sigma | Mean | Median | Sigma |
| A | 8 | 8 | 1408167 | 8959.79 | 618 | 601 | 157.1 |
| A | 7 | 64 | 1264803 | 8047.22 | 618 | 601 | 157.1 |
| A | 15 | 63 | 594263 | 3778.93 | 618 | 601 | 157.1 |
| B | 5 | 185 | 168856 | 1165.88 | 676 | 653 | 144.3 |
| B | 4 | 206 | 125083 | 862.48 | 676 | 653 | 144.3 |
| B | 7 | 252 | 63742 | 437.3 | 676 | 653 | 144.3 |
| C | 15 | 147 | 4889707 | 78075.9 | 127 | 122 | 62.6 |
| C | 15 | 148 | 1682249 | 26859.86 | 127 | 122 | 62.6 |
| C | 15 | 233 | 1039266 | 16592.84 | 127 | 122 | 62.6 |
| D | 8 | 129 | 4038452 | 39901.63 | 317 | 305 | 101.2 |
| D | 15 | 142 | 2787026 | 27536.07 | 317 | 305 | 101.2 |
| D | 15 | 168 | 2604034 | 25727.9 | 317 | 305 | 101.2 |
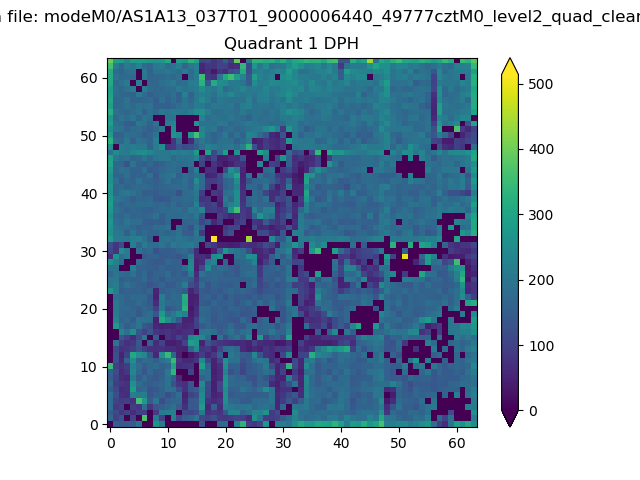
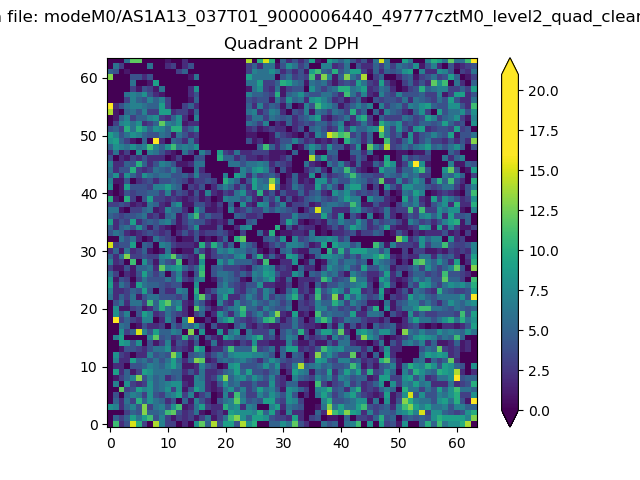
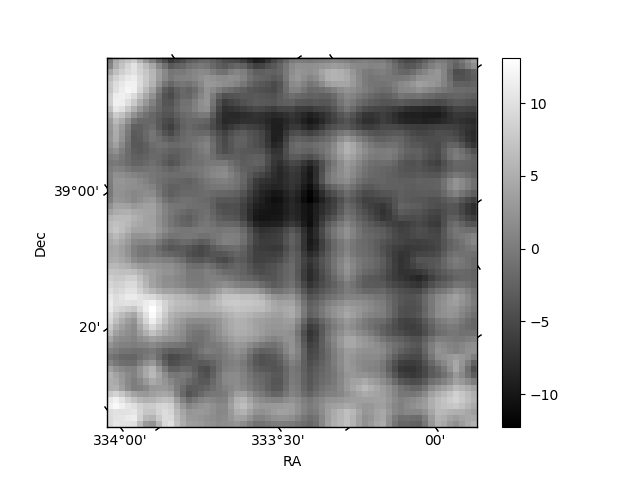
Histogram calculated using DETX and DETY for each event in the final _common_clean file
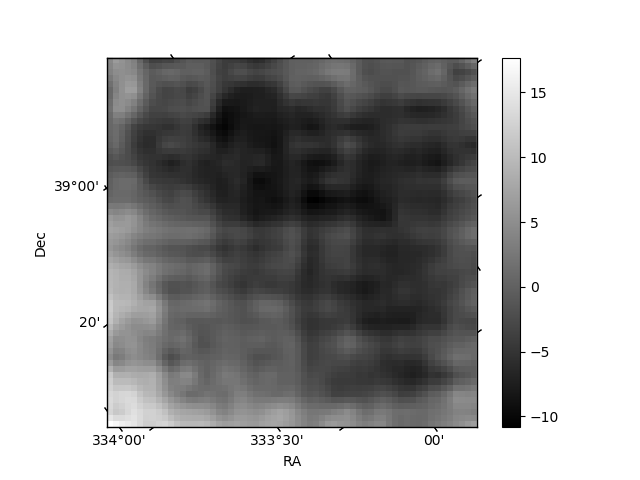
| Quadrant A | 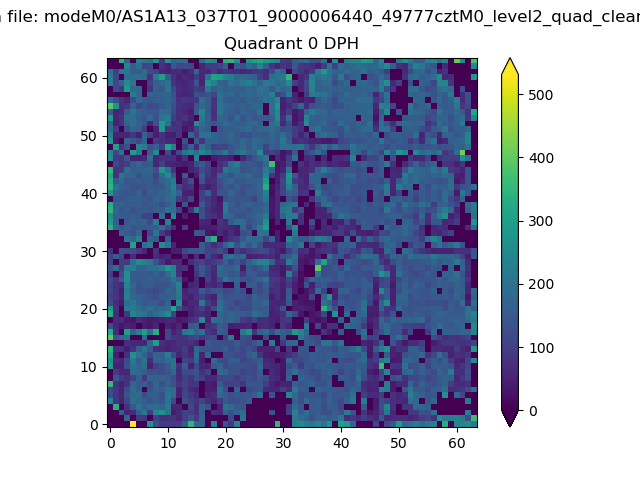 |
 |
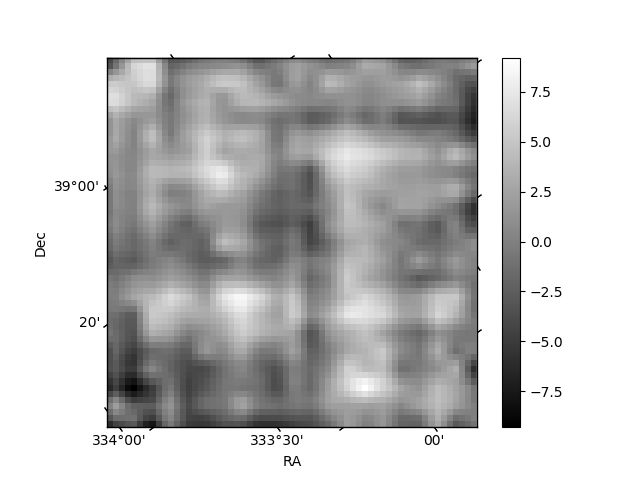
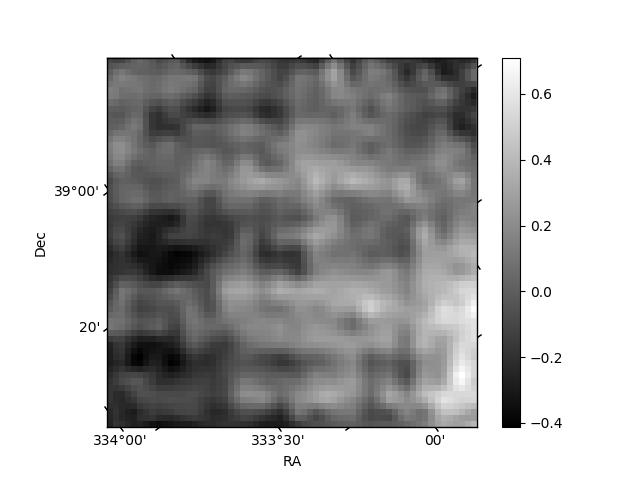
Quadrant B |
|---|---|---|---|
| Quadrant D | 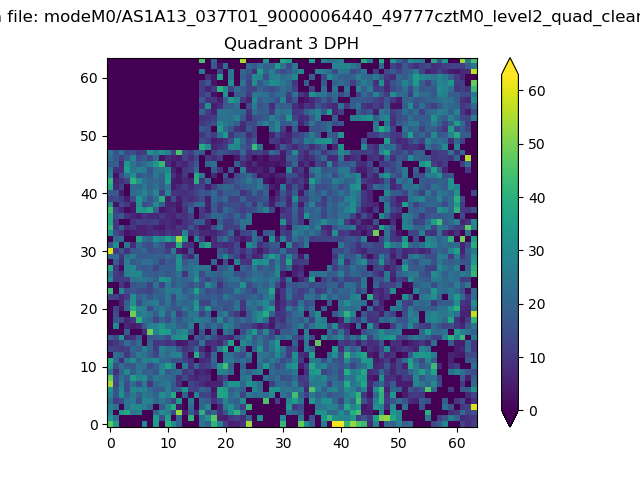 |
 |
Quadrant C |
| Plot type | Count rate plots | Images |
|---|---|---|
| Comparison with Poisson distribution Blue bars denote a histogram of data divided into 1 sec bins. Red curve is a Poisson curve with rate = median count rate of data. |
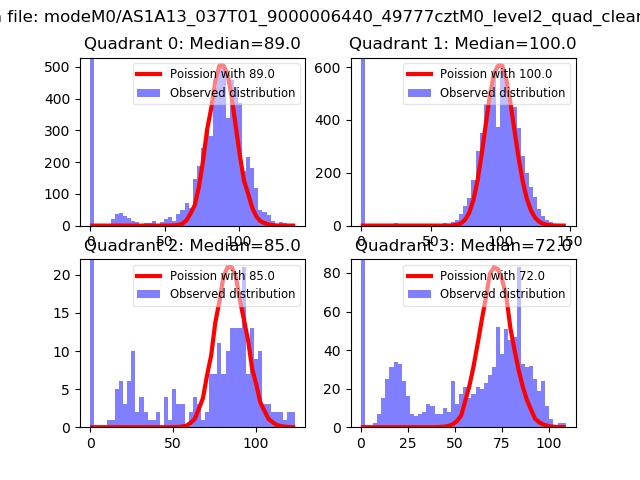 |
 |
| Quadrant-wise count rates Data is divided into 100 sec bins |
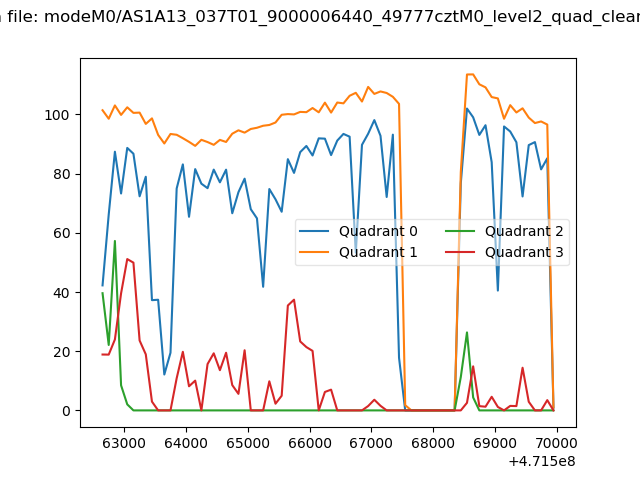 |
|
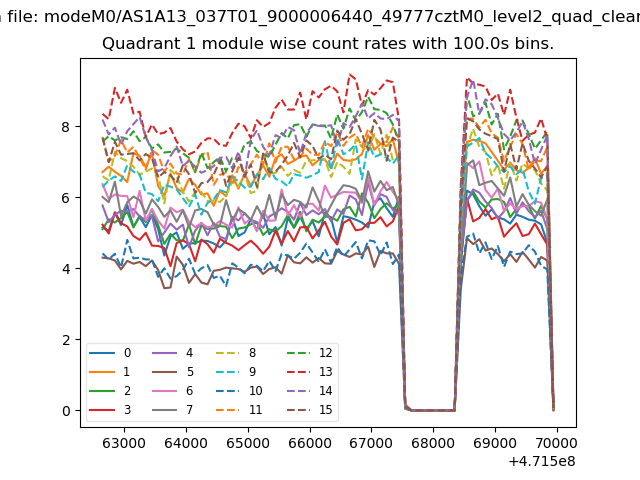
| Module-wise count rates for Quadrant A Data is divided into 100 sec bins |
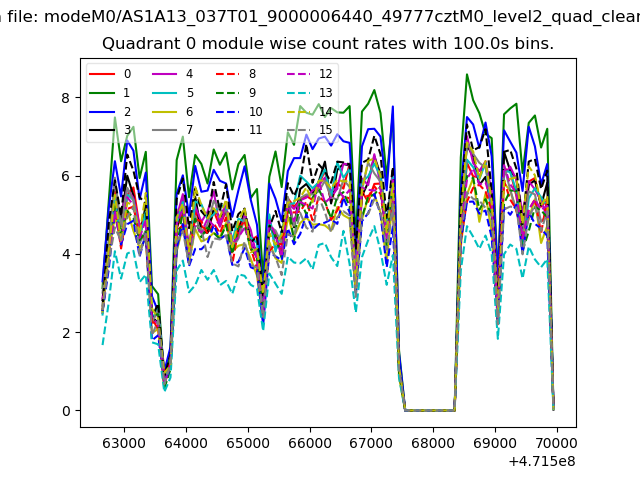 |
 |
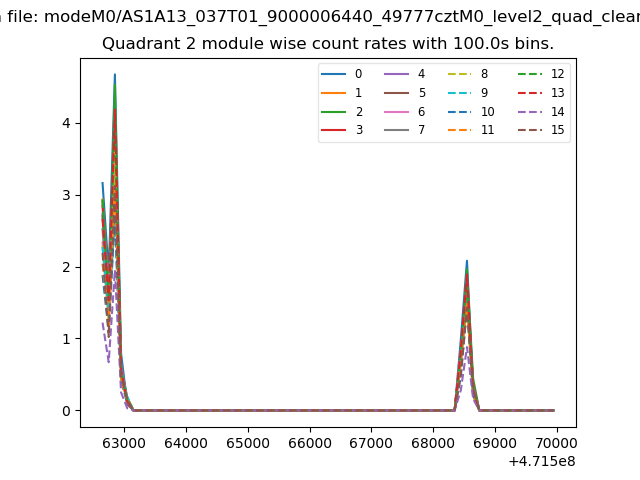
| Module-wise count rates for Quadrant B Data is divided into 100 sec bins |
 |
 |
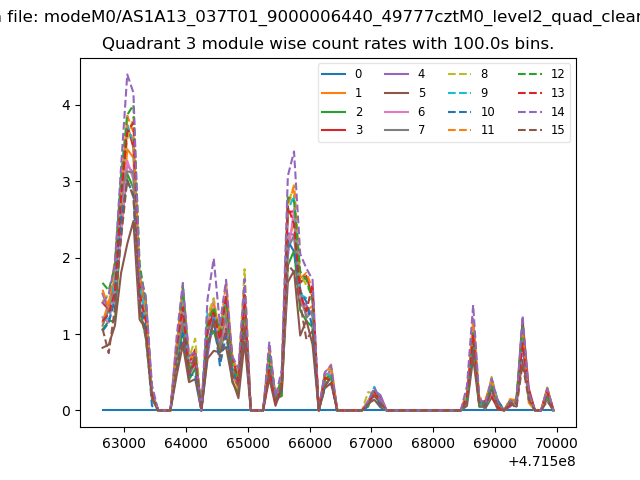
| Module-wise count rates for Quadrant C Data is divided into 100 sec bins |
 |
 |
| Module-wise count rates for Quadrant D Data is divided into 100 sec bins |
 |
 |
| Parameter | Plot |
|---|---|
| CZT HV Monitor | 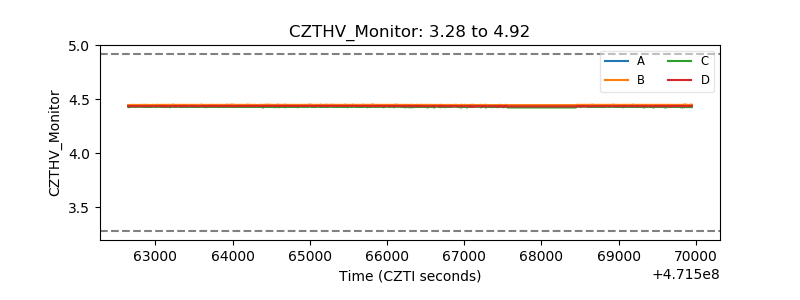 |
| D_VDD | 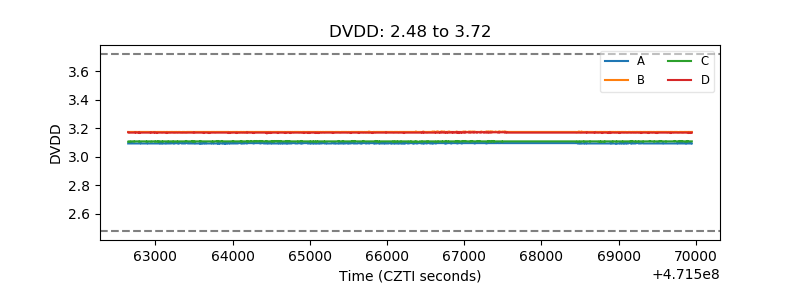 |
| Temperature 1 | 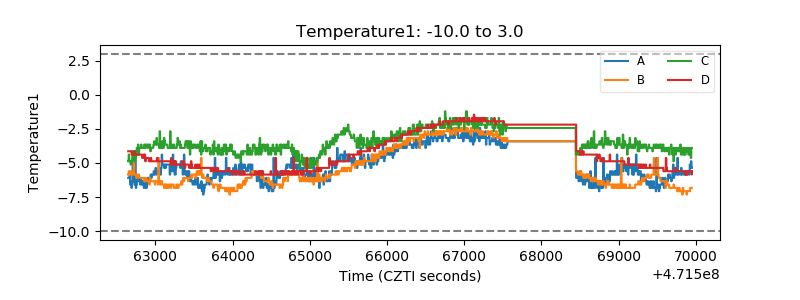 |
| Veto HV Monitor | 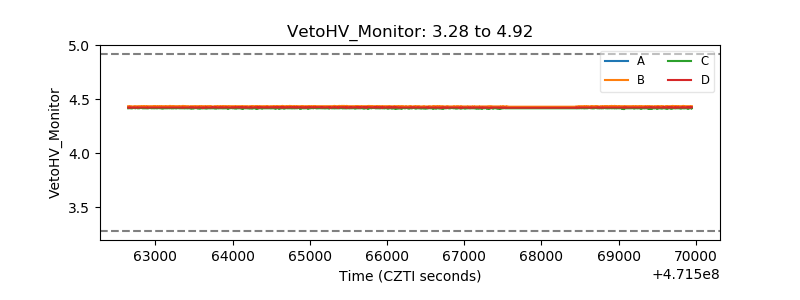 |
| Veto LLD | 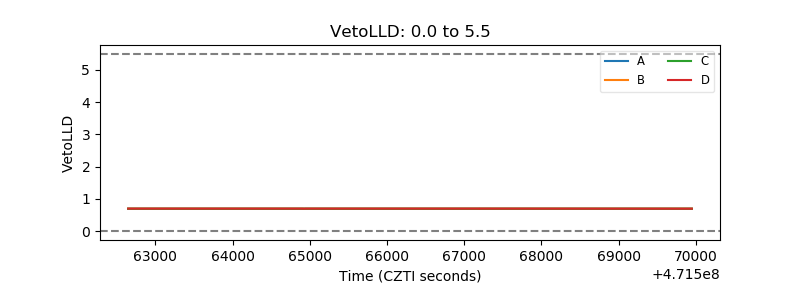 |
| Alpha Counter | 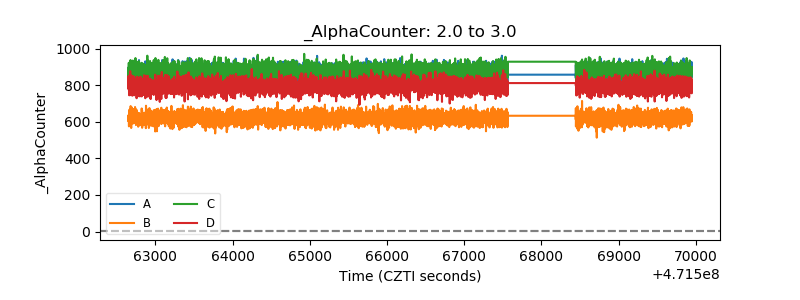 |
| _CPM_Rate | 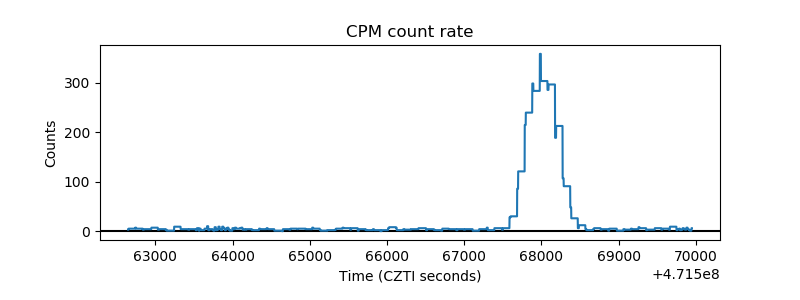 |
| CZT Counter | 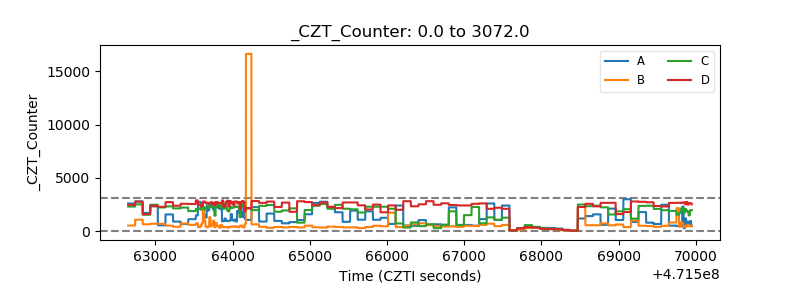 |
| +2.5 Volts monitor | 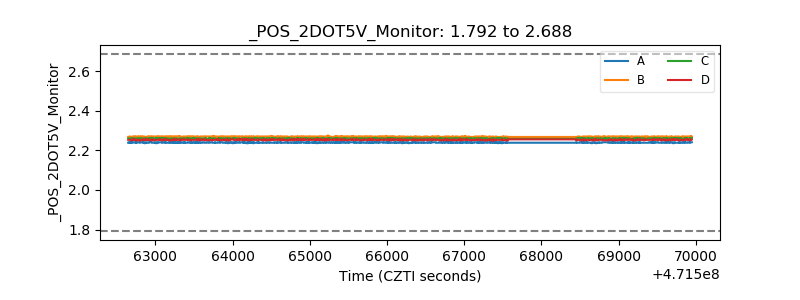 |
| +5 Volts monitor | 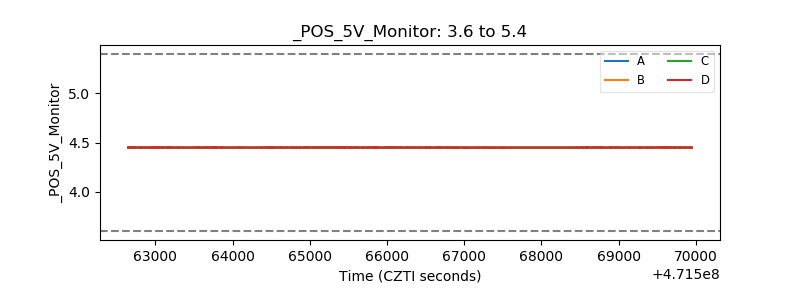 |
| _ROLL_ROT | 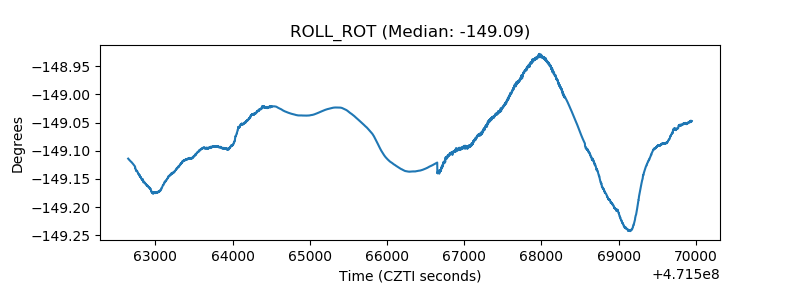 |
| _Roll_DEC | 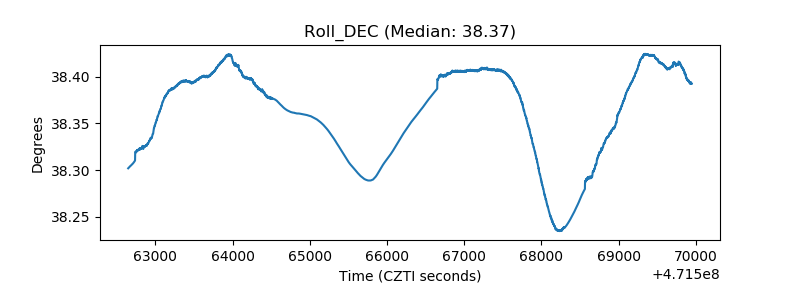 |
| _Roll_RA | 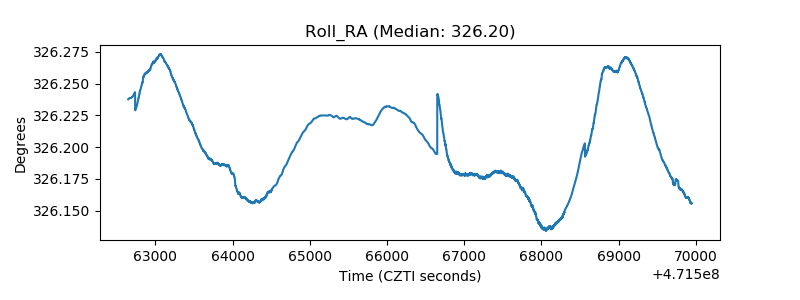 |
| Veto Counter | 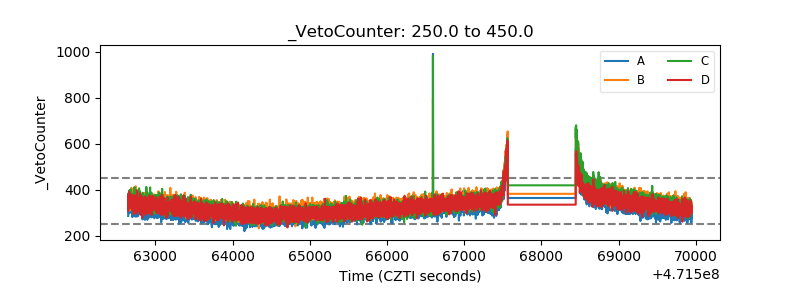 |