| Param | Original file | Final file |
|---|---|---|
| Filename | modeM0/AS1A13_037T01_9000006440_49779cztM0_level2.fits | modeM0/AS1A13_037T01_9000006440_49779cztM0_level2_quad_clean.evt |
| Size (bytes) | 1,105,750,080 | 52,116,480 |
| Size | 1.0 GB | 49.7 MB |
| Events in quadrant A | 8,802,814 | 455,524 |
| Events in quadrant B | 4,312,616 | 638,720 |
| Events in quadrant C | 11,262,394 | 13,829 |
| Events in quadrant D | 16,060,723 | 25,005 |
| Mode M9 | |||
|---|---|---|---|
| Quadrant | BADHDUFLAG | Total packets | Discarded packets |
| A | 0 | 10 | 0 |
| B | 0 | 10 | 0 |
| C | 0 | 10 | 0 |
| D | 0 | 10 | 0 |
| Mode SS | |||
|---|---|---|---|
| Quadrant | BADHDUFLAG | Total packets | Discarded packets |
| A | 0 | 130 | 0 |
| B | 0 | 130 | 0 |
| C | 0 | 130 | 0 |
| D | 0 | 130 | 0 |
| Mode M0 | |||
|---|---|---|---|
| Quadrant | BADHDUFLAG | Total packets | Discarded packets |
| A | 0 | 30659 | 1 |
| B | 0 | 17078 | 1 |
| C | 0 | 37915 | 1 |
| D | 0 | 52105 | 3 |
| Quadrant | Total seconds | Saturated seconds | Saturation percentage |
|---|---|---|---|
| A | 6368 | 1800 | 28.266332% |
| B | 6369 | 279 | 4.380593% |
| C | 6369 | 6261 | 98.304286% |
| D | 6368 | 6174 | 96.953518% |
Noise dominated data is calculated using 1-second bins in cleaned event files. If a bin has >2000 counts, and if more than 50% of those come from <1% of pixels, then it is considered to be noise-dominated and hence unusable.
| Quadrant | # 1 sec bins | Bins with >0 counts | Bins with >2000 counts | High rate bins dominated by noise | Noise dominated (total time) | Noise dominated (detector-on time) | Marked lightcurve |
|---|---|---|---|---|---|---|---|
| A | 7423 | 6368 | 1485 | 1485 | 20.01% | 23.32% | 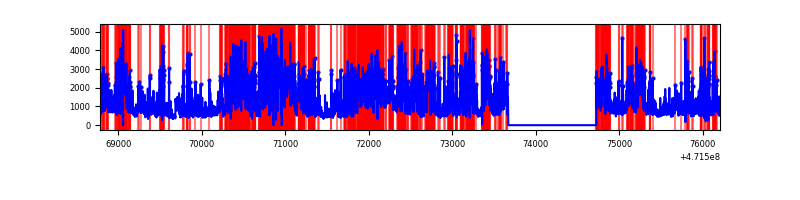 |
| B | 7424 | 6370 | 160 | 160 | 2.16% | 2.51% | 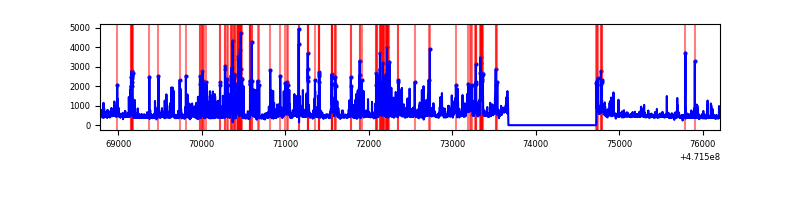 |
| C | 7423 | 6367 | 2136 | 2136 | 28.78% | 33.55% | 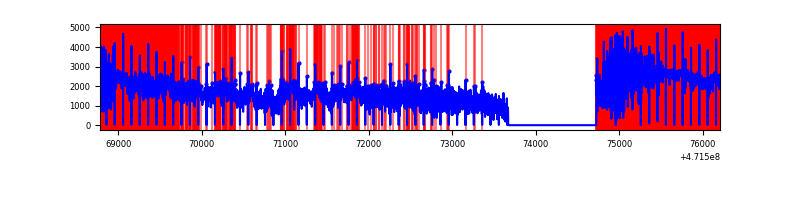 |
| D | 7422 | 6367 | 5450 | 5450 | 73.43% | 85.60% | 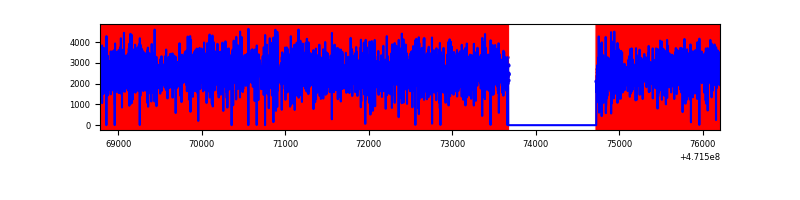 |
Top three noisy pixels from each quadrant. If the there are fewer than three noisy pixels in the level2.evt file, extra rows are filled as -1
| Pixel properties | Quadrant properties | ||||||
|---|---|---|---|---|---|---|---|
| Quadrant | DetID | PixID | Counts | Sigma | Mean | Median | Sigma |
| A | 7 | 64 | 1907480 | 12580.61 | 595 | 578 | 151.6 |
| A | 15 | 63 | 759162 | 5004.69 | 595 | 578 | 151.6 |
| A | 8 | 8 | 589944 | 3888.29 | 595 | 578 | 151.6 |
| B | 4 | 171 | 596394 | 4137.85 | 674 | 653 | 144.0 |
| B | 10 | 128 | 220056 | 1523.91 | 674 | 653 | 144.0 |
| B | 4 | 206 | 153454 | 1061.31 | 674 | 653 | 144.0 |
| C | 15 | 147 | 5048887 | 159100.94 | 69 | 66 | 31.7 |
| C | 15 | 148 | 3193045 | 100618.73 | 69 | 66 | 31.7 |
| C | 15 | 233 | 629433 | 19832.92 | 69 | 66 | 31.7 |
| D | 15 | 142 | 4135849 | 46915.63 | 274 | 261 | 88.1 |
| D | 8 | 129 | 3944256 | 44742.13 | 274 | 261 | 88.1 |
| D | 15 | 168 | 1735417 | 19684.25 | 274 | 261 | 88.1 |
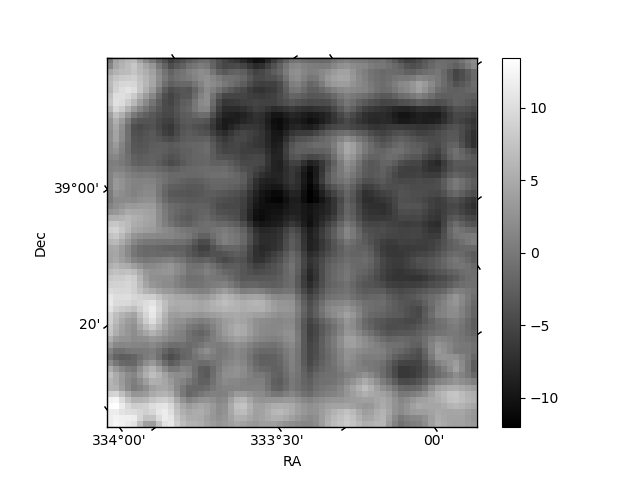
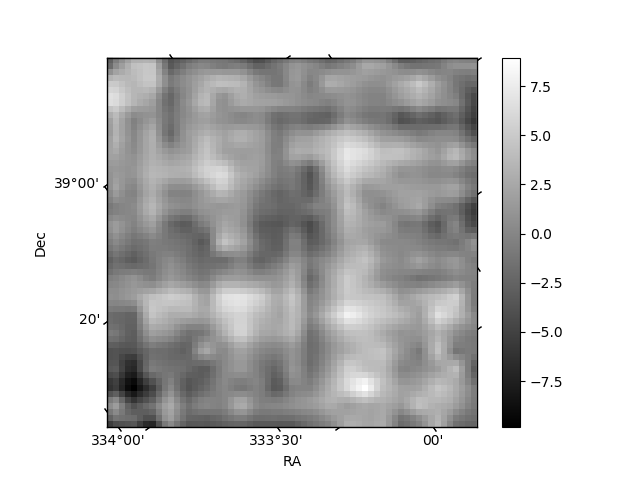
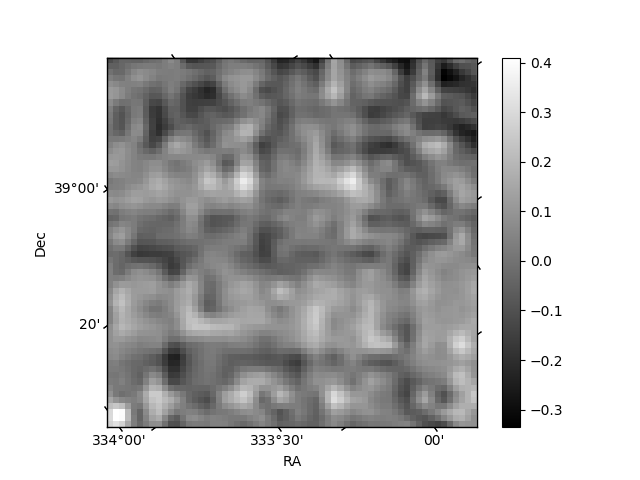
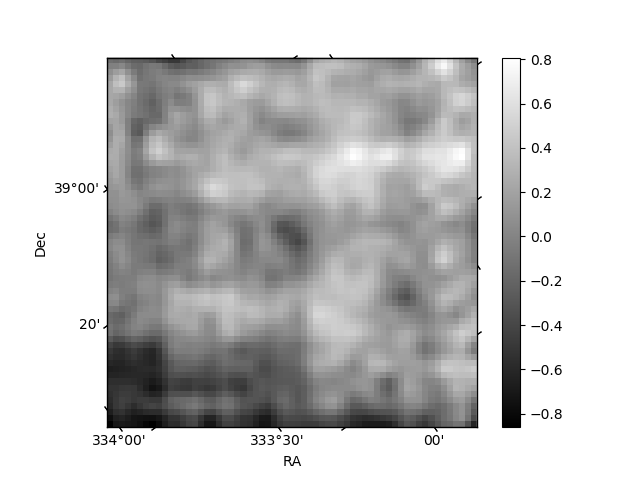
Histogram calculated using DETX and DETY for each event in the final _common_clean file
| Quadrant A | 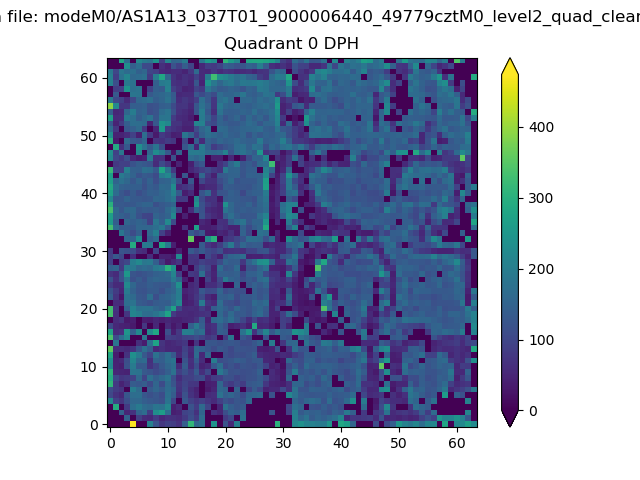 |
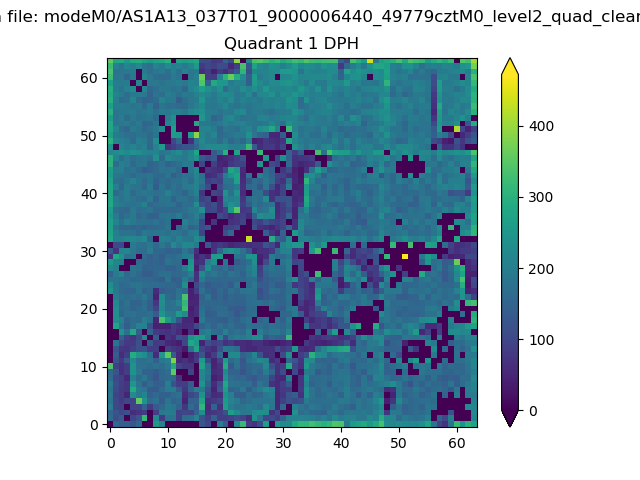 |
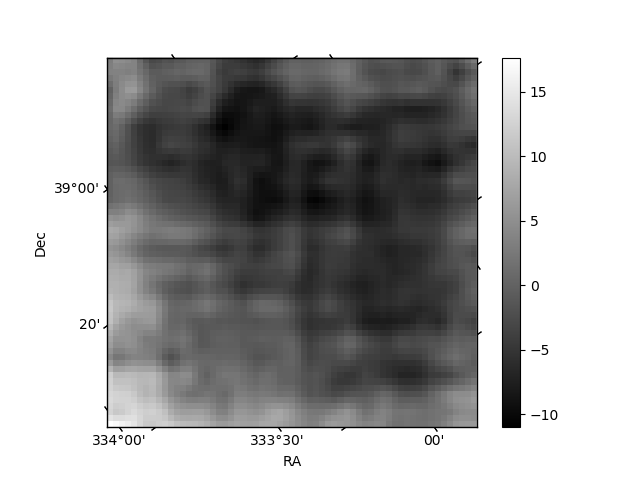
Quadrant B |
|---|---|---|---|
| Quadrant D | 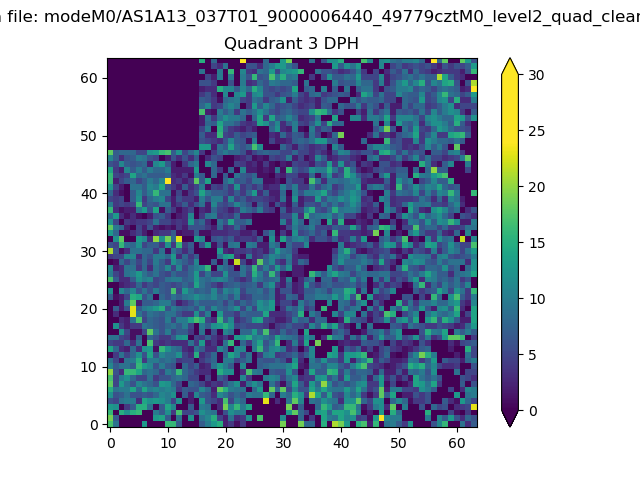 |
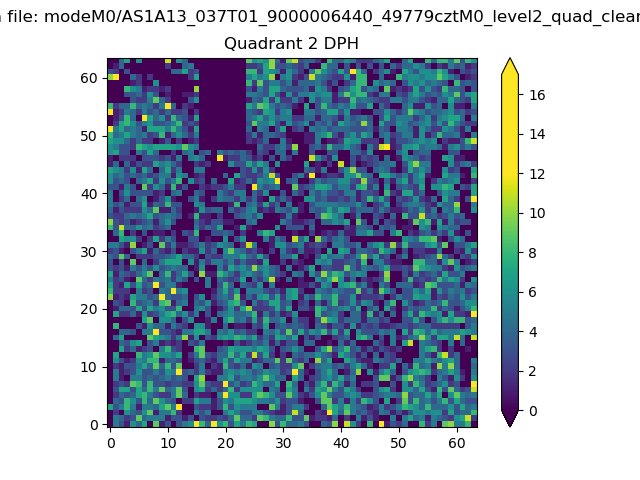 |
Quadrant C |
| Plot type | Count rate plots | Images |
|---|---|---|
| Comparison with Poisson distribution Blue bars denote a histogram of data divided into 1 sec bins. Red curve is a Poisson curve with rate = median count rate of data. |
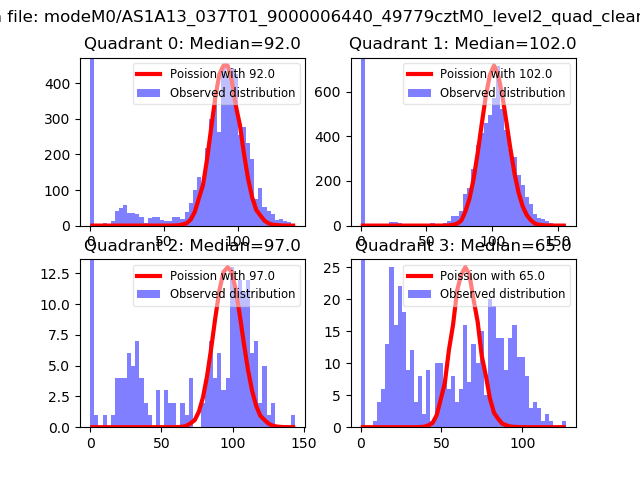 |
 |
| Quadrant-wise count rates Data is divided into 100 sec bins |
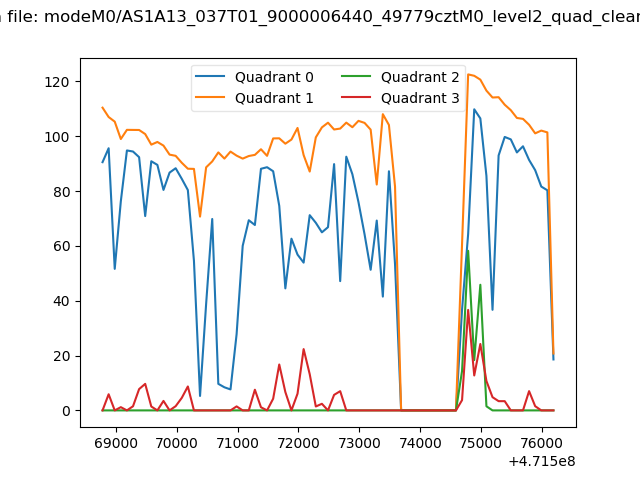 |
|
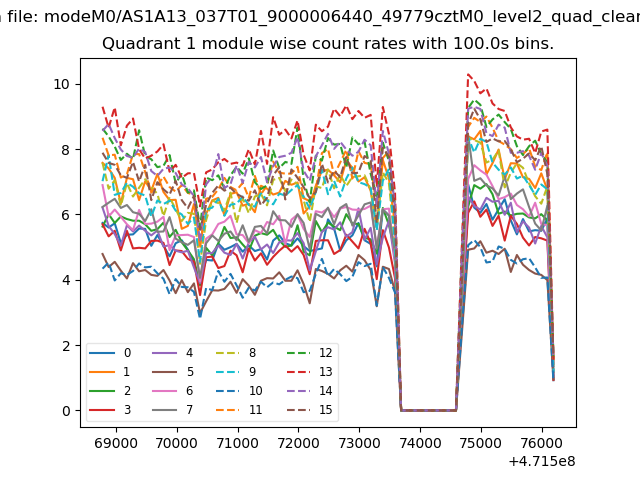
| Module-wise count rates for Quadrant A Data is divided into 100 sec bins |
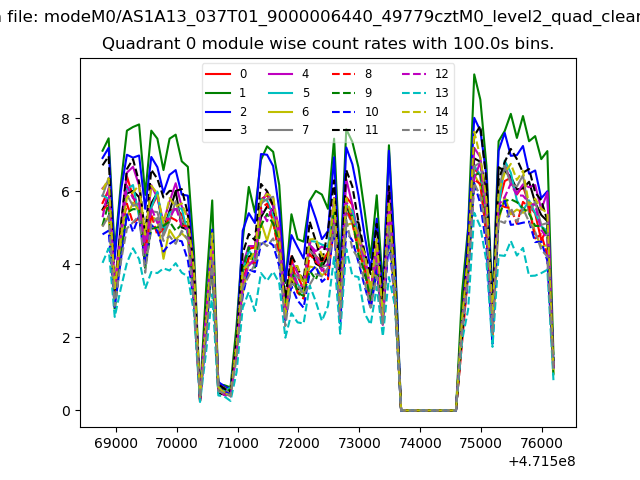 |
 |
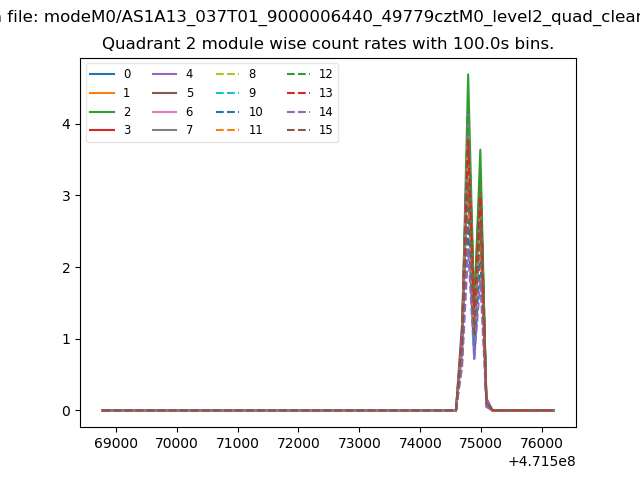
| Module-wise count rates for Quadrant B Data is divided into 100 sec bins |
 |
 |
| Module-wise count rates for Quadrant C Data is divided into 100 sec bins |
 |
 |
| Module-wise count rates for Quadrant D Data is divided into 100 sec bins |
 |
 |
| Parameter | Plot |
|---|---|
| CZT HV Monitor | 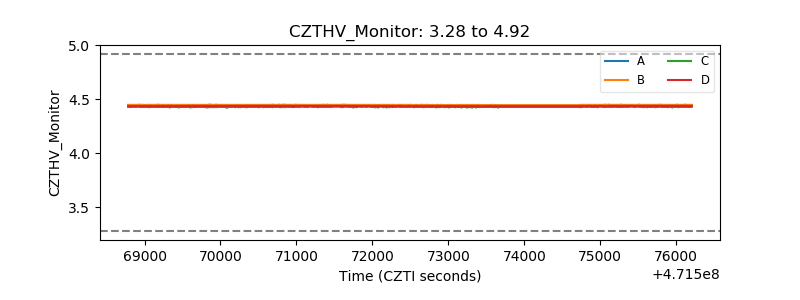 |
| D_VDD | 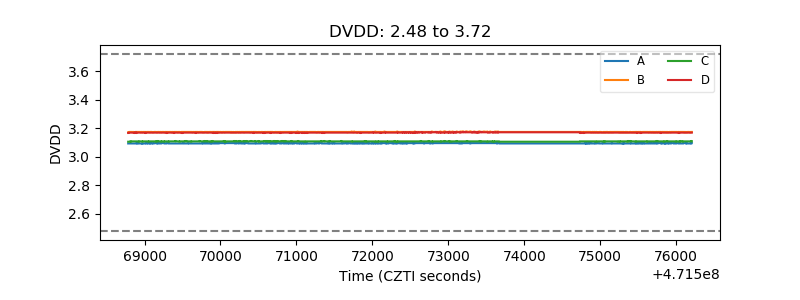 |
| Temperature 1 | 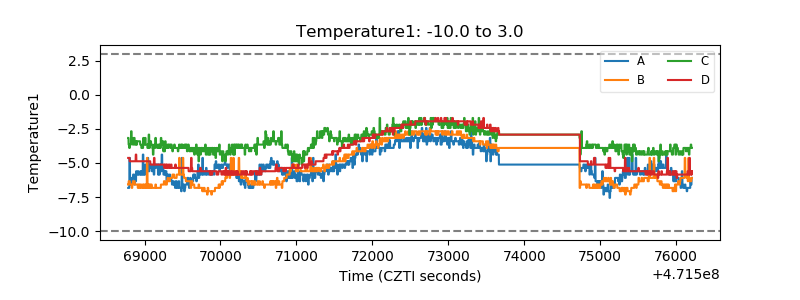 |
| Veto HV Monitor | 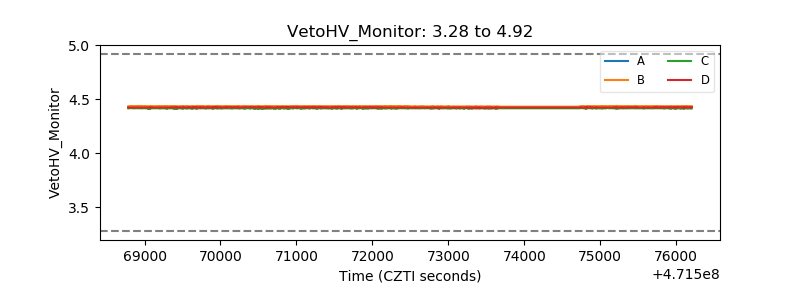 |
| Veto LLD | 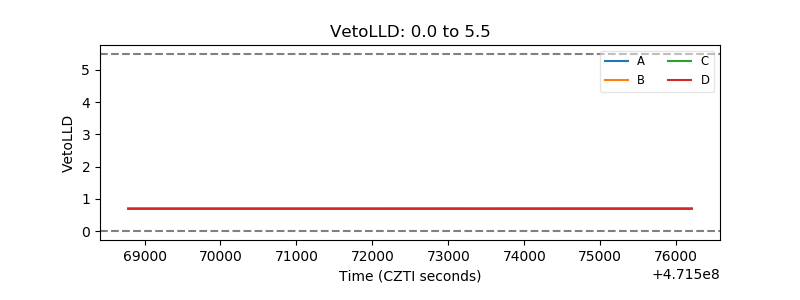 |
| Alpha Counter | 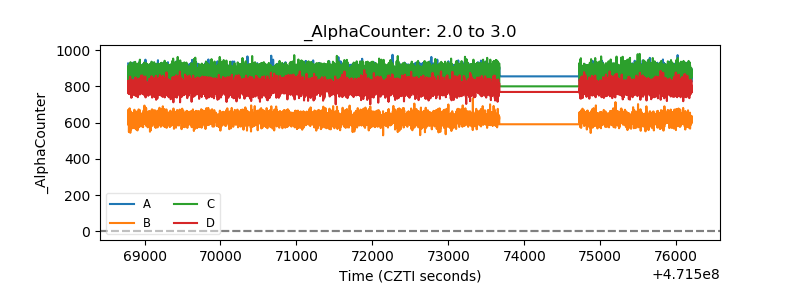 |
| _CPM_Rate | 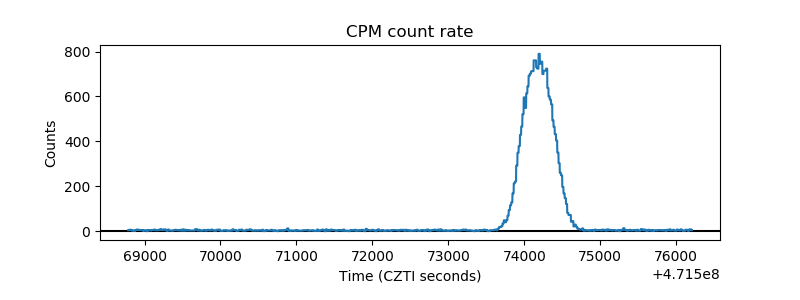 |
| CZT Counter | 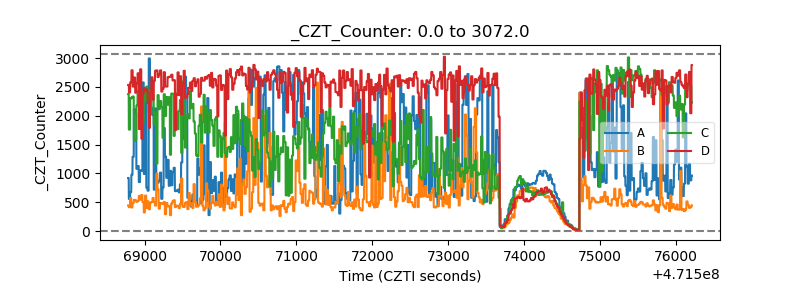 |
| +2.5 Volts monitor | 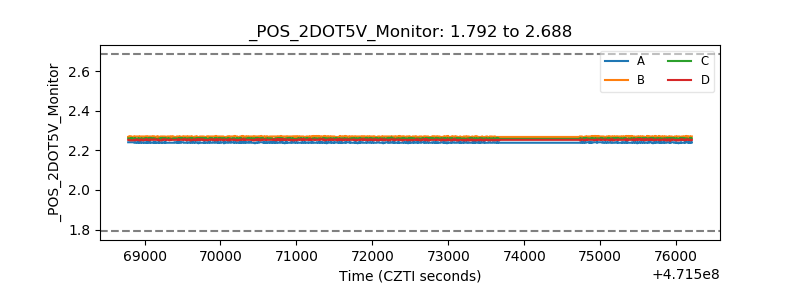 |
| +5 Volts monitor | 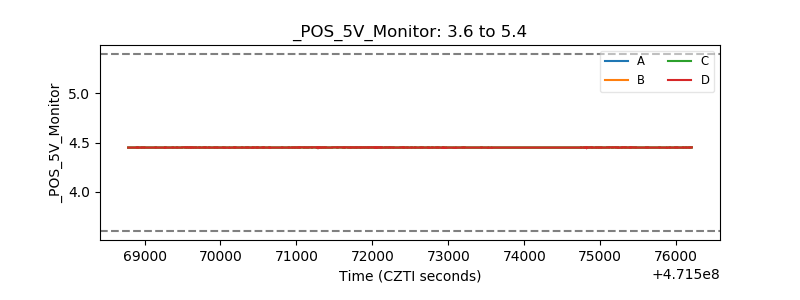 |
| _ROLL_ROT | 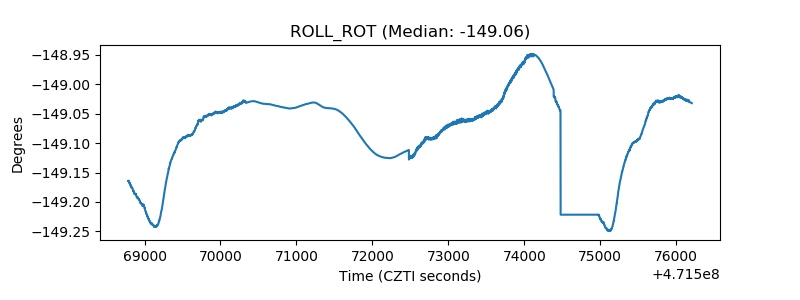 |
| _Roll_DEC | 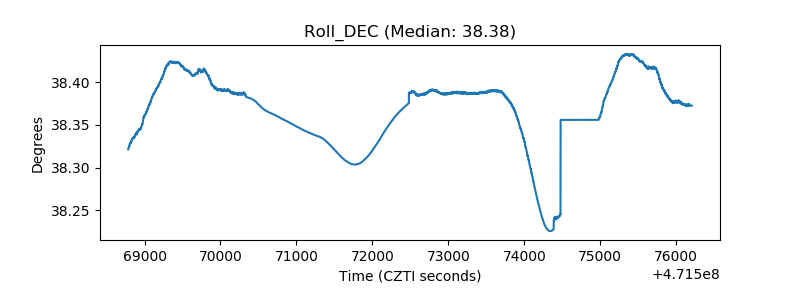 |
| _Roll_RA | 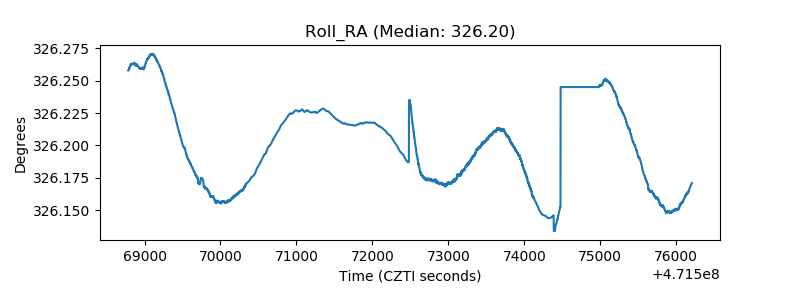 |
| Veto Counter | 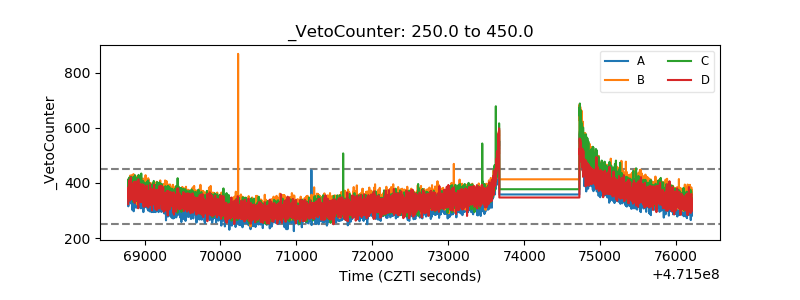 |