| Param | Original file | Final file |
|---|---|---|
| Filename | modeM0/AS1A13_037T01_9000006440_49780cztM0_level2.fits | modeM0/AS1A13_037T01_9000006440_49780cztM0_level2_quad_clean.evt |
| Size (bytes) | 1,062,921,600 | 56,859,840 |
| Size | 1013.7 MB | 54.2 MB |
| Events in quadrant A | 7,464,276 | 543,838 |
| Events in quadrant B | 3,857,549 | 662,886 |
| Events in quadrant C | 11,890,137 | 31,288 |
| Events in quadrant D | 15,643,889 | 41,545 |
| Mode M9 | |||
|---|---|---|---|
| Quadrant | BADHDUFLAG | Total packets | Discarded packets |
| A | 0 | 11 | 0 |
| B | 0 | 11 | 0 |
| C | 0 | 11 | 0 |
| D | 0 | 11 | 0 |
| Mode SS | |||
|---|---|---|---|
| Quadrant | BADHDUFLAG | Total packets | Discarded packets |
| A | 0 | 128 | 0 |
| B | 0 | 128 | 0 |
| C | 0 | 128 | 0 |
| D | 0 | 128 | 0 |
| Mode M0 | |||
|---|---|---|---|
| Quadrant | BADHDUFLAG | Total packets | Discarded packets |
| A | 0 | 26708 | 1 |
| B | 0 | 15643 | 1 |
| C | 0 | 39757 | 1 |
| D | 0 | 50785 | 1 |
| Quadrant | Total seconds | Saturated seconds | Saturation percentage |
|---|---|---|---|
| A | 6332 | 951 | 15.018951% |
| B | 6333 | 235 | 3.710722% |
| C | 6333 | 6091 | 96.178746% |
| D | 6333 | 6004 | 94.804990% |
Noise dominated data is calculated using 1-second bins in cleaned event files. If a bin has >2000 counts, and if more than 50% of those come from <1% of pixels, then it is considered to be noise-dominated and hence unusable.
| Quadrant | # 1 sec bins | Bins with >0 counts | Bins with >2000 counts | High rate bins dominated by noise | Noise dominated (total time) | Noise dominated (detector-on time) | Marked lightcurve |
|---|---|---|---|---|---|---|---|
| A | 7462 | 6333 | 763 | 763 | 10.23% | 12.05% | 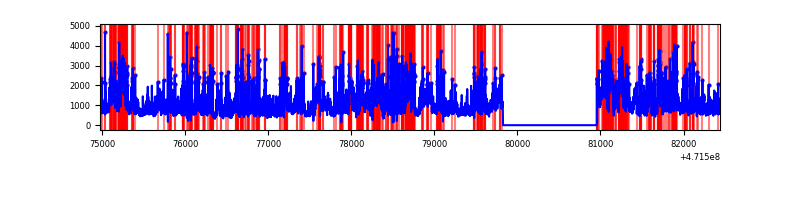 |
| B | 7463 | 6334 | 98 | 98 | 1.31% | 1.55% | 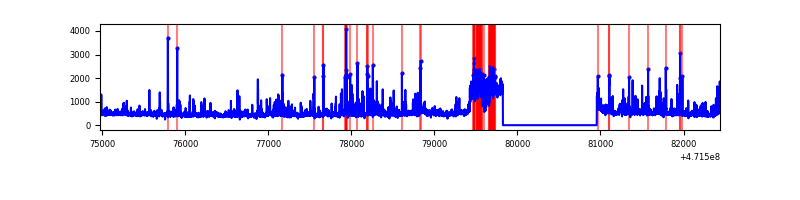 |
| C | 7462 | 6329 | 2987 | 2987 | 40.03% | 47.20% | 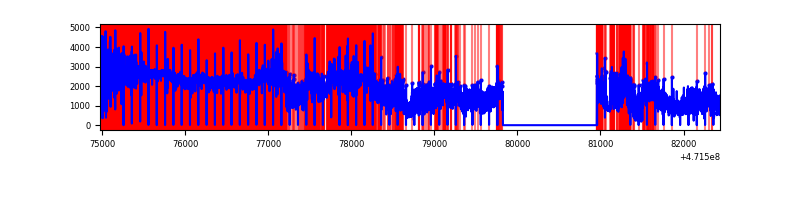 |
| D | 7463 | 6333 | 5205 | 5205 | 69.74% | 82.19% | 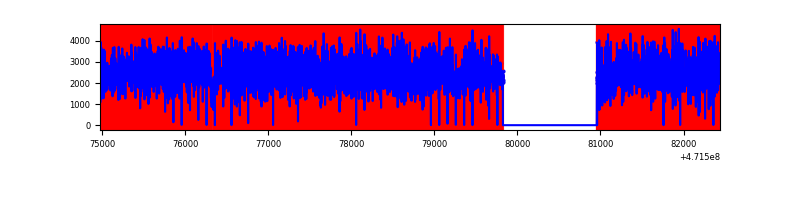 |
Top three noisy pixels from each quadrant. If the there are fewer than three noisy pixels in the level2.evt file, extra rows are filled as -1
| Pixel properties | Quadrant properties | ||||||
|---|---|---|---|---|---|---|---|
| Quadrant | DetID | PixID | Counts | Sigma | Mean | Median | Sigma |
| A | 15 | 63 | 721632 | 4251.02 | 662 | 645 | 169.6 |
| A | 12 | 50 | 568501 | 3348.14 | 662 | 645 | 169.6 |
| A | 7 | 64 | 549605 | 3236.73 | 662 | 645 | 169.6 |
| B | 1 | 207 | 426320 | 2873.07 | 693 | 672 | 148.2 |
| B | 5 | 185 | 128255 | 861.17 | 693 | 672 | 148.2 |
| B | 10 | 128 | 121571 | 816.05 | 693 | 672 | 148.2 |
| C | 15 | 147 | 6379015 | 127486.35 | 102 | 98 | 50.0 |
| C | 15 | 148 | 2060161 | 41171.55 | 102 | 98 | 50.0 |
| C | 1 | 23 | 649447 | 12977.62 | 102 | 98 | 50.0 |
| D | 15 | 142 | 4575557 | 47958.7 | 296 | 284 | 95.4 |
| D | 8 | 129 | 2483360 | 26027.97 | 296 | 284 | 95.4 |
| D | 15 | 168 | 1658950 | 17386.39 | 296 | 284 | 95.4 |
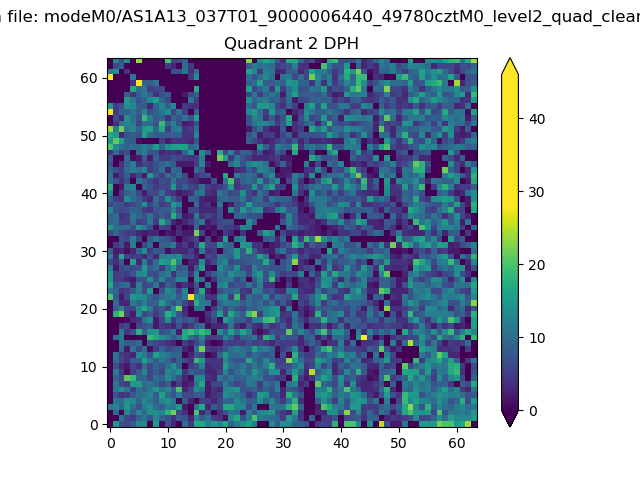
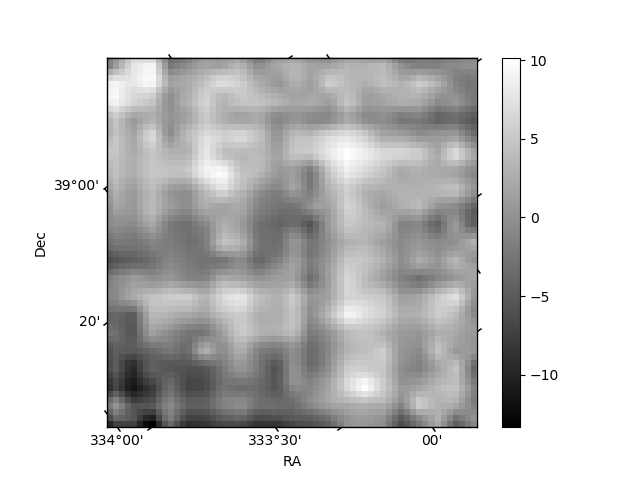
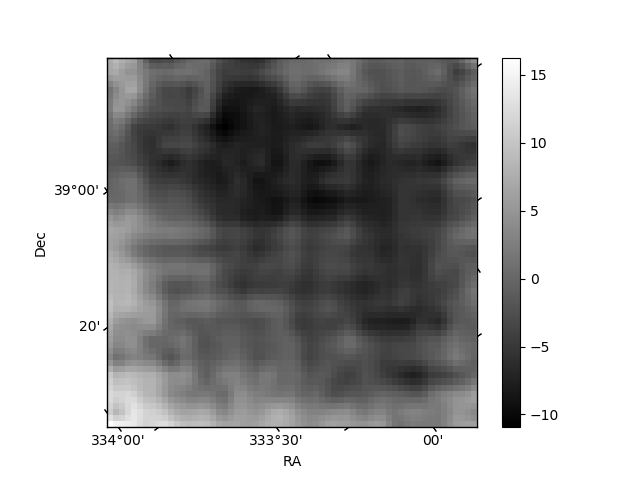
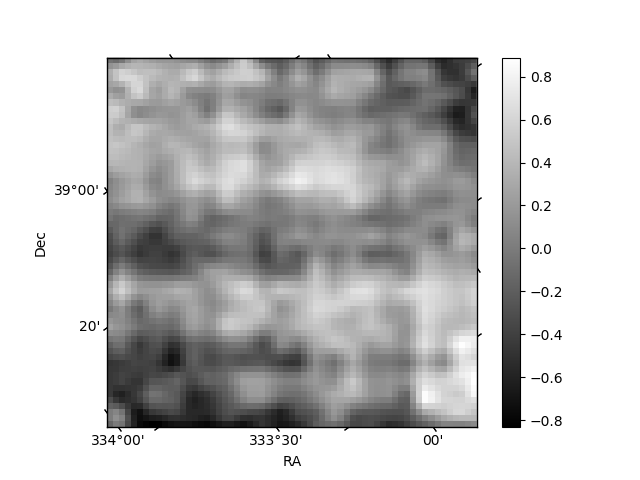
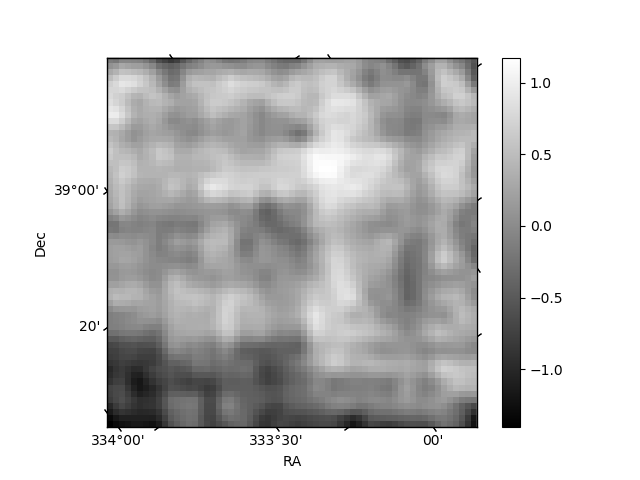
Histogram calculated using DETX and DETY for each event in the final _common_clean file
| Quadrant A | 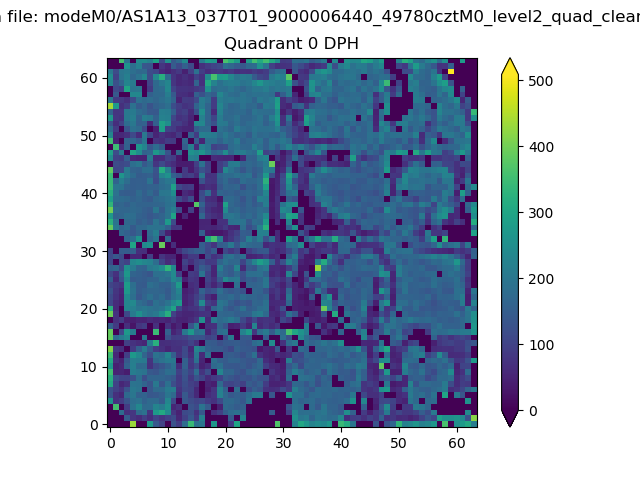 |
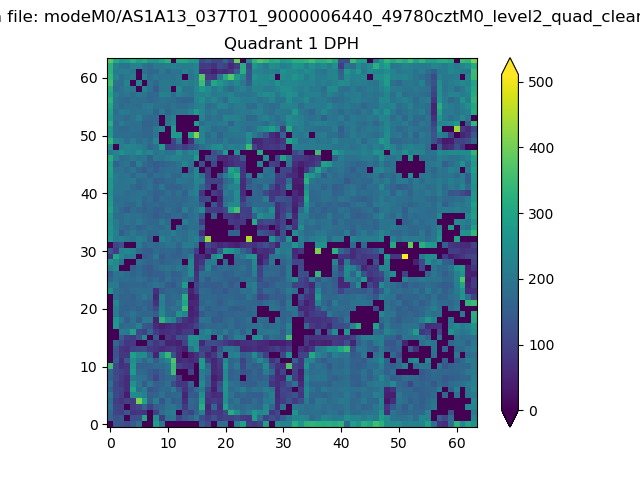 |
Quadrant B |
|---|---|---|---|
| Quadrant D | 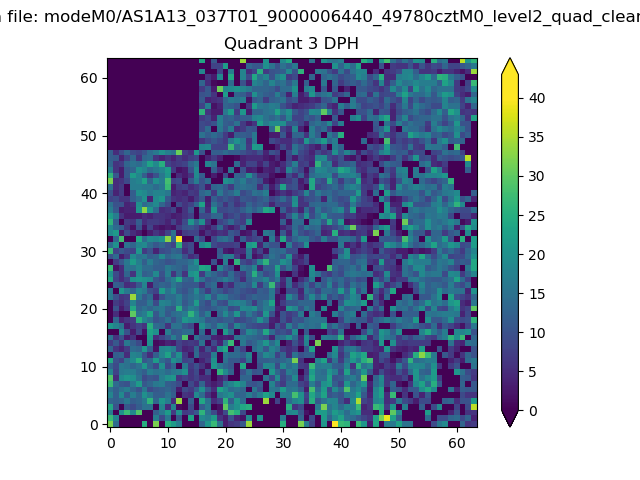 |
 |
Quadrant C |
| Plot type | Count rate plots | Images |
|---|---|---|
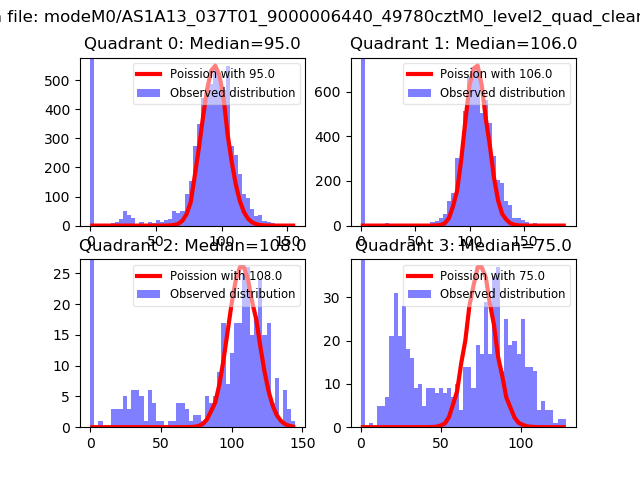
| Comparison with Poisson distribution Blue bars denote a histogram of data divided into 1 sec bins. Red curve is a Poisson curve with rate = median count rate of data. |
 |
 |
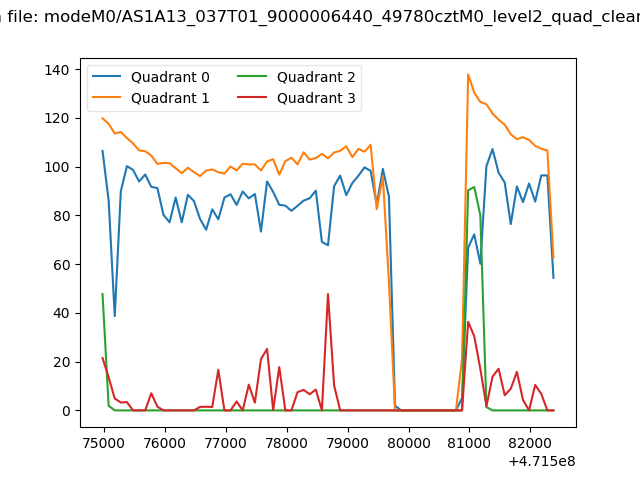
| Quadrant-wise count rates Data is divided into 100 sec bins |
 |
|
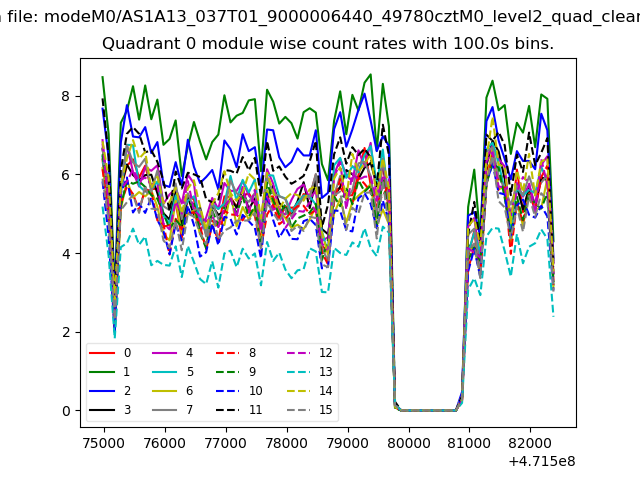
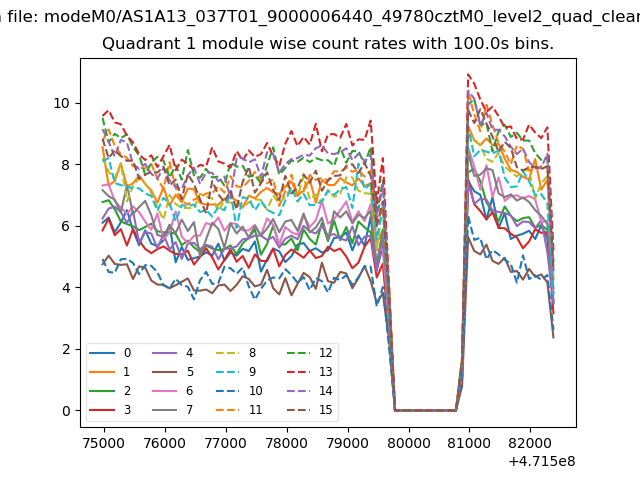
| Module-wise count rates for Quadrant A Data is divided into 100 sec bins |
 |
 |
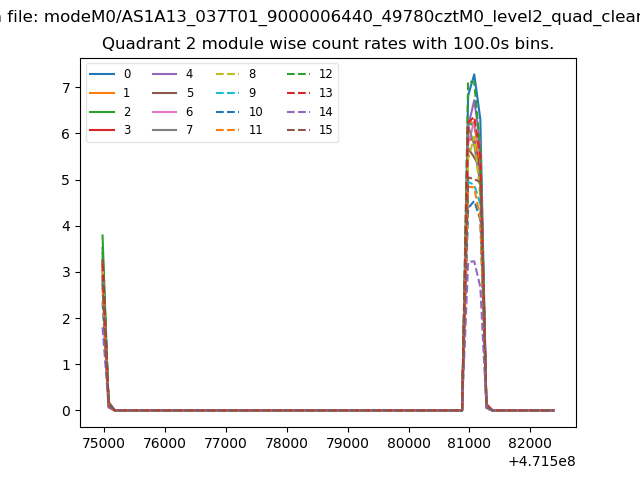
| Module-wise count rates for Quadrant B Data is divided into 100 sec bins |
 |
 |
| Module-wise count rates for Quadrant C Data is divided into 100 sec bins |
 |
 |
| Module-wise count rates for Quadrant D Data is divided into 100 sec bins |
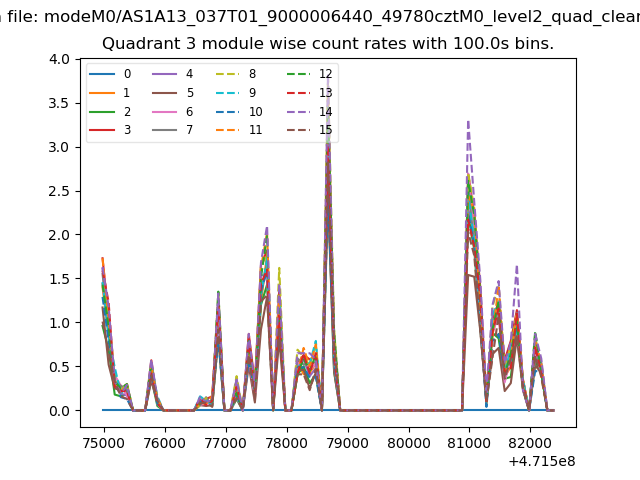 |
 |
| Parameter | Plot |
|---|---|
| CZT HV Monitor | 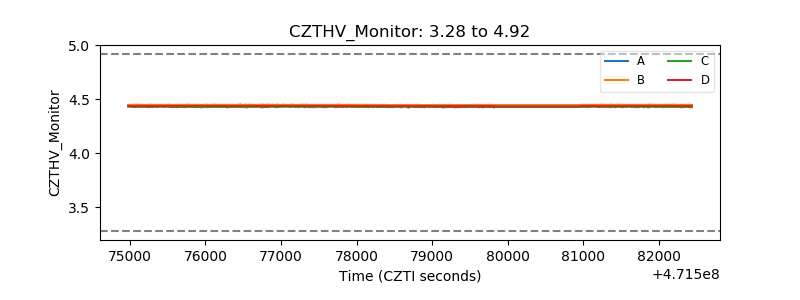 |
| D_VDD | 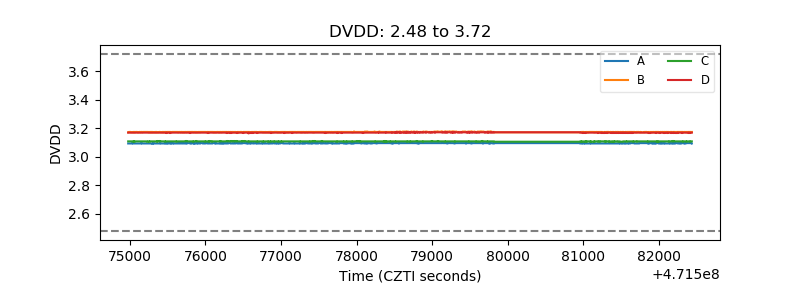 |
| Temperature 1 | 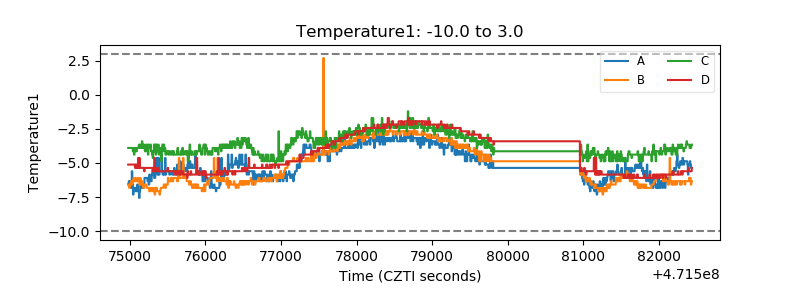 |
| Veto HV Monitor | 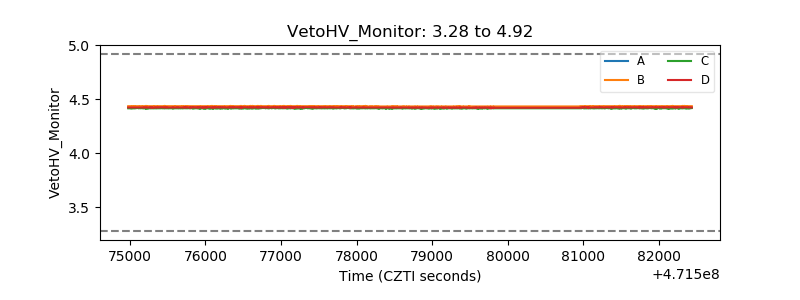 |
| Veto LLD | 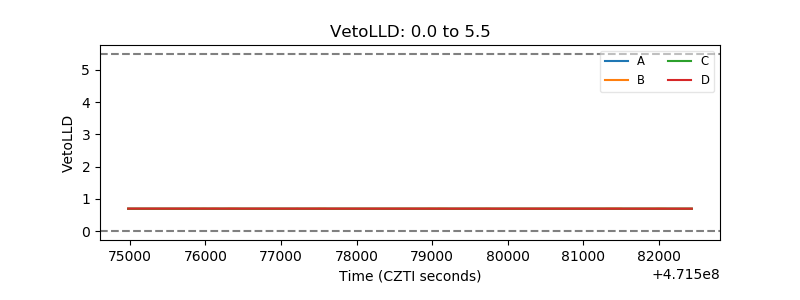 |
| Alpha Counter | 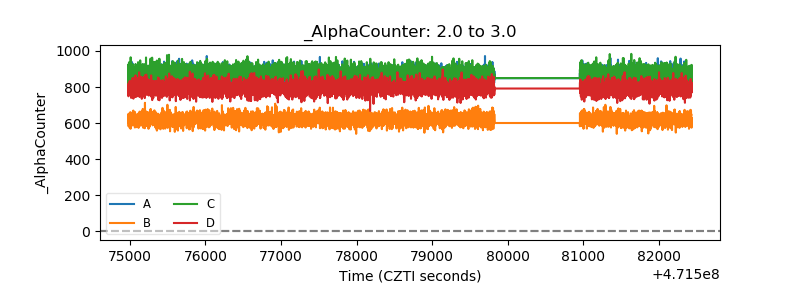 |
| _CPM_Rate | 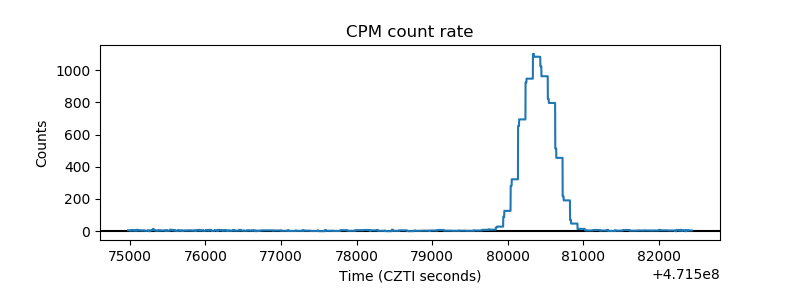 |
| CZT Counter | 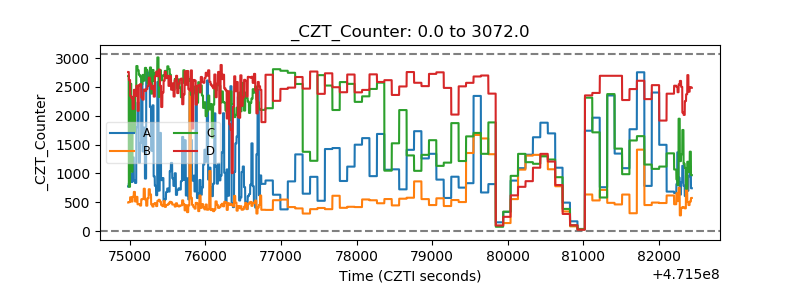 |
| +2.5 Volts monitor |  |
| +5 Volts monitor | 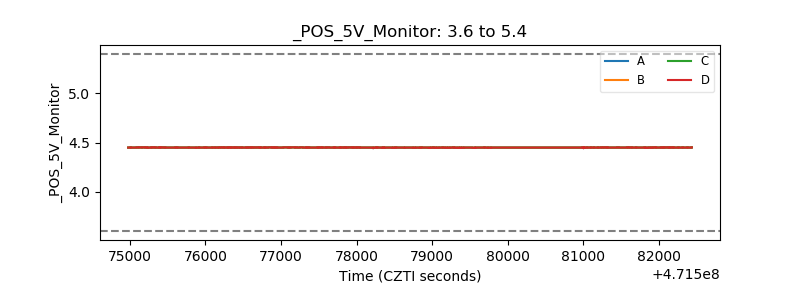 |
| _ROLL_ROT | 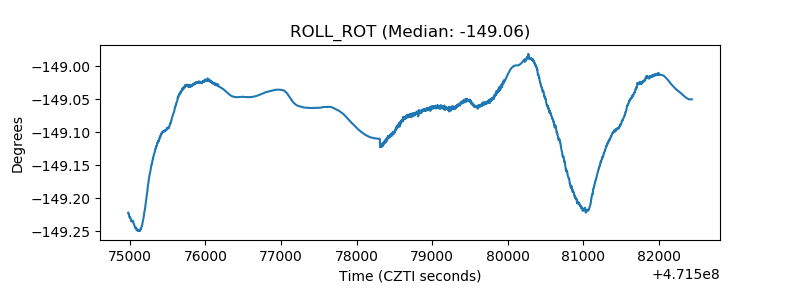 |
| _Roll_DEC | 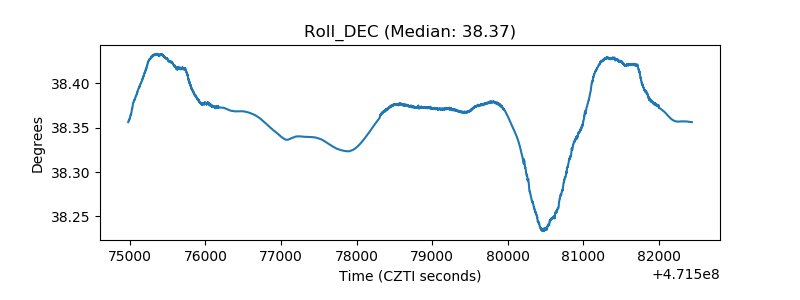 |
| _Roll_RA | 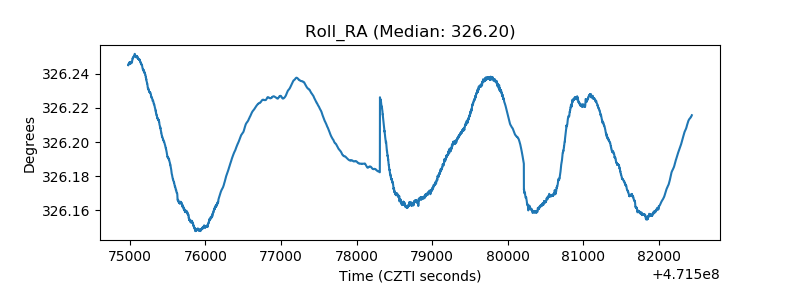 |
| Veto Counter | 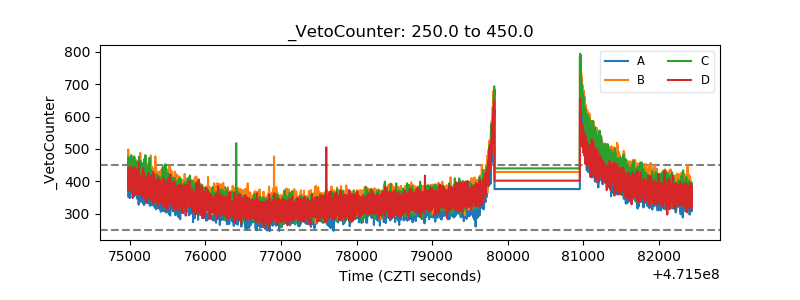 |