| Param | Original file | Final file |
|---|---|---|
| Filename | modeM0/AS1A13_037T01_9000006440_49783cztM0_level2.fits | modeM0/AS1A13_037T01_9000006440_49783cztM0_level2_quad_clean.evt |
| Size (bytes) | 1,023,917,760 | 47,266,560 |
| Size | 976.5 MB | 45.1 MB |
| Events in quadrant A | 10,828,690 | 308,565 |
| Events in quadrant B | 4,216,472 | 646,610 |
| Events in quadrant C | 7,349,379 | 20,822 |
| Events in quadrant D | 15,019,258 | 16,455 |
| Mode M9 | |||
|---|---|---|---|
| Quadrant | BADHDUFLAG | Total packets | Discarded packets |
| A | 0 | 10 | 0 |
| B | 0 | 10 | 0 |
| C | 0 | 10 | 0 |
| D | 0 | 10 | 0 |
| Mode SS | |||
|---|---|---|---|
| Quadrant | BADHDUFLAG | Total packets | Discarded packets |
| A | 0 | 128 | 0 |
| B | 0 | 128 | 0 |
| C | 0 | 128 | 0 |
| D | 0 | 128 | 0 |
| Mode M0 | |||
|---|---|---|---|
| Quadrant | BADHDUFLAG | Total packets | Discarded packets |
| A | 0 | 36511 | 19 |
| B | 0 | 16735 | 4 |
| C | 0 | 26315 | 11 |
| D | 0 | 48923 | 25 |
| Quadrant | Total seconds | Saturated seconds | Saturation percentage |
|---|---|---|---|
| A | 6278 | 3416 | 54.412233% |
| B | 6281 | 423 | 6.734596% |
| C | 6280 | 6111 | 97.308917% |
| D | 6278 | 6141 | 97.817776% |
Noise dominated data is calculated using 1-second bins in cleaned event files. If a bin has >2000 counts, and if more than 50% of those come from <1% of pixels, then it is considered to be noise-dominated and hence unusable.
| Quadrant | # 1 sec bins | Bins with >0 counts | Bins with >2000 counts | High rate bins dominated by noise | Noise dominated (total time) | Noise dominated (detector-on time) | Marked lightcurve |
|---|---|---|---|---|---|---|---|
| A | 7306 | 6281 | 2475 | 2475 | 33.88% | 39.40% | 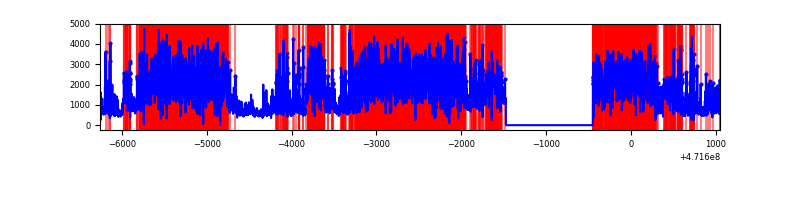 |
| B | 7306 | 6282 | 138 | 138 | 1.89% | 2.20% | 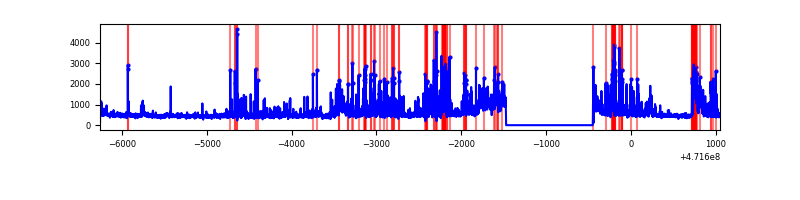 |
| C | 7305 | 6280 | 1006 | 1006 | 13.77% | 16.02% | 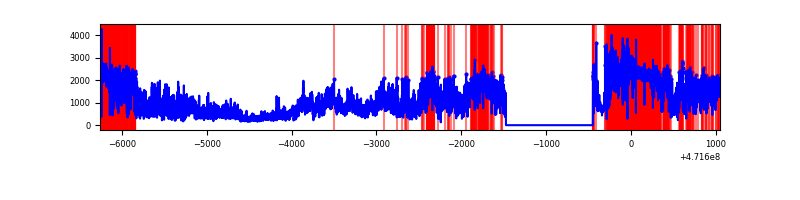 |
| D | 7306 | 6280 | 5033 | 5033 | 68.89% | 80.14% | 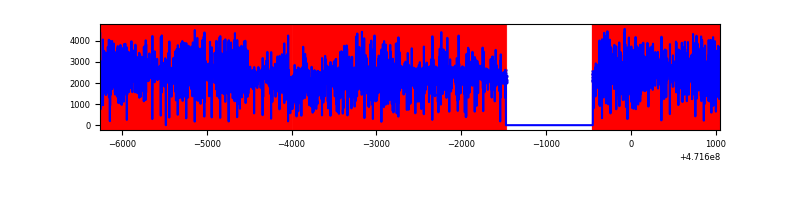 |
Top three noisy pixels from each quadrant. If the there are fewer than three noisy pixels in the level2.evt file, extra rows are filled as -1
| Pixel properties | Quadrant properties | ||||||
|---|---|---|---|---|---|---|---|
| Quadrant | DetID | PixID | Counts | Sigma | Mean | Median | Sigma |
| A | 8 | 8 | 5827213 | 45292.16 | 498 | 485 | 128.6 |
| A | 15 | 63 | 836197 | 6496.13 | 498 | 485 | 128.6 |
| A | 6 | 250 | 419796 | 3259.38 | 498 | 485 | 128.6 |
| B | 4 | 171 | 579040 | 3943.04 | 686 | 665 | 146.7 |
| B | 1 | 207 | 229393 | 1559.34 | 686 | 665 | 146.7 |
| B | 4 | 206 | 141724 | 961.66 | 686 | 665 | 146.7 |
| C | 15 | 147 | 3754763 | 126963.62 | 68 | 66 | 29.6 |
| C | 15 | 148 | 1215978 | 41115.59 | 68 | 66 | 29.6 |
| C | 15 | 197 | 410222 | 13869.27 | 68 | 66 | 29.6 |
| D | 8 | 129 | 5653178 | 81720.62 | 202 | 192 | 69.2 |
| D | 15 | 142 | 4275405 | 61803.27 | 202 | 192 | 69.2 |
| D | 15 | 168 | 836925 | 12095.97 | 202 | 192 | 69.2 |
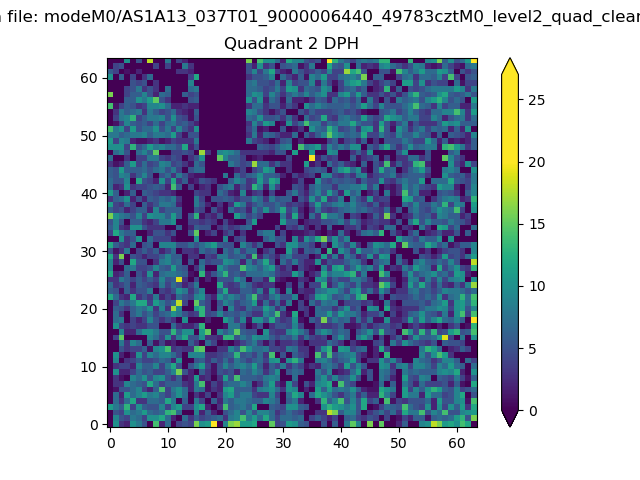
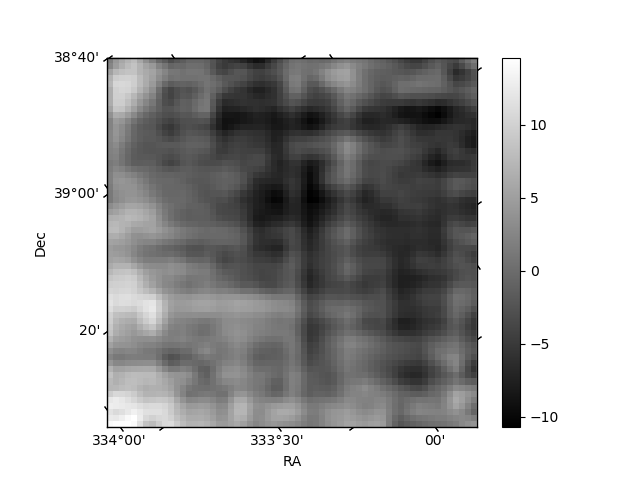
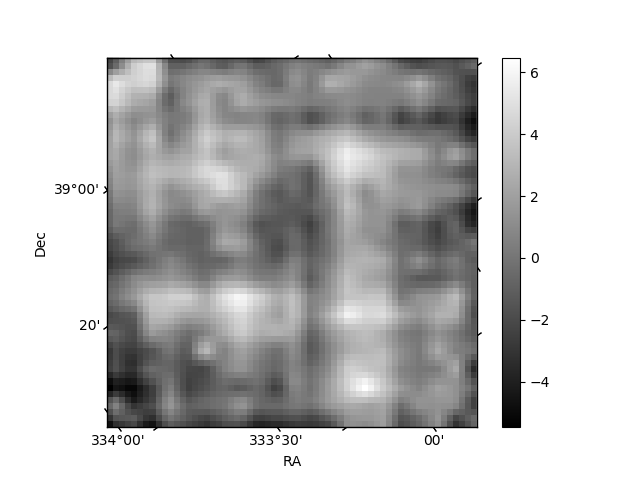
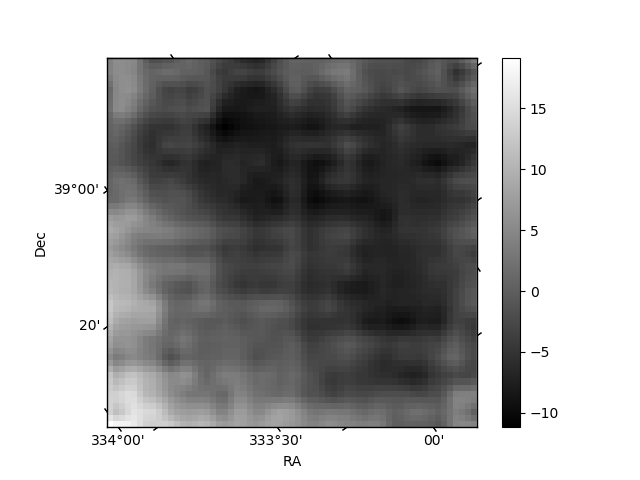
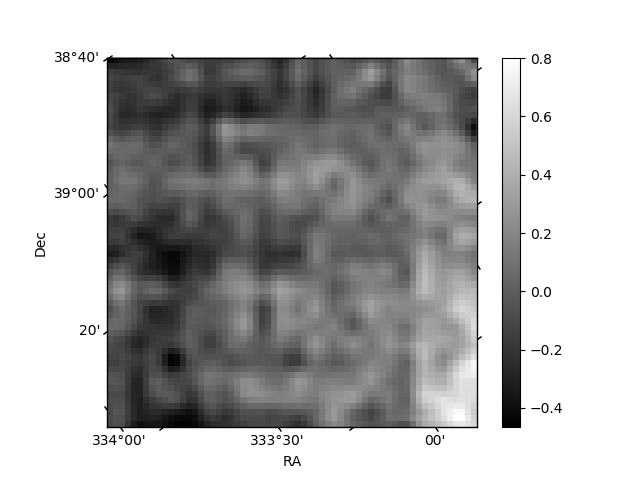
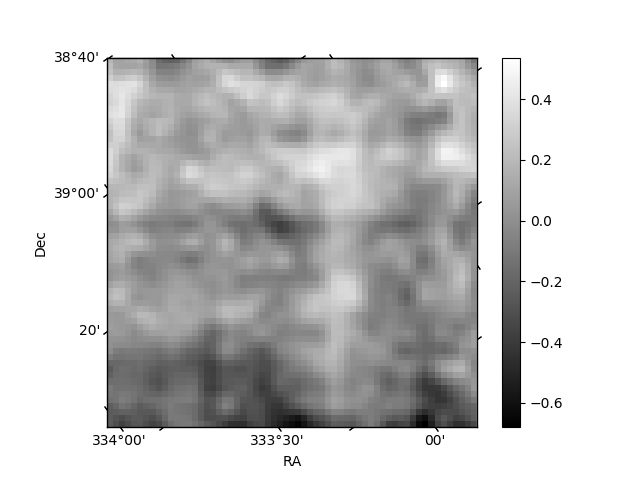
Histogram calculated using DETX and DETY for each event in the final _common_clean file
| Quadrant A | 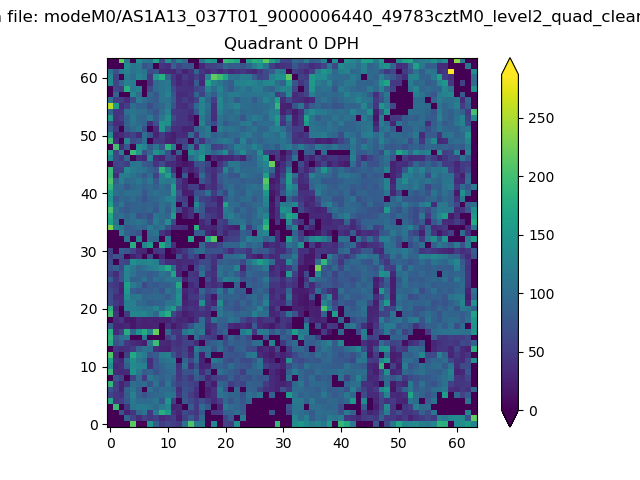 |
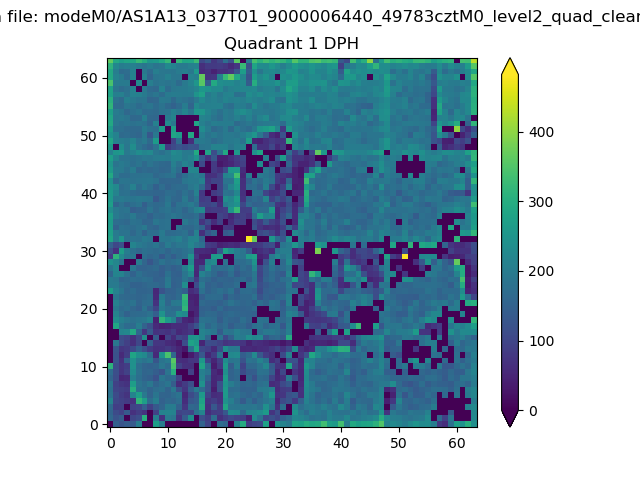 |
Quadrant B |
|---|---|---|---|
| Quadrant D | 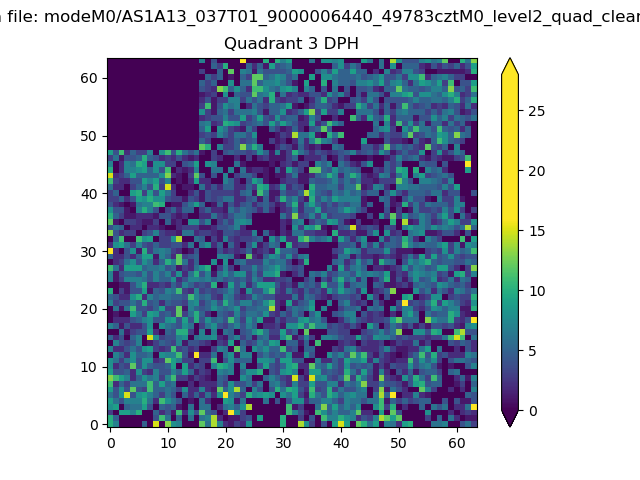 |
 |
Quadrant C |
| Plot type | Count rate plots | Images |
|---|---|---|
| Comparison with Poisson distribution Blue bars denote a histogram of data divided into 1 sec bins. Red curve is a Poisson curve with rate = median count rate of data. |
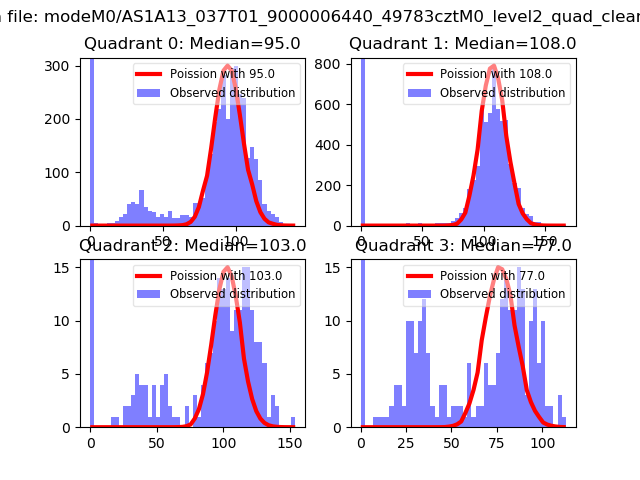 |
 |
| Quadrant-wise count rates Data is divided into 100 sec bins |
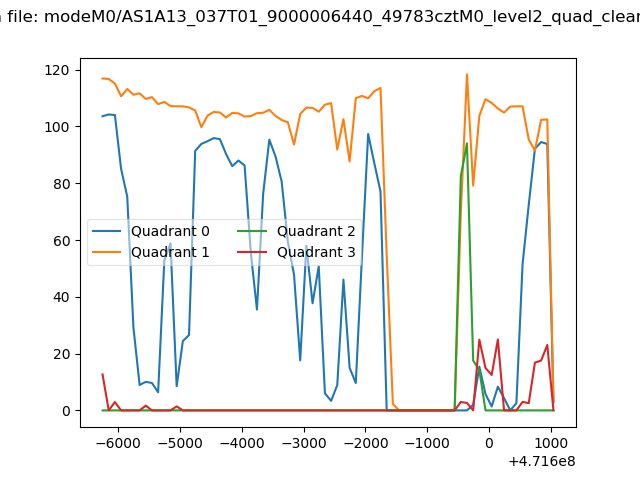 |
|
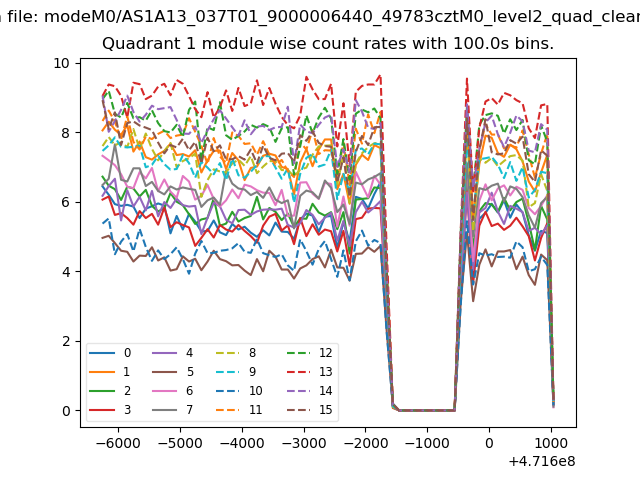
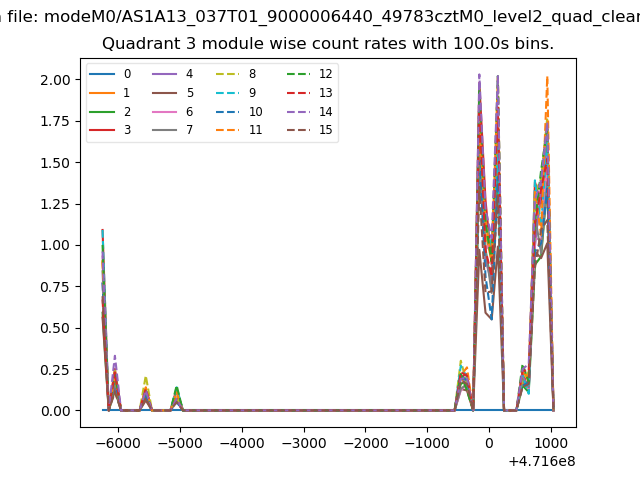
| Module-wise count rates for Quadrant A Data is divided into 100 sec bins |
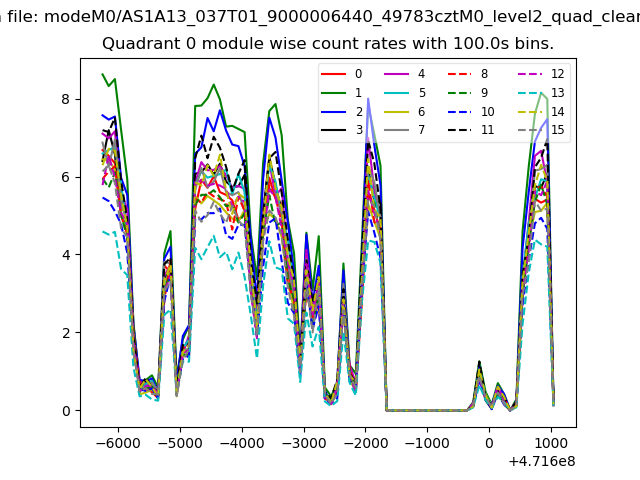 |
 |
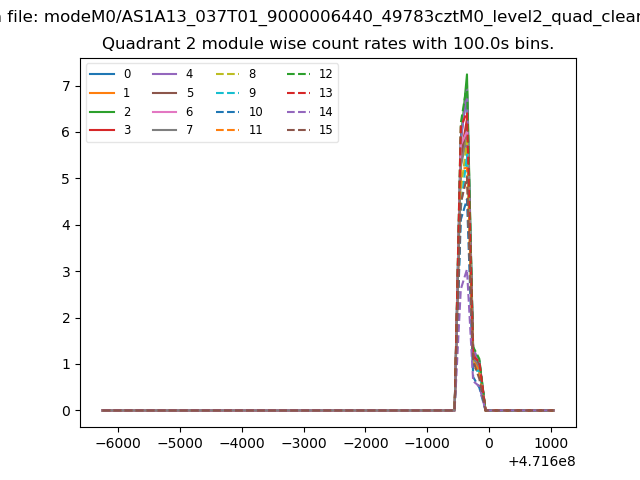
| Module-wise count rates for Quadrant B Data is divided into 100 sec bins |
 |
 |
| Module-wise count rates for Quadrant C Data is divided into 100 sec bins |
 |
 |
| Module-wise count rates for Quadrant D Data is divided into 100 sec bins |
 |
 |
| Parameter | Plot |
|---|---|
| CZT HV Monitor | 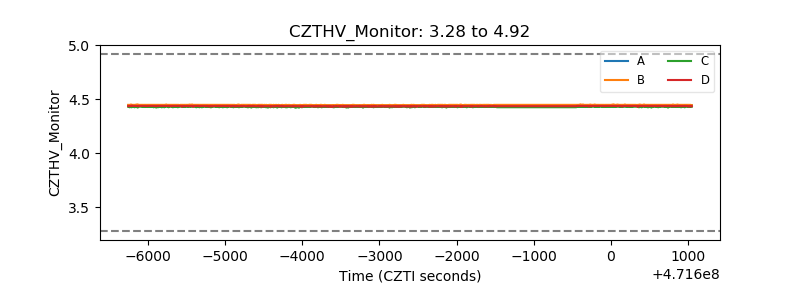 |
| D_VDD | 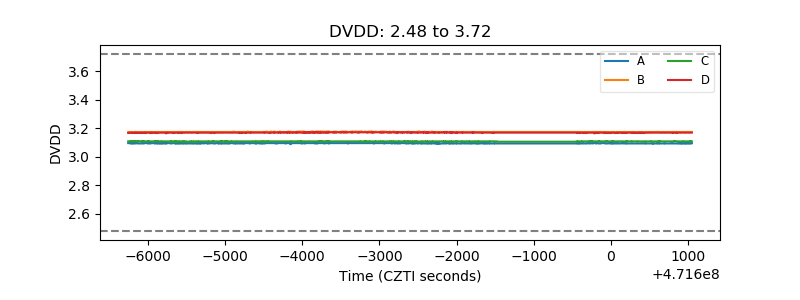 |
| Temperature 1 | 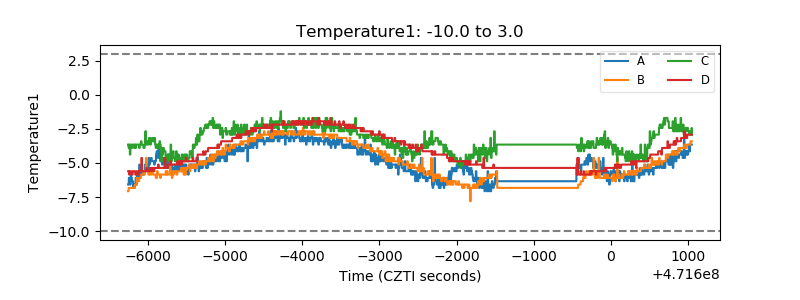 |
| Veto HV Monitor | 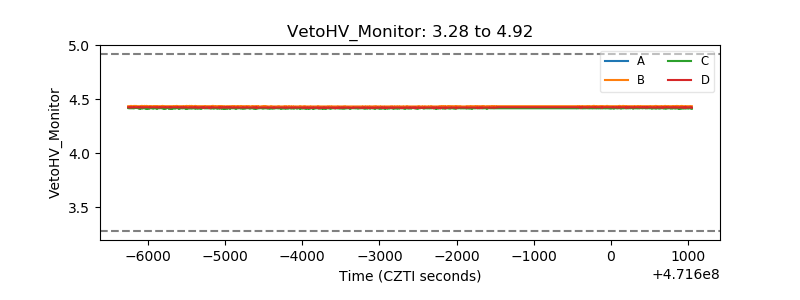 |
| Veto LLD | 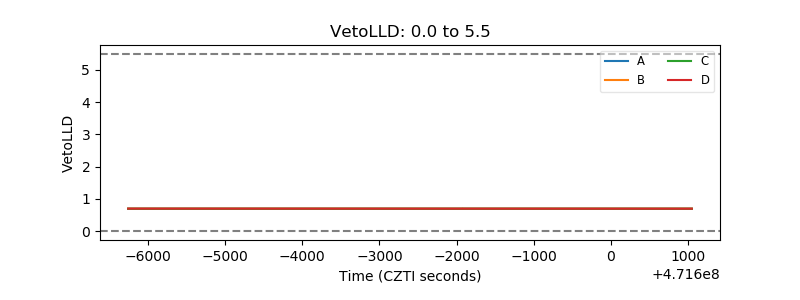 |
| Alpha Counter | 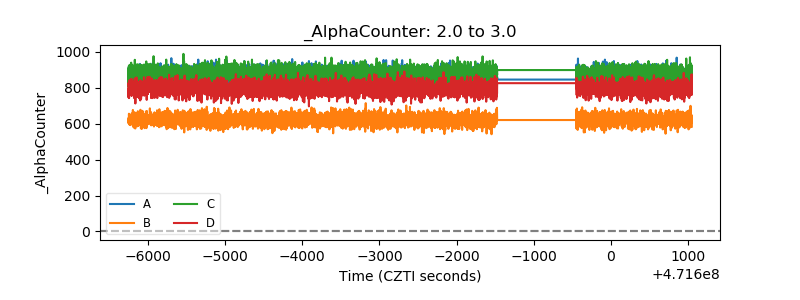 |
| _CPM_Rate | 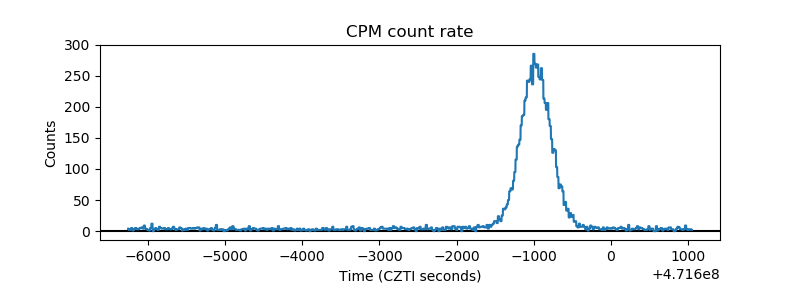 |
| CZT Counter | 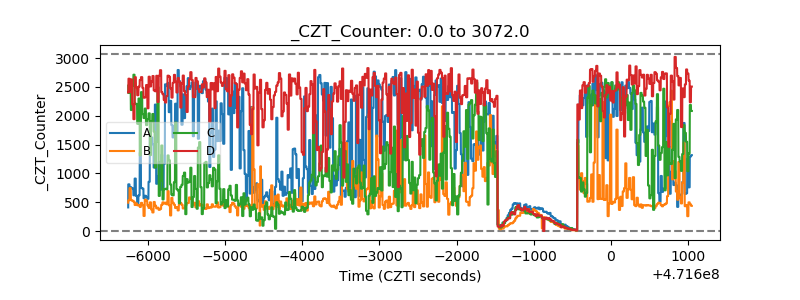 |
| +2.5 Volts monitor | 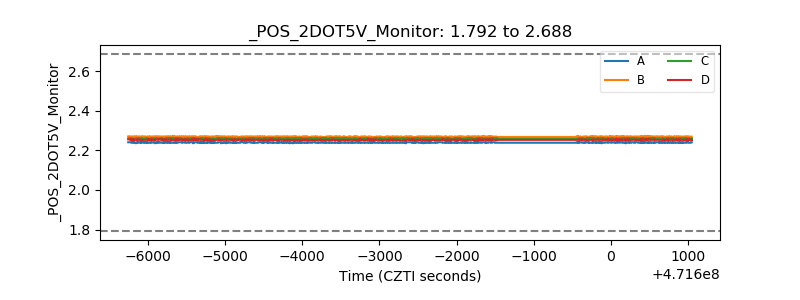 |
| +5 Volts monitor | 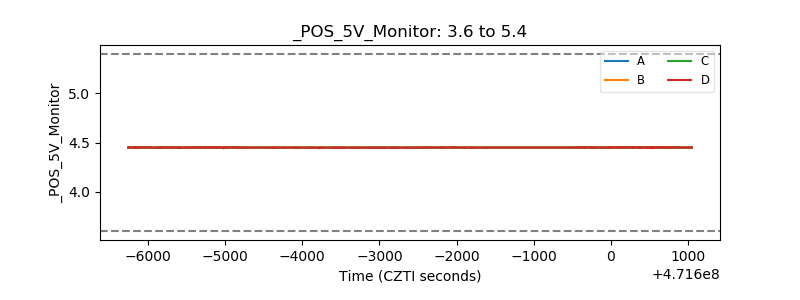 |
| _ROLL_ROT | 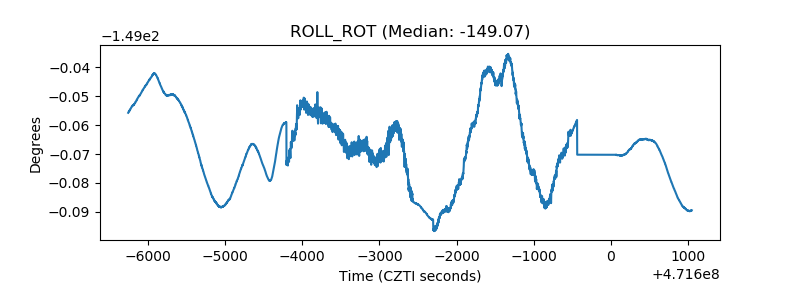 |
| _Roll_DEC | 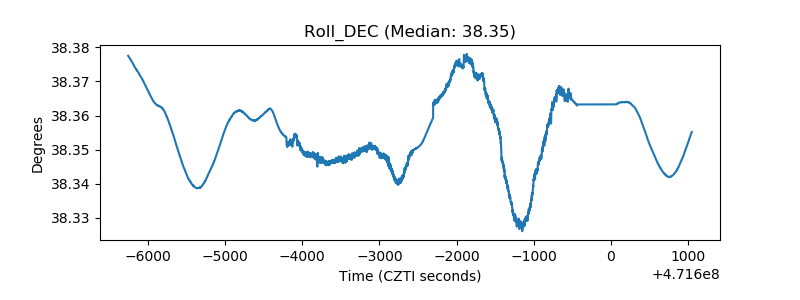 |
| _Roll_RA | 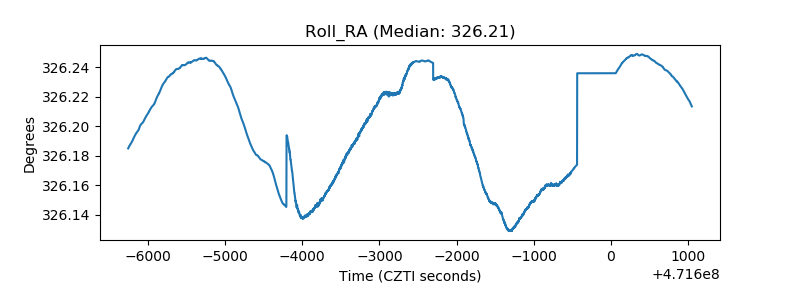 |
| Veto Counter | 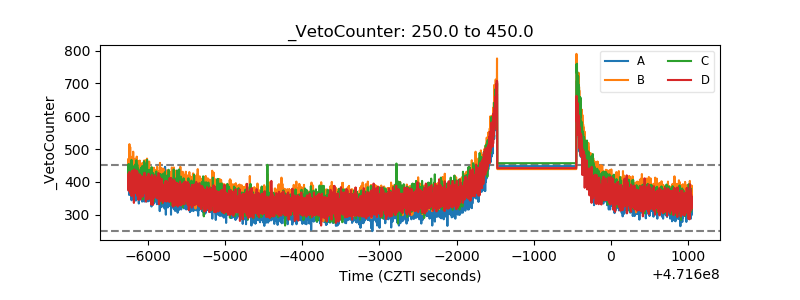 |