| Param | Original file | Final file |
|---|---|---|
| Filename | modeM0/AS1A13_037T01_9000006440_49784cztM0_level2.fits | modeM0/AS1A13_037T01_9000006440_49784cztM0_level2_quad_clean.evt |
| Size (bytes) | 1,013,993,280 | 48,744,000 |
| Size | 967.0 MB | 46.5 MB |
| Events in quadrant A | 7,235,376 | 336,071 |
| Events in quadrant B | 4,453,705 | 643,781 |
| Events in quadrant C | 9,161,686 | 6,326 |
| Events in quadrant D | 16,178,798 | 36,399 |
| Mode M9 | |||
|---|---|---|---|
| Quadrant | BADHDUFLAG | Total packets | Discarded packets |
| A | 0 | 7 | 0 |
| B | 0 | 7 | 0 |
| C | 0 | 7 | 0 |
| D | 0 | 7 | 0 |
| Mode SS | |||
|---|---|---|---|
| Quadrant | BADHDUFLAG | Total packets | Discarded packets |
| A | 0 | 132 | 0 |
| B | 0 | 134 | 0 |
| C | 0 | 134 | 0 |
| D | 0 | 134 | 0 |
| Mode M0 | |||
|---|---|---|---|
| Quadrant | BADHDUFLAG | Total packets | Discarded packets |
| A | 0 | 26049 | 25 |
| B | 0 | 17818 | 7 |
| C | 0 | 31776 | 34 |
| D | 0 | 52600 | 42 |
| Quadrant | Total seconds | Saturated seconds | Saturation percentage |
|---|---|---|---|
| A | 6490 | 3214 | 49.522342% |
| B | 6492 | 467 | 7.193469% |
| C | 6489 | 6435 | 99.167822% |
| D | 6488 | 6156 | 94.882861% |
Noise dominated data is calculated using 1-second bins in cleaned event files. If a bin has >2000 counts, and if more than 50% of those come from <1% of pixels, then it is considered to be noise-dominated and hence unusable.
| Quadrant | # 1 sec bins | Bins with >0 counts | Bins with >2000 counts | High rate bins dominated by noise | Noise dominated (total time) | Noise dominated (detector-on time) | Marked lightcurve |
|---|---|---|---|---|---|---|---|
| A | 7242 | 6492 | 950 | 950 | 13.12% | 14.63% | 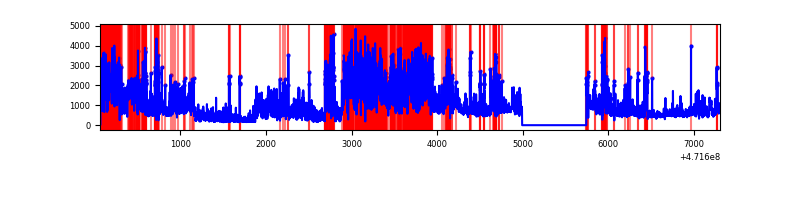 |
| B | 7244 | 6495 | 179 | 179 | 2.47% | 2.76% | 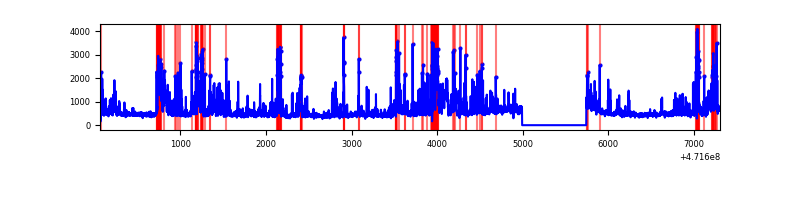 |
| C | 7242 | 6488 | 1567 | 1567 | 21.64% | 24.15% | 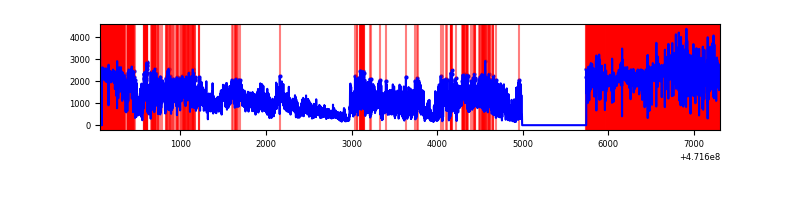 |
| D | 7242 | 6489 | 5576 | 5576 | 77.00% | 85.93% | 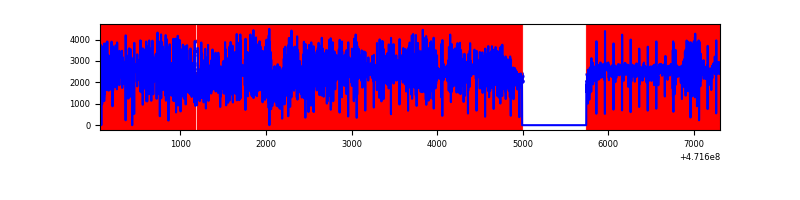 |
Top three noisy pixels from each quadrant. If the there are fewer than three noisy pixels in the level2.evt file, extra rows are filled as -1
| Pixel properties | Quadrant properties | ||||||
|---|---|---|---|---|---|---|---|
| Quadrant | DetID | PixID | Counts | Sigma | Mean | Median | Sigma |
| A | 8 | 8 | 3081408 | 25360.29 | 472 | 460 | 121.5 |
| A | 15 | 63 | 744204 | 6122.0 | 472 | 460 | 121.5 |
| A | 3 | 130 | 238180 | 1956.75 | 472 | 460 | 121.5 |
| B | 4 | 171 | 324304 | 2196.73 | 697 | 676 | 147.3 |
| B | 5 | 185 | 231860 | 1569.24 | 697 | 676 | 147.3 |
| B | 4 | 206 | 220055 | 1489.11 | 697 | 676 | 147.3 |
| C | 15 | 147 | 3858416 | 134131.06 | 72 | 70 | 28.8 |
| C | 15 | 198 | 1336559 | 46461.54 | 72 | 70 | 28.8 |
| C | 15 | 148 | 1262132 | 43874.17 | 72 | 70 | 28.8 |
| D | 8 | 129 | 4676257 | 55817.35 | 247 | 236 | 83.8 |
| D | 15 | 142 | 2144960 | 25601.43 | 247 | 236 | 83.8 |
| D | 15 | 168 | 2070808 | 24716.28 | 247 | 236 | 83.8 |
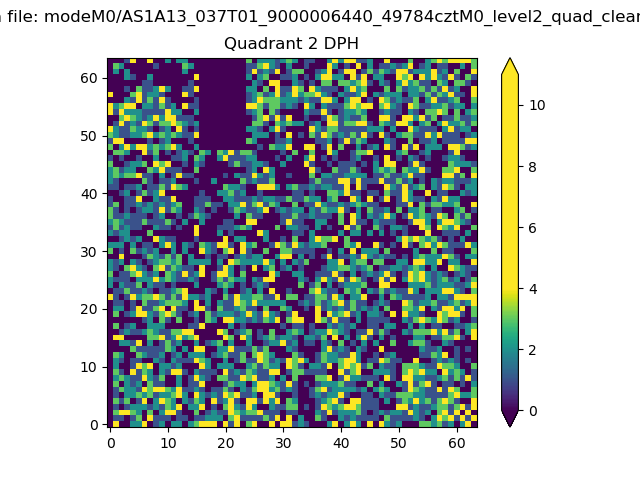
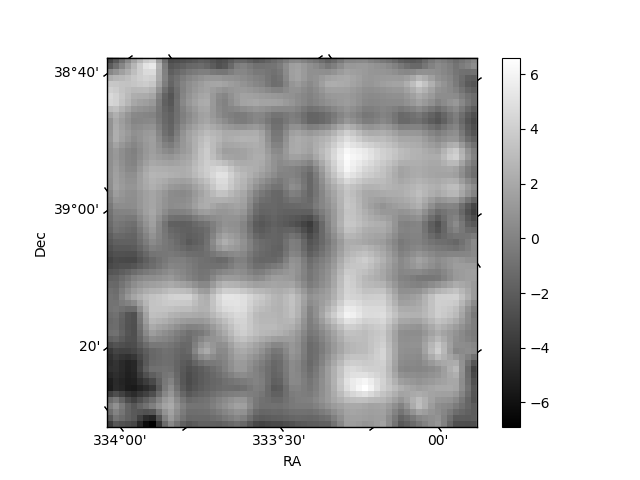
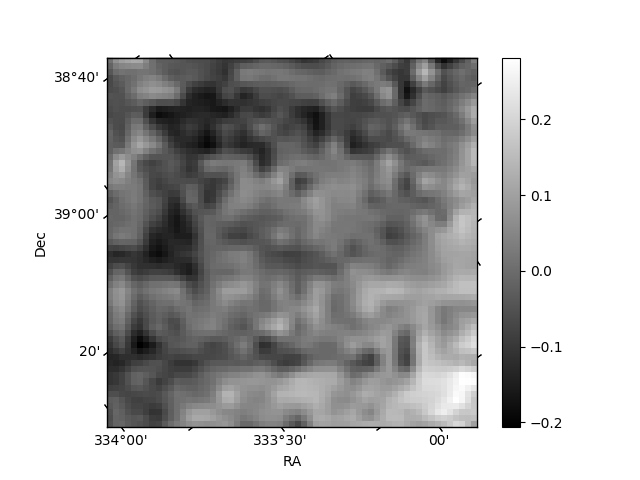
Histogram calculated using DETX and DETY for each event in the final _common_clean file
| Quadrant A | 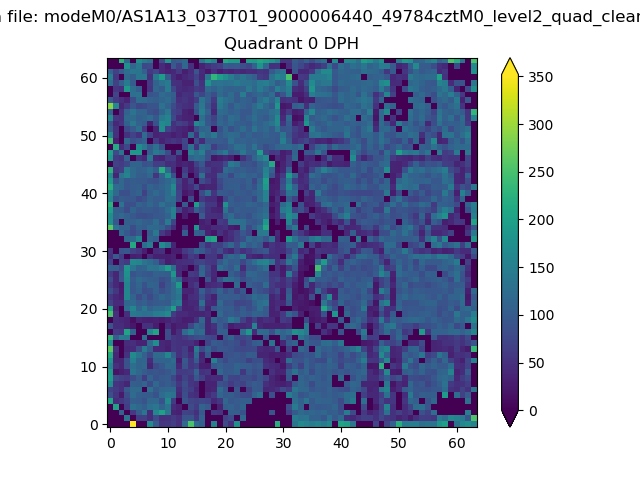 |
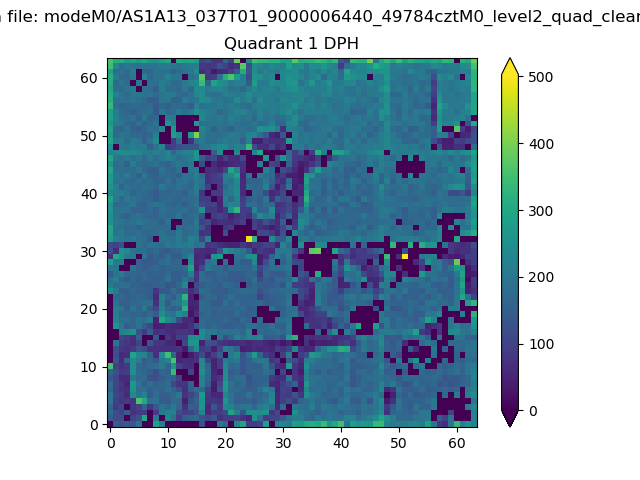 |
Quadrant B |
|---|---|---|---|
| Quadrant D | 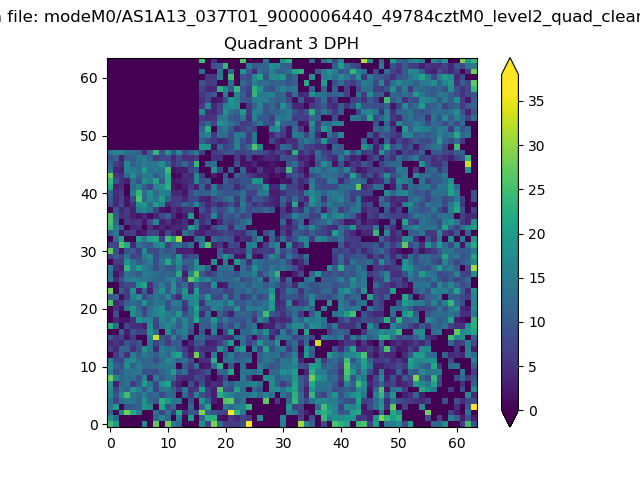 |
 |
Quadrant C |
| Plot type | Count rate plots | Images |
|---|---|---|
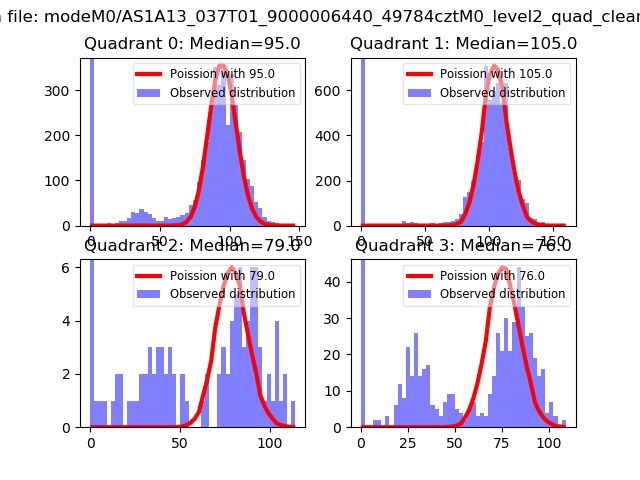
| Comparison with Poisson distribution Blue bars denote a histogram of data divided into 1 sec bins. Red curve is a Poisson curve with rate = median count rate of data. |
 |
 |
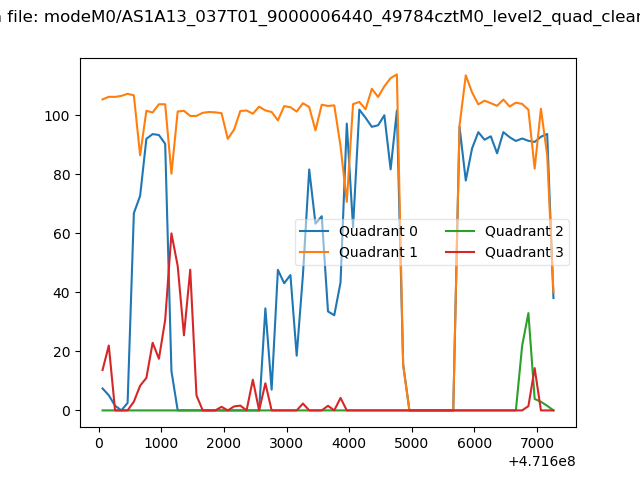
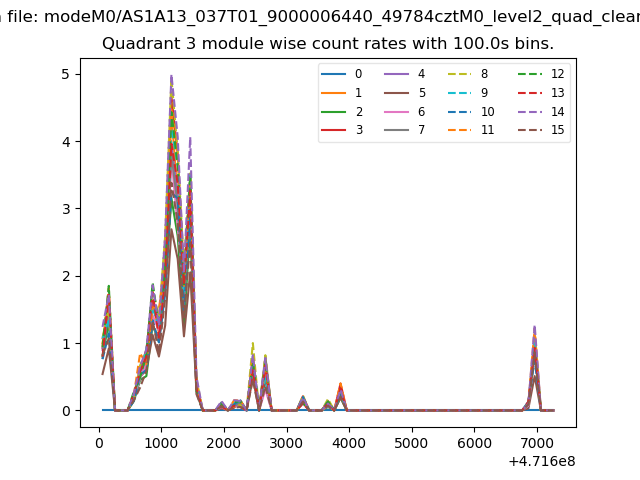
| Quadrant-wise count rates Data is divided into 100 sec bins |
 |
|
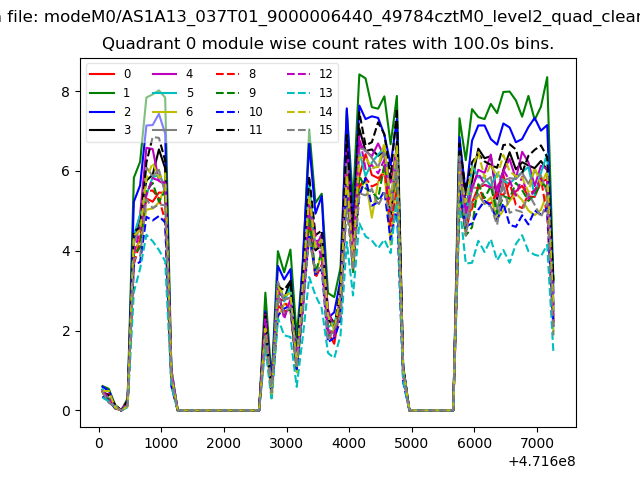
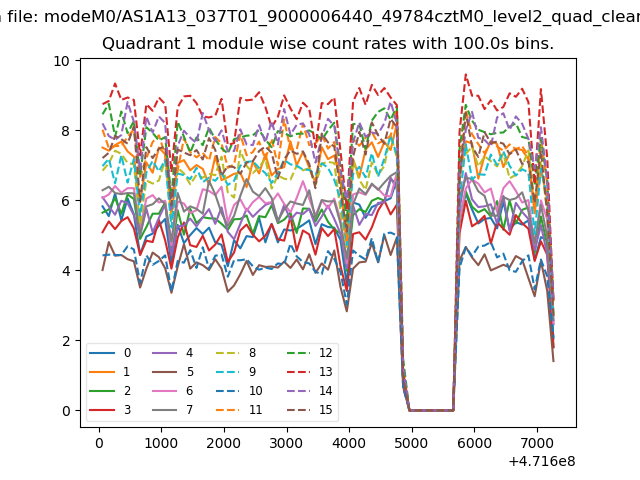
| Module-wise count rates for Quadrant A Data is divided into 100 sec bins |
 |
 |
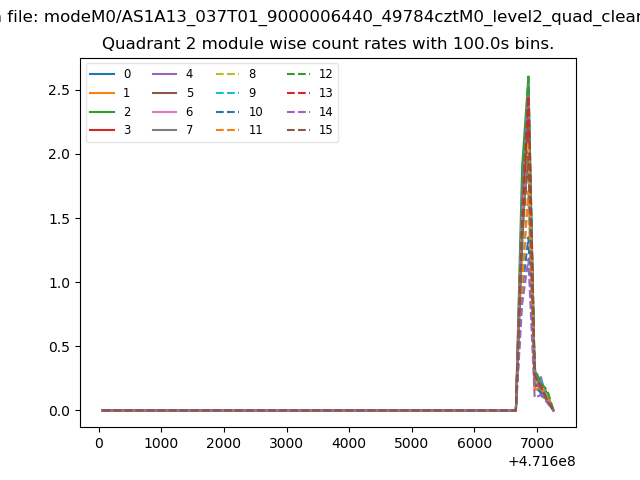
| Module-wise count rates for Quadrant B Data is divided into 100 sec bins |
 |
 |
| Module-wise count rates for Quadrant C Data is divided into 100 sec bins |
 |
 |
| Module-wise count rates for Quadrant D Data is divided into 100 sec bins |
 |
 |
| Parameter | Plot |
|---|---|
| CZT HV Monitor | 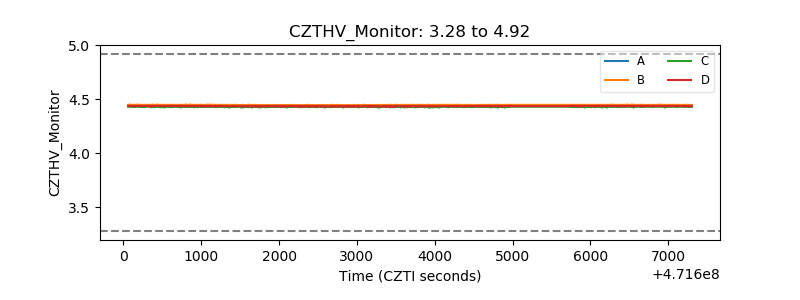 |
| D_VDD | 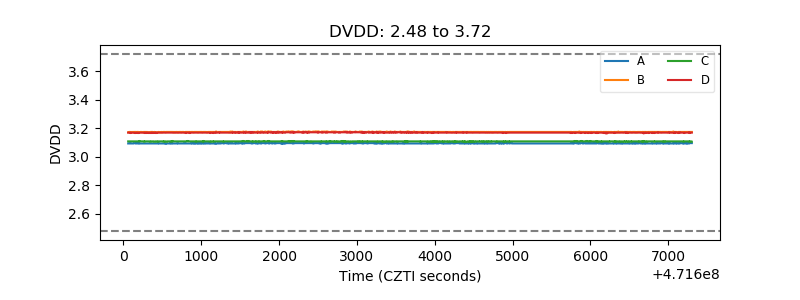 |
| Temperature 1 | 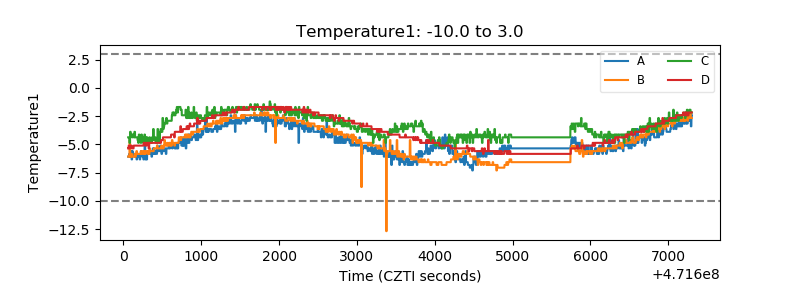 |
| Veto HV Monitor | 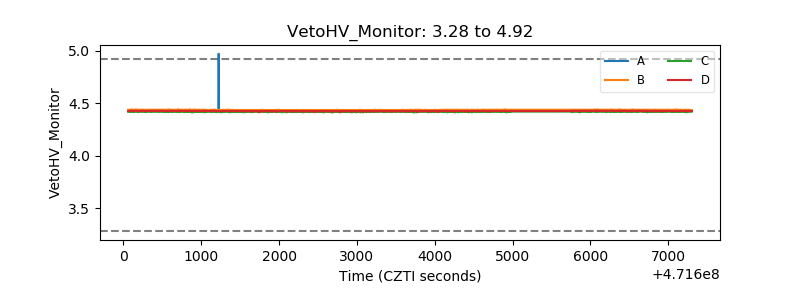 |
| Veto LLD | 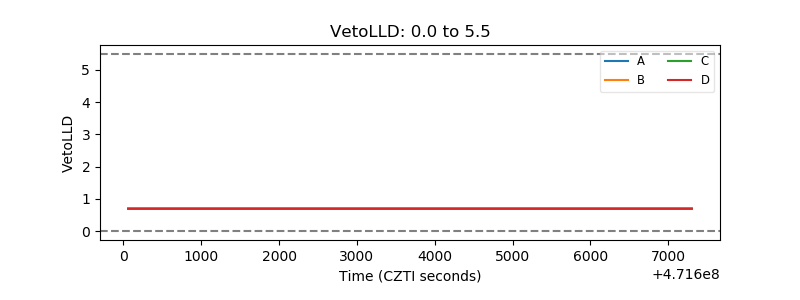 |
| Alpha Counter | 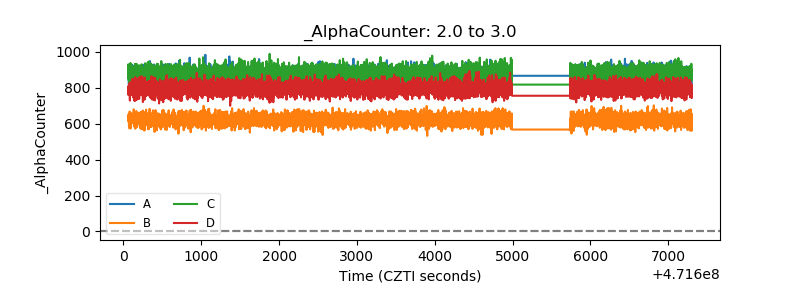 |
| _CPM_Rate | 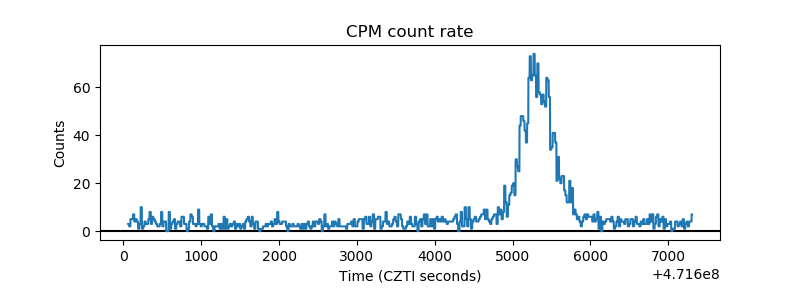 |
| CZT Counter | 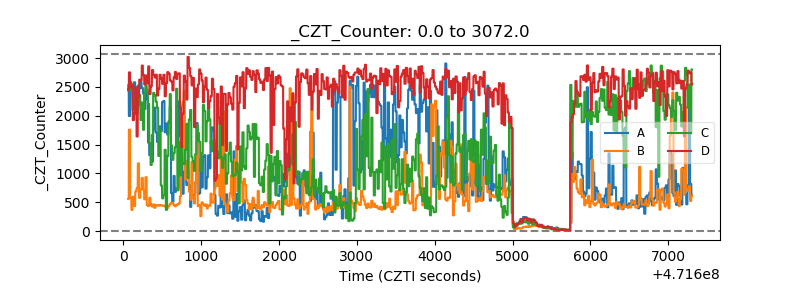 |
| +2.5 Volts monitor | 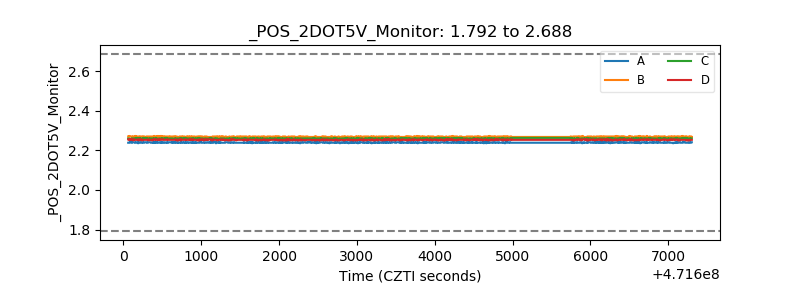 |
| +5 Volts monitor |  |
| _ROLL_ROT | 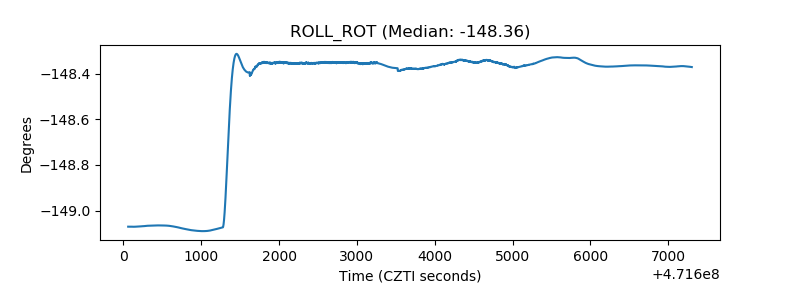 |
| _Roll_DEC | 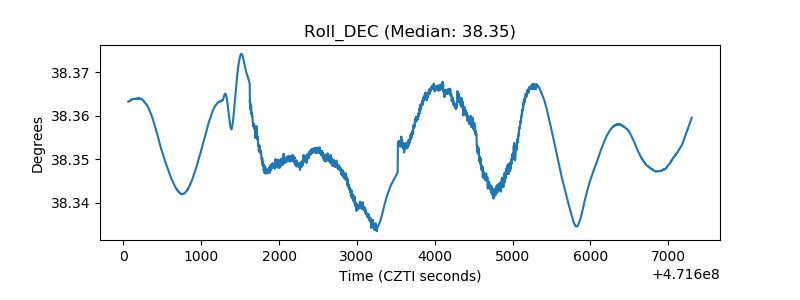 |
| _Roll_RA | 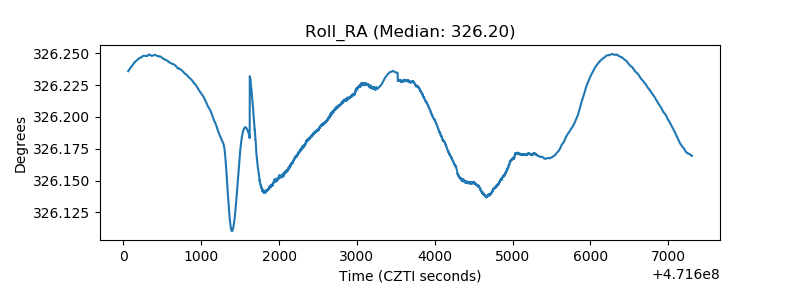 |
| Veto Counter | 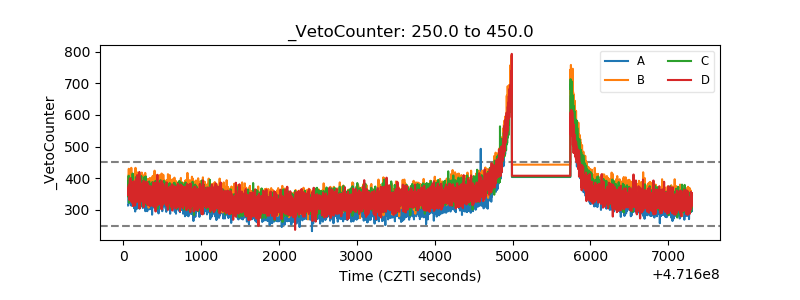 |