| Param | Original file | Final file |
|---|---|---|
| Filename | modeM0/AS1A13_037T01_9000006440_49785cztM0_level2.fits | modeM0/AS1A13_037T01_9000006440_49785cztM0_level2_quad_clean.evt |
| Size (bytes) | 1,056,962,880 | 56,496,960 |
| Size | 1008.0 MB | 53.9 MB |
| Events in quadrant A | 8,650,578 | 500,690 |
| Events in quadrant B | 4,536,857 | 700,133 |
| Events in quadrant C | 8,381,827 | 6,339 |
| Events in quadrant D | 17,001,882 | 8,013 |
| Mode M9 | |||
|---|---|---|---|
| Quadrant | BADHDUFLAG | Total packets | Discarded packets |
| A | 0 | 2 | 0 |
| B | 0 | 2 | 0 |
| C | 0 | 2 | 0 |
| D | 0 | 2 | 0 |
| Mode SS | |||
|---|---|---|---|
| Quadrant | BADHDUFLAG | Total packets | Discarded packets |
| A | 0 | 144 | 0 |
| B | 0 | 144 | 0 |
| C | 0 | 144 | 0 |
| D | 0 | 144 | 0 |
| Mode M0 | |||
|---|---|---|---|
| Quadrant | BADHDUFLAG | Total packets | Discarded packets |
| A | 0 | 30598 | 1 |
| B | 0 | 18434 | 1 |
| C | 0 | 29580 | 4 |
| D | 0 | 55356 | 1 |
| Quadrant | Total seconds | Saturated seconds | Saturation percentage |
|---|---|---|---|
| A | 7118 | 1991 | 27.971340% |
| B | 7118 | 466 | 6.546783% |
| C | 7117 | 7063 | 99.241253% |
| D | 7117 | 7045 | 98.988338% |
Noise dominated data is calculated using 1-second bins in cleaned event files. If a bin has >2000 counts, and if more than 50% of those come from <1% of pixels, then it is considered to be noise-dominated and hence unusable.
| Quadrant | # 1 sec bins | Bins with >0 counts | Bins with >2000 counts | High rate bins dominated by noise | Noise dominated (total time) | Noise dominated (detector-on time) | Marked lightcurve |
|---|---|---|---|---|---|---|---|
| A | 7263 | 7120 | 1442 | 1442 | 19.85% | 20.25% | 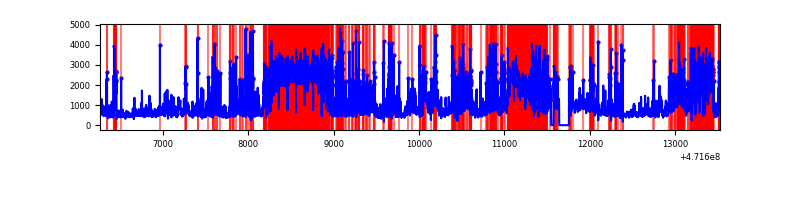 |
| B | 7263 | 7120 | 157 | 157 | 2.16% | 2.21% | 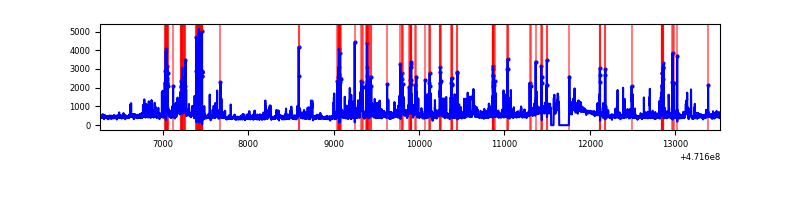 |
| C | 7261 | 7117 | 2094 | 2094 | 28.84% | 29.42% | 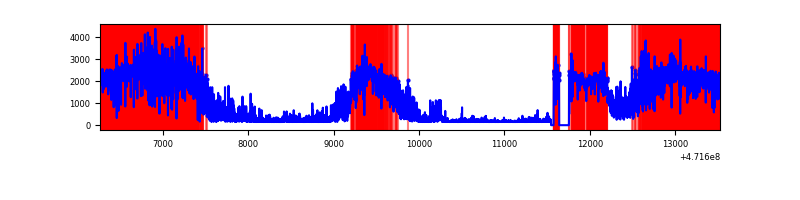 |
| D | 7261 | 7116 | 5989 | 5989 | 82.48% | 84.16% | 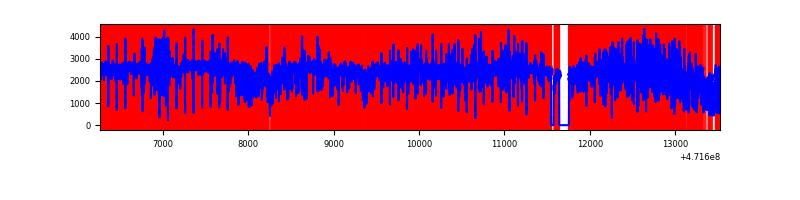 |
Top three noisy pixels from each quadrant. If the there are fewer than three noisy pixels in the level2.evt file, extra rows are filled as -1
| Pixel properties | Quadrant properties | ||||||
|---|---|---|---|---|---|---|---|
| Quadrant | DetID | PixID | Counts | Sigma | Mean | Median | Sigma |
| A | 7 | 64 | 1540582 | 9043.0 | 687 | 670 | 170.3 |
| A | 3 | 99 | 1087627 | 6383.06 | 687 | 670 | 170.3 |
| A | 15 | 63 | 740128 | 4342.4 | 687 | 670 | 170.3 |
| B | 4 | 206 | 295377 | 1777.57 | 778 | 753 | 165.7 |
| B | 4 | 171 | 259993 | 1564.08 | 778 | 753 | 165.7 |
| B | 5 | 172 | 171594 | 1030.74 | 778 | 753 | 165.7 |
| C | 15 | 147 | 2534982 | 81365.43 | 82 | 80 | 31.2 |
| C | 15 | 198 | 1621239 | 52036.06 | 82 | 80 | 31.2 |
| C | 15 | 148 | 1076812 | 34561.01 | 82 | 80 | 31.2 |
| D | 8 | 129 | 4562566 | 74458.65 | 167 | 158 | 61.3 |
| D | 15 | 106 | 4078070 | 66551.66 | 167 | 158 | 61.3 |
| D | 15 | 142 | 3742045 | 61067.72 | 167 | 158 | 61.3 |
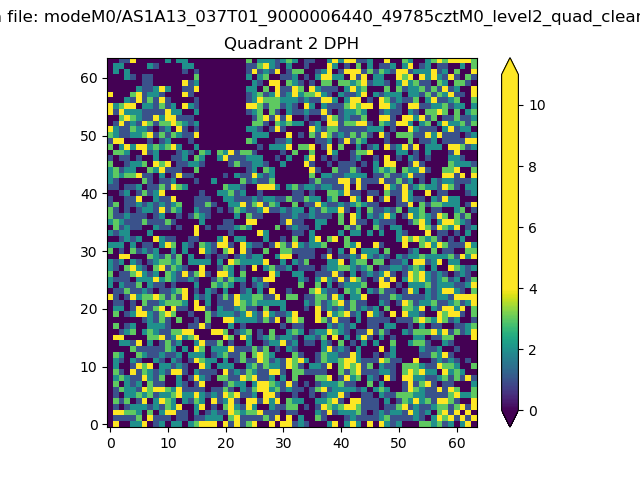
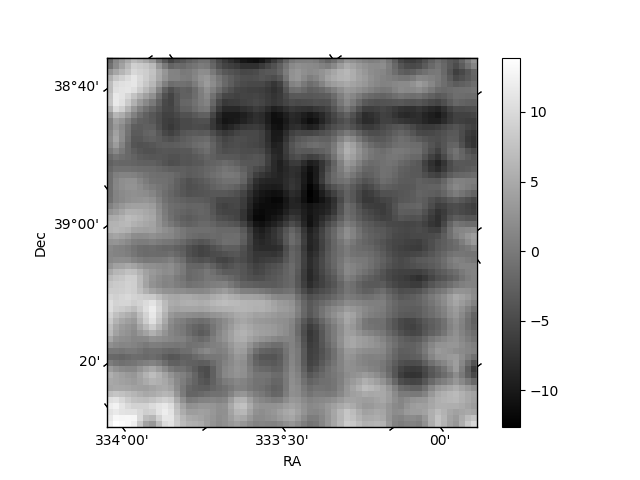
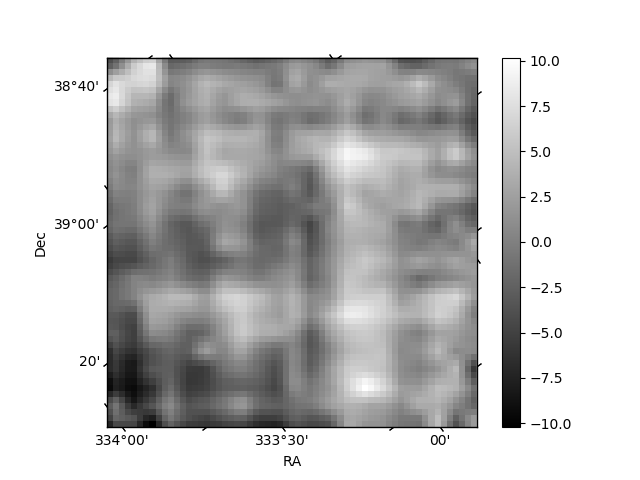
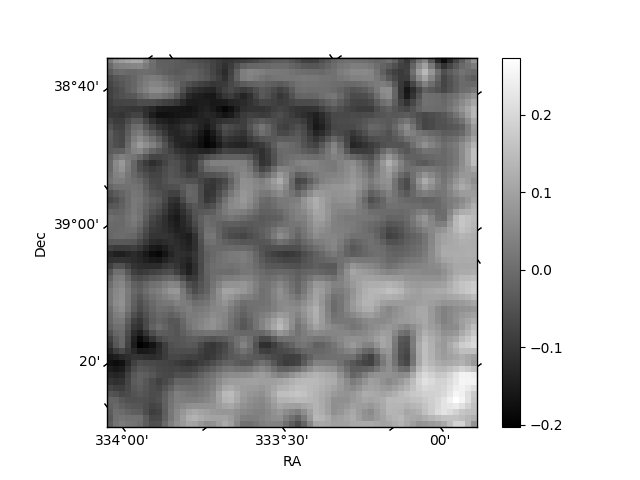
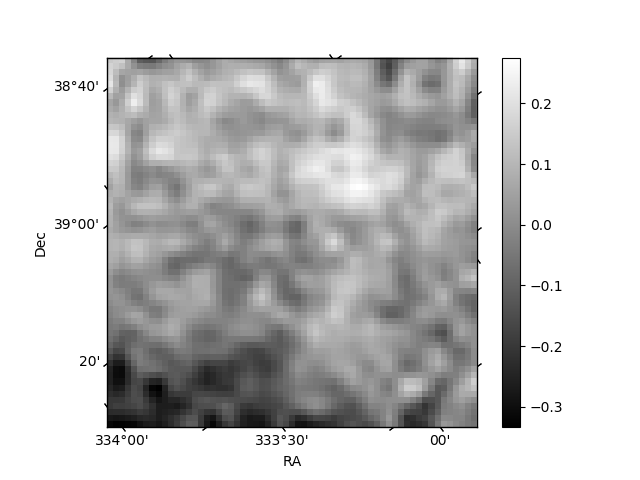
Histogram calculated using DETX and DETY for each event in the final _common_clean file
| Quadrant A | 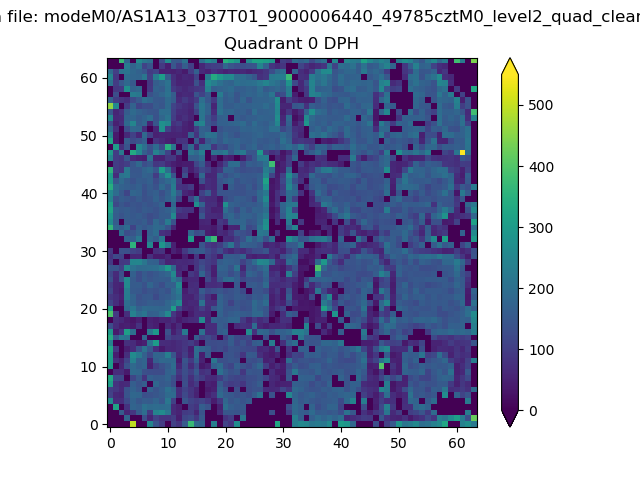 |
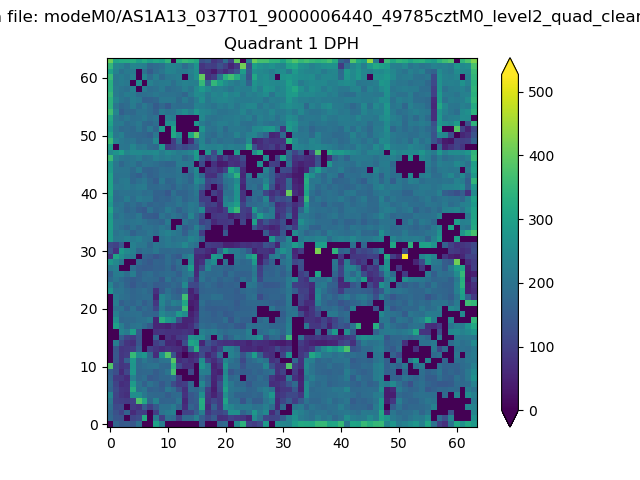 |
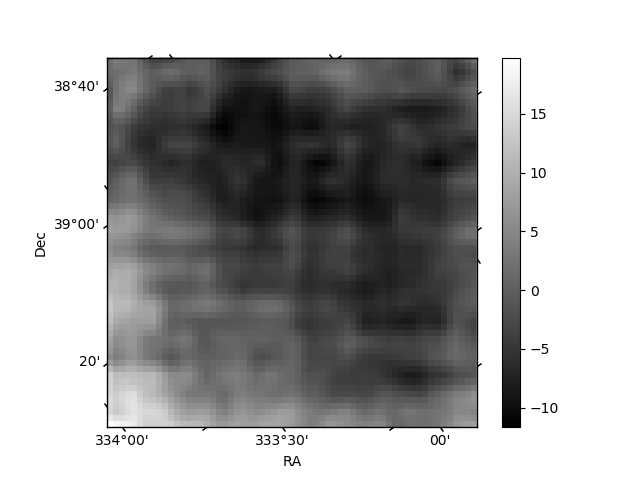
Quadrant B |
|---|---|---|---|
| Quadrant D | 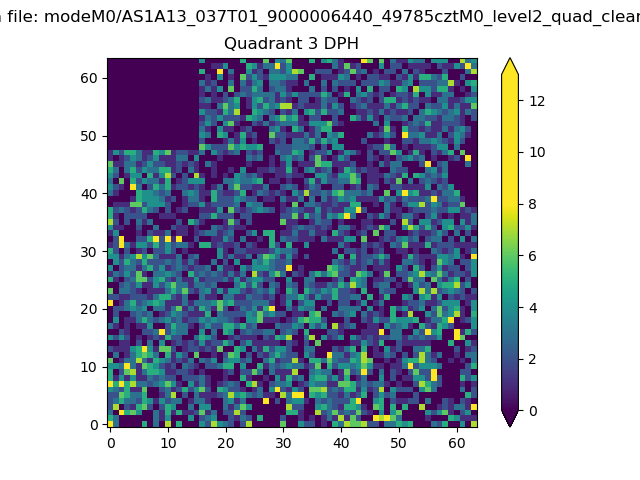 |
 |
Quadrant C |
| Plot type | Count rate plots | Images |
|---|---|---|
| Comparison with Poisson distribution Blue bars denote a histogram of data divided into 1 sec bins. Red curve is a Poisson curve with rate = median count rate of data. |
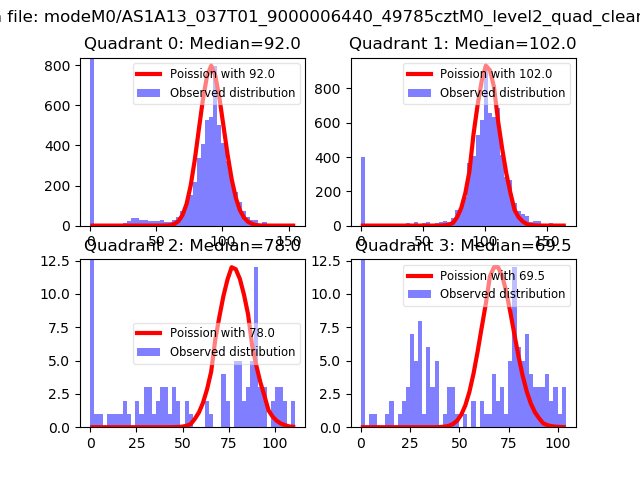 |
 |
| Quadrant-wise count rates Data is divided into 100 sec bins |
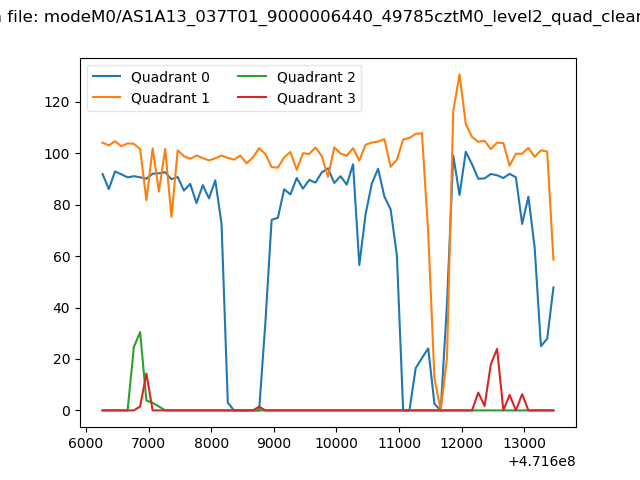 |
|
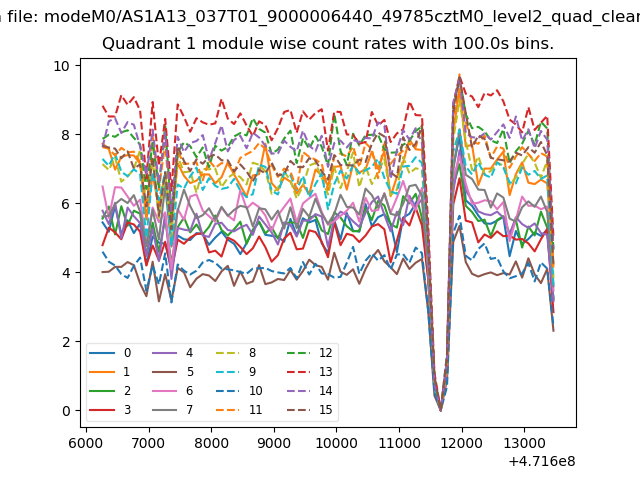
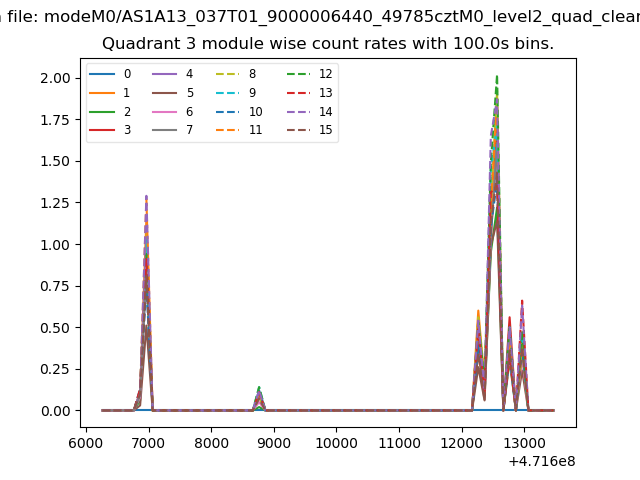
| Module-wise count rates for Quadrant A Data is divided into 100 sec bins |
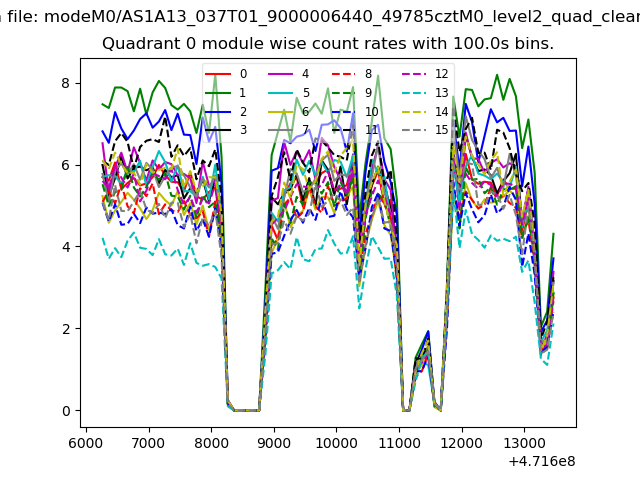 |
 |
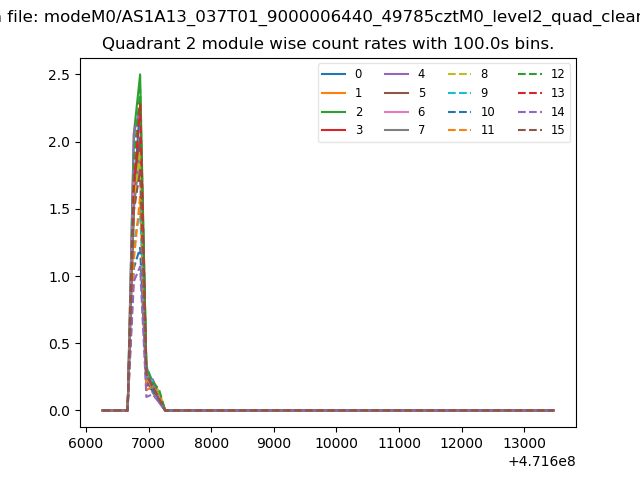
| Module-wise count rates for Quadrant B Data is divided into 100 sec bins |
 |
 |
| Module-wise count rates for Quadrant C Data is divided into 100 sec bins |
 |
 |
| Module-wise count rates for Quadrant D Data is divided into 100 sec bins |
 |
 |
| Parameter | Plot |
|---|---|
| CZT HV Monitor | 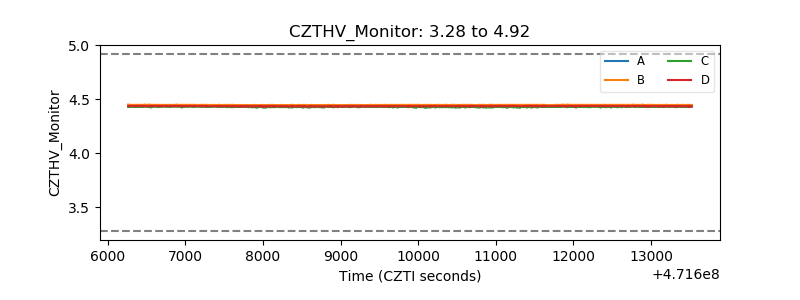 |
| D_VDD | 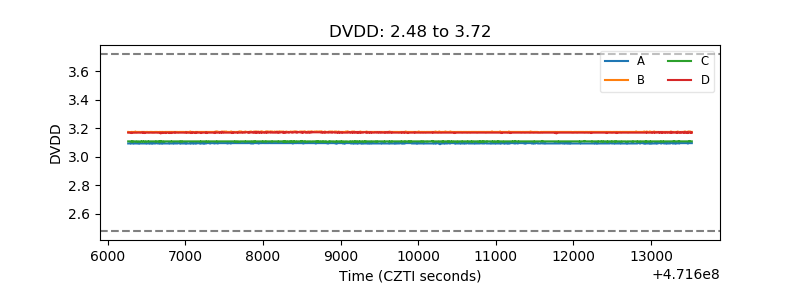 |
| Temperature 1 | 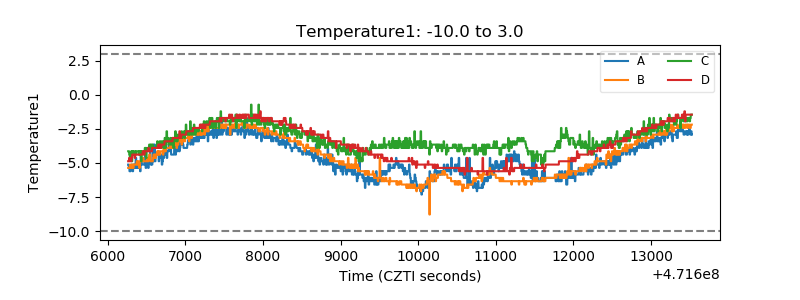 |
| Veto HV Monitor | 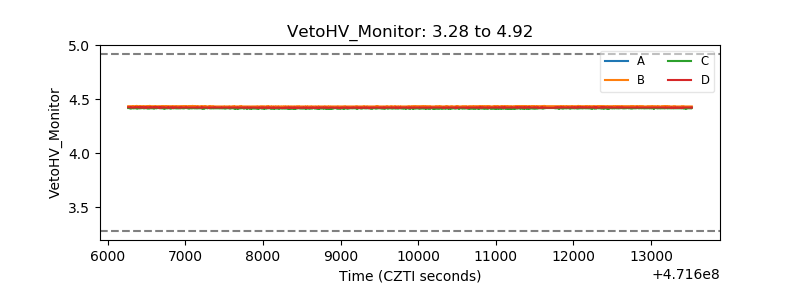 |
| Veto LLD | 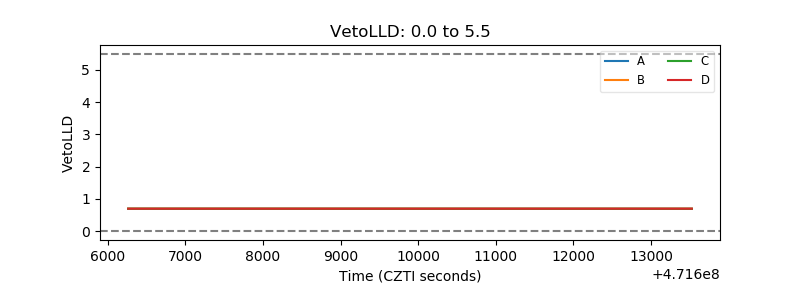 |
| Alpha Counter | 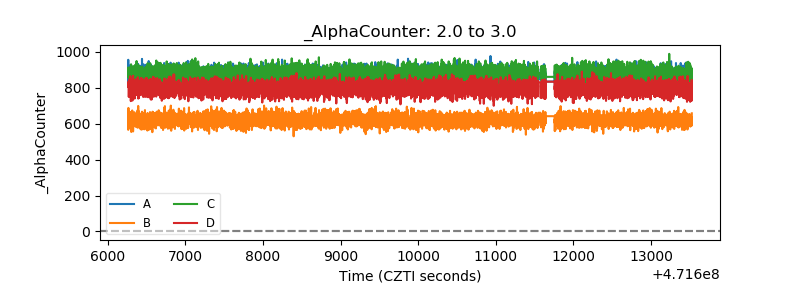 |
| _CPM_Rate | 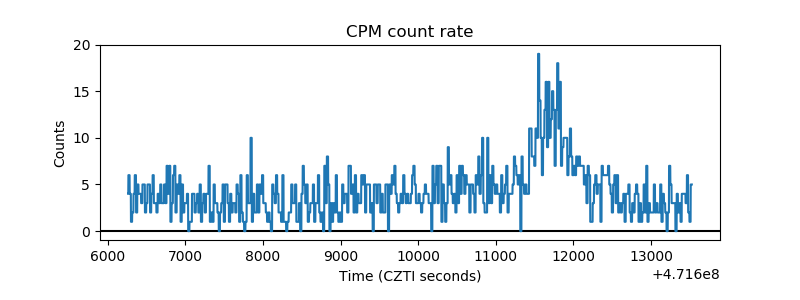 |
| CZT Counter | 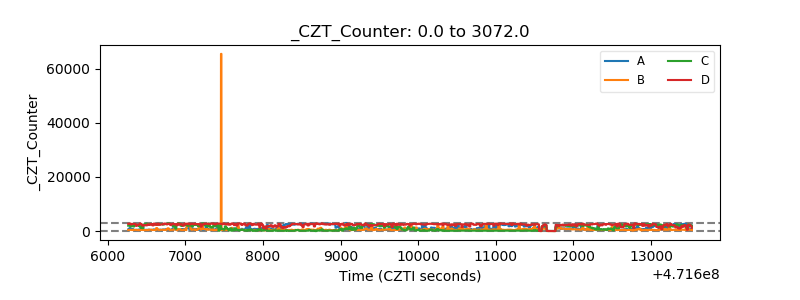 |
| +2.5 Volts monitor | 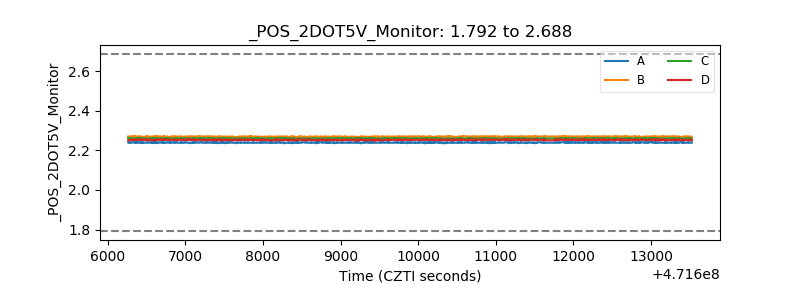 |
| +5 Volts monitor |  |
| _ROLL_ROT | 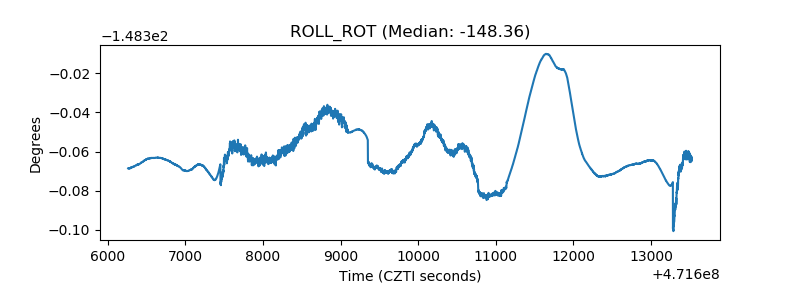 |
| _Roll_DEC | 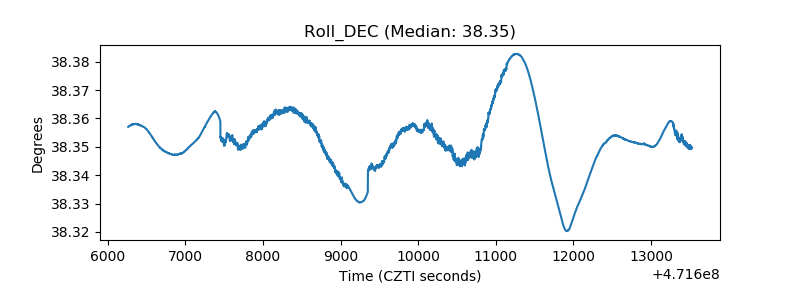 |
| _Roll_RA | 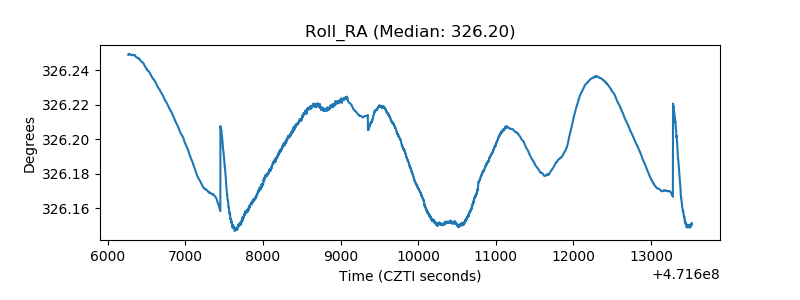 |
| Veto Counter | 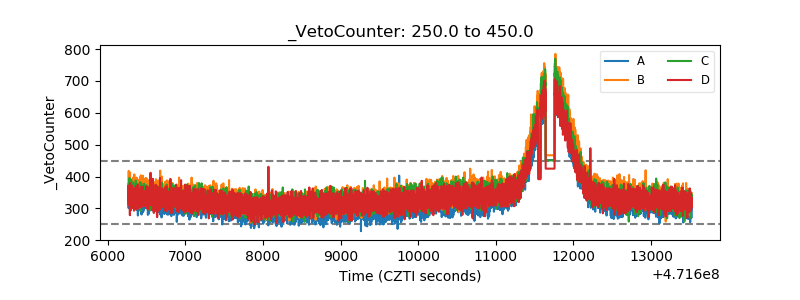 |