| Param | Original file | Final file |
|---|---|---|
| Filename | modeM0/AS1A13_037T01_9000006440_49790cztM0_level2.fits | modeM0/AS1A13_037T01_9000006440_49790cztM0_level2_quad_clean.evt |
| Size (bytes) | 2,865,864,960 | 115,476,480 |
| Size | 2.7 GB | 110.1 MB |
| Events in quadrant A | 34,597,339 | 586,362 |
| Events in quadrant B | 10,680,006 | 1,699,306 |
| Events in quadrant C | 16,366,972 | 8,007 |
| Events in quadrant D | 43,093,939 | 1,820 |
| Mode M9 | |||
|---|---|---|---|
| Quadrant | BADHDUFLAG | Total packets | Discarded packets |
| A | 0 | 7 | 0 |
| B | 0 | 7 | 0 |
| C | 0 | 7 | 0 |
| D | 0 | 7 | 0 |
| Mode SS | |||
|---|---|---|---|
| Quadrant | BADHDUFLAG | Total packets | Discarded packets |
| A | 0 | 354 | 0 |
| B | 0 | 354 | 0 |
| C | 0 | 354 | 0 |
| D | 0 | 354 | 0 |
| Mode M0 | |||
|---|---|---|---|
| Quadrant | BADHDUFLAG | Total packets | Discarded packets |
| A | 0 | 114716 | 1 |
| B | 0 | 43485 | 1 |
| C | 0 | 61016 | 1 |
| D | 0 | 139797 | 1 |
| Quadrant | Total seconds | Saturated seconds | Saturation percentage |
|---|---|---|---|
| A | 17396 | 11252 | 64.681536% |
| B | 17397 | 525 | 3.017762% |
| C | 17397 | 17332 | 99.626372% |
| D | 17397 | 17382 | 99.913778% |
Noise dominated data is calculated using 1-second bins in cleaned event files. If a bin has >2000 counts, and if more than 50% of those come from <1% of pixels, then it is considered to be noise-dominated and hence unusable.
| Quadrant | # 1 sec bins | Bins with >0 counts | Bins with >2000 counts | High rate bins dominated by noise | Noise dominated (total time) | Noise dominated (detector-on time) | Marked lightcurve |
|---|---|---|---|---|---|---|---|
| A | 17756 | 17396 | 10144 | 10144 | 57.13% | 58.31% | 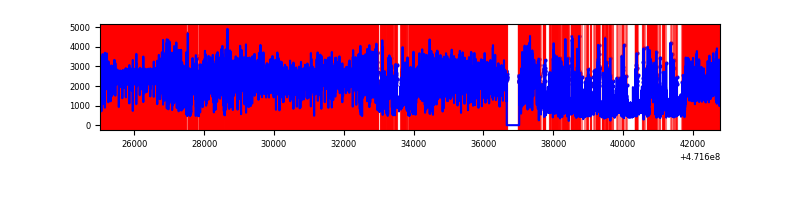 |
| B | 17757 | 17398 | 283 | 283 | 1.59% | 1.63% | 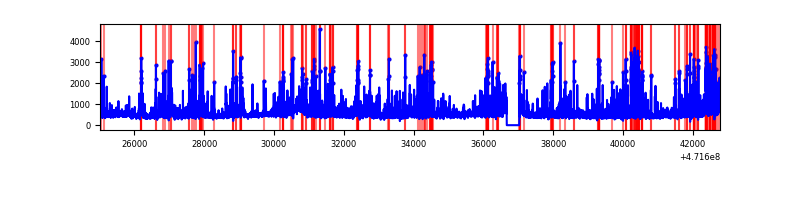 |
| C | 17756 | 17396 | 2634 | 2634 | 14.83% | 15.14% | 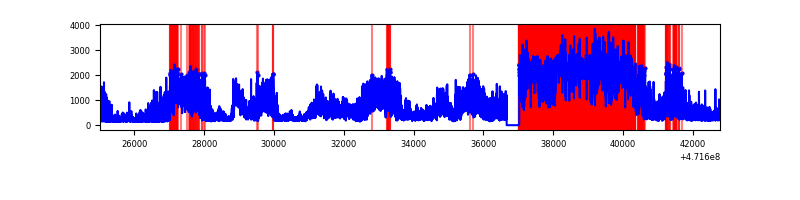 |
| D | 17756 | 17396 | 16342 | 16342 | 92.04% | 93.94% | 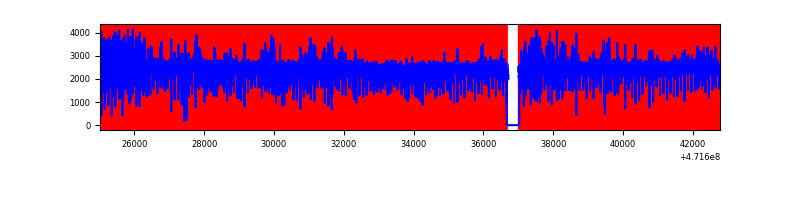 |
Top three noisy pixels from each quadrant. If the there are fewer than three noisy pixels in the level2.evt file, extra rows are filled as -1
| Pixel properties | Quadrant properties | ||||||
|---|---|---|---|---|---|---|---|
| Quadrant | DetID | PixID | Counts | Sigma | Mean | Median | Sigma |
| A | 0 | 98 | 8682978 | 26661.86 | 1232 | 1196 | 325.6 |
| A | 12 | 50 | 5794702 | 17791.93 | 1232 | 1196 | 325.6 |
| A | 8 | 8 | 2329333 | 7149.74 | 1232 | 1196 | 325.6 |
| B | 10 | 28 | 811098 | 2097.72 | 1826 | 1767 | 385.8 |
| B | 4 | 206 | 458458 | 1183.7 | 1826 | 1767 | 385.8 |
| B | 1 | 255 | 324394 | 836.22 | 1826 | 1767 | 385.8 |
| C | 15 | 147 | 6101591 | 101215.38 | 121 | 115 | 60.3 |
| C | 1 | 44 | 1794193 | 29761.37 | 121 | 115 | 60.3 |
| C | 15 | 148 | 1772941 | 29408.83 | 121 | 115 | 60.3 |
| D | 8 | 129 | 9909702 | 45311.7 | 408 | 377 | 218.7 |
| D | 15 | 168 | 6747925 | 30854.06 | 408 | 377 | 218.7 |
| D | 14 | 52 | 4885204 | 22336.52 | 408 | 377 | 218.7 |
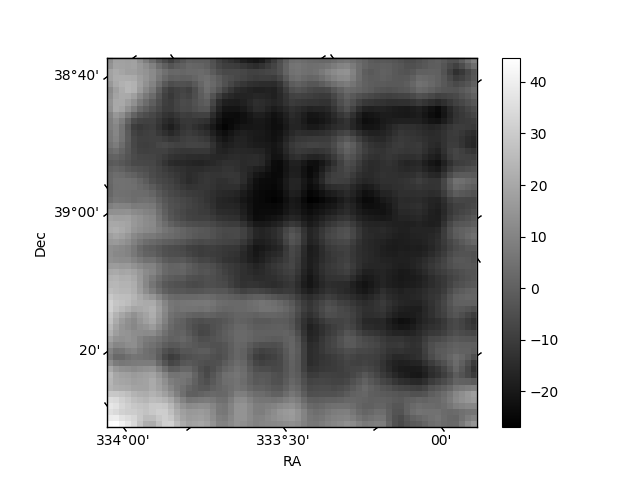
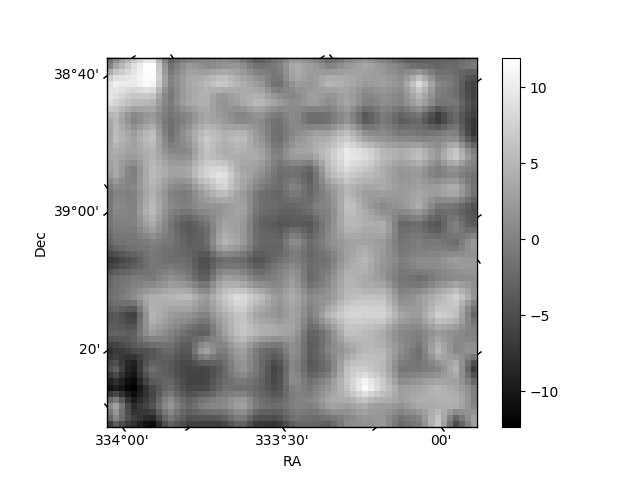
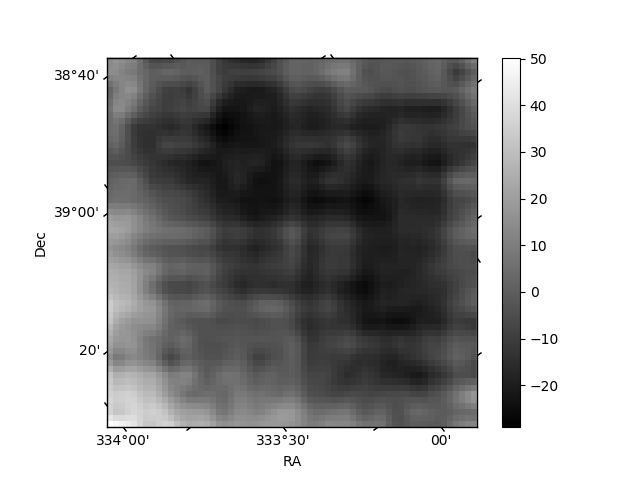
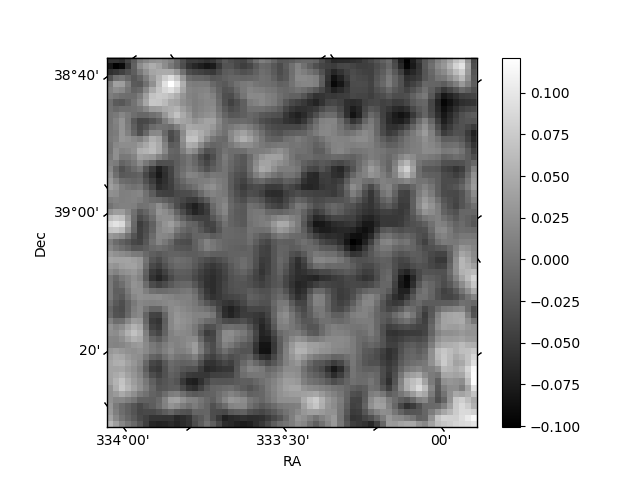
Histogram calculated using DETX and DETY for each event in the final _common_clean file
| Quadrant A | 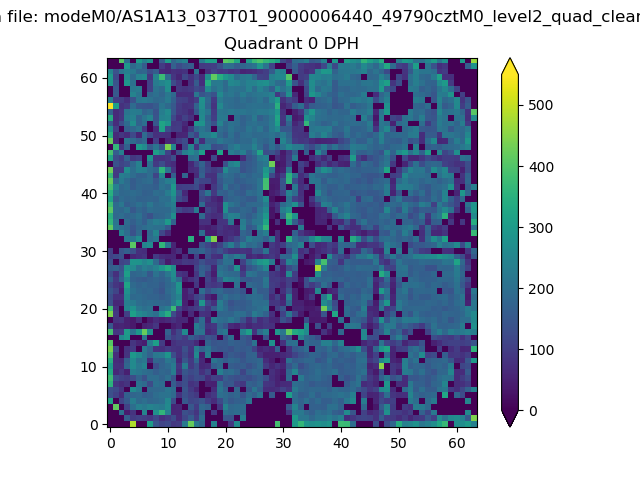 |
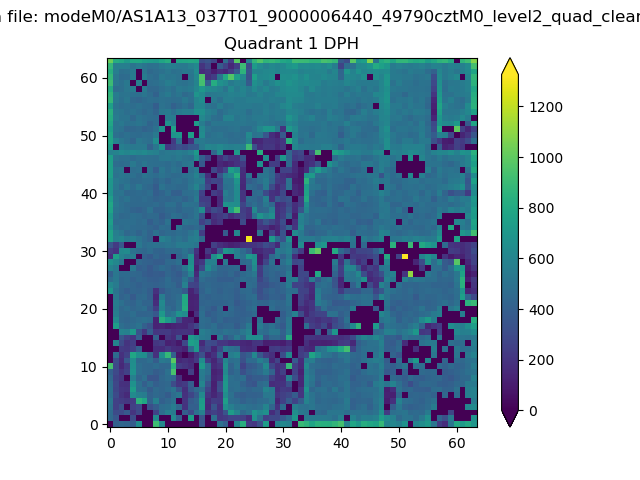 |
Quadrant B |
|---|---|---|---|
| Quadrant D | 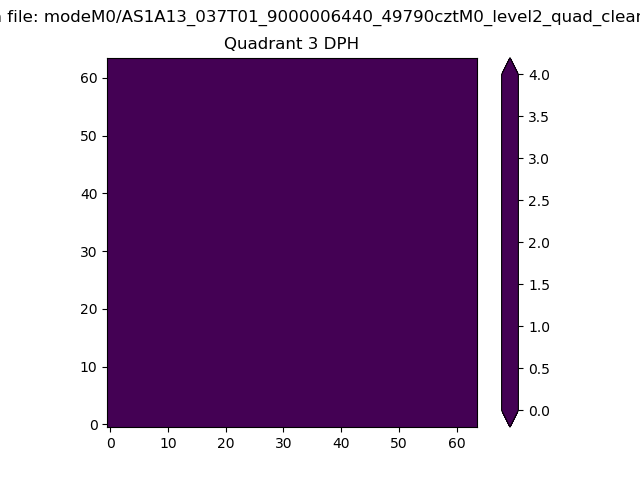 |
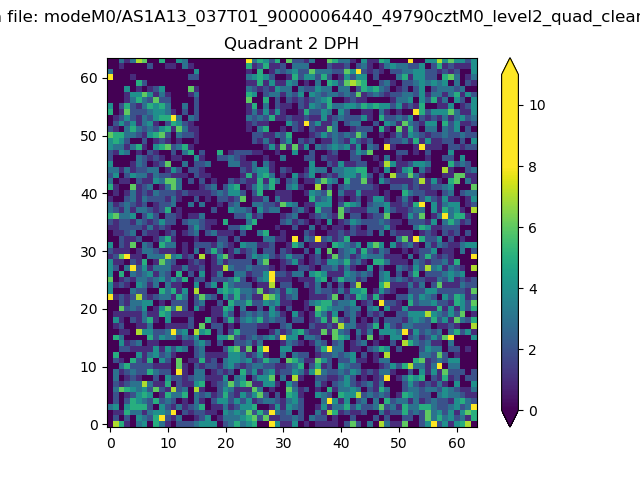 |
Quadrant C |
| Plot type | Count rate plots | Images |
|---|---|---|
| Comparison with Poisson distribution Blue bars denote a histogram of data divided into 1 sec bins. Red curve is a Poisson curve with rate = median count rate of data. |
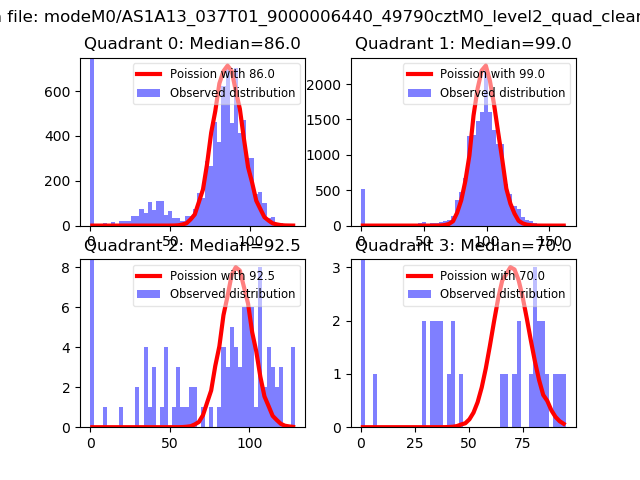 |
 |
| Quadrant-wise count rates Data is divided into 100 sec bins |
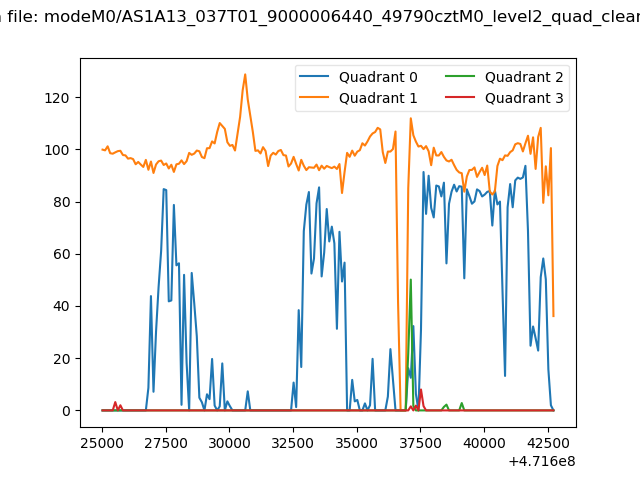 |
|
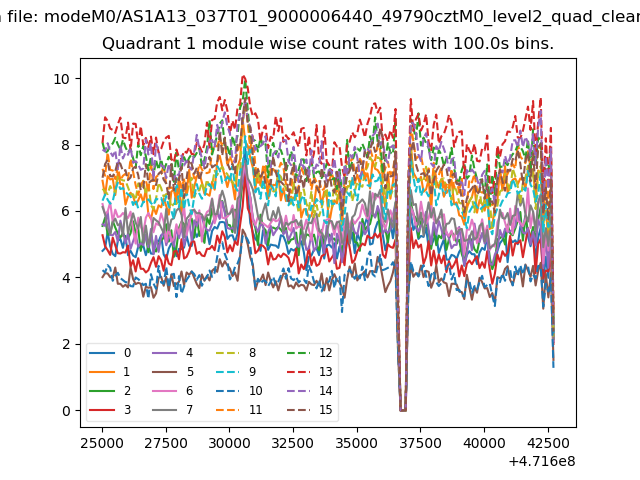
| Module-wise count rates for Quadrant A Data is divided into 100 sec bins |
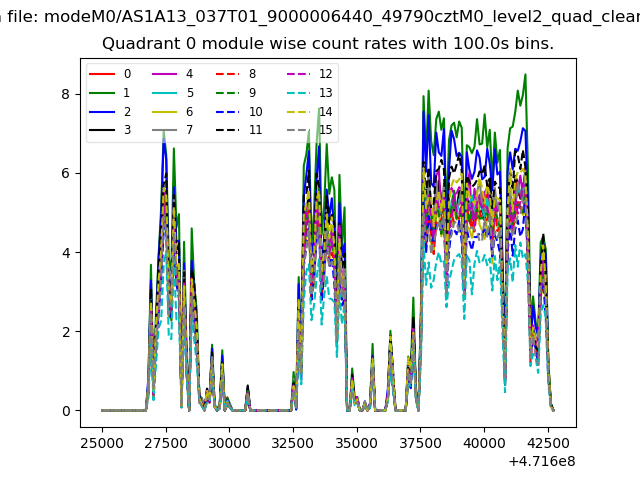 |
 |
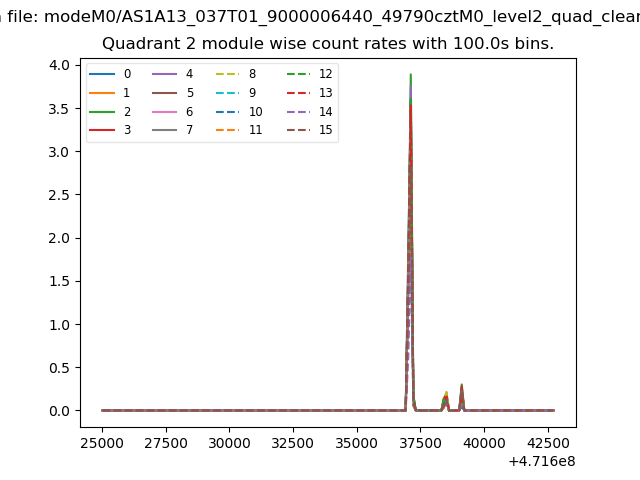
| Module-wise count rates for Quadrant B Data is divided into 100 sec bins |
 |
 |
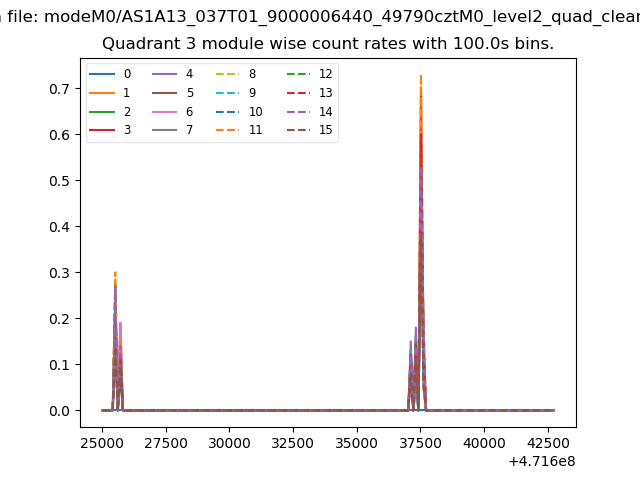
| Module-wise count rates for Quadrant C Data is divided into 100 sec bins |
 |
 |
| Module-wise count rates for Quadrant D Data is divided into 100 sec bins |
 |
 |
| Parameter | Plot |
|---|---|
| CZT HV Monitor | 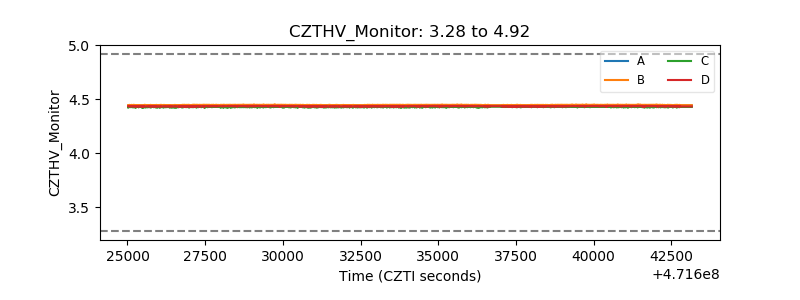 |
| D_VDD | 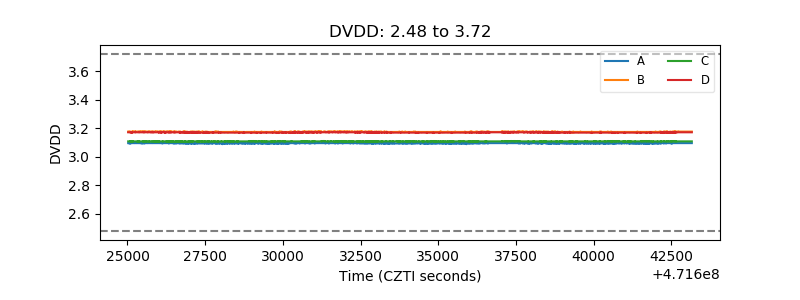 |
| Temperature 1 | 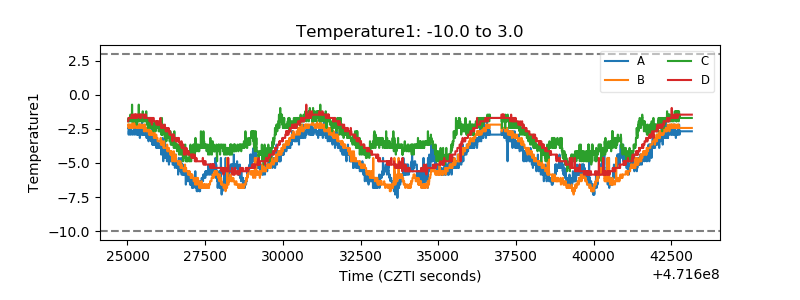 |
| Veto HV Monitor | 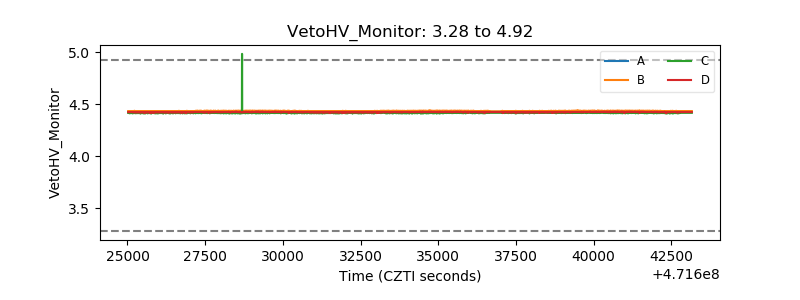 |
| Veto LLD | 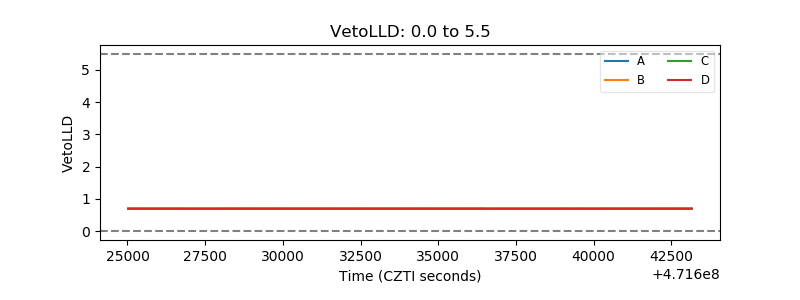 |
| Alpha Counter | 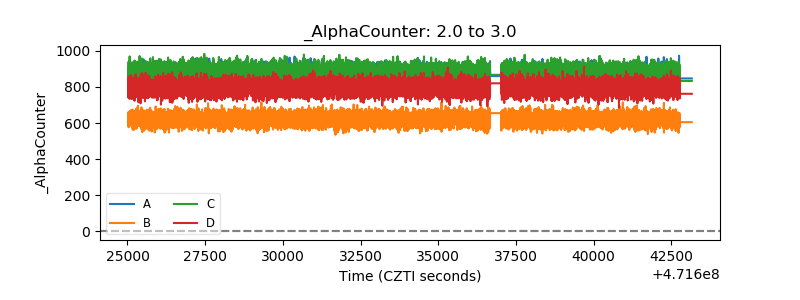 |
| _CPM_Rate | 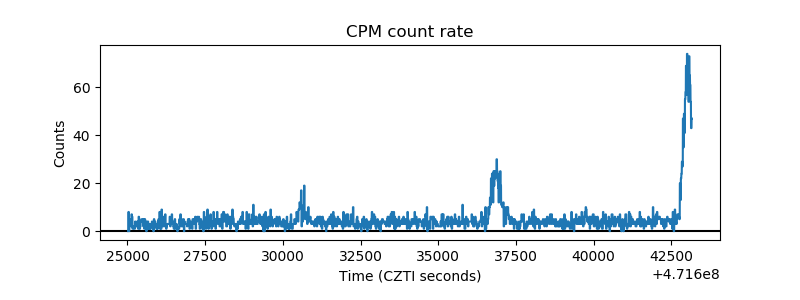 |
| CZT Counter | 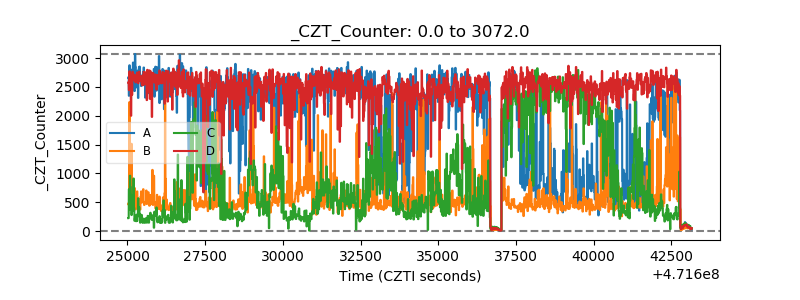 |
| +2.5 Volts monitor | 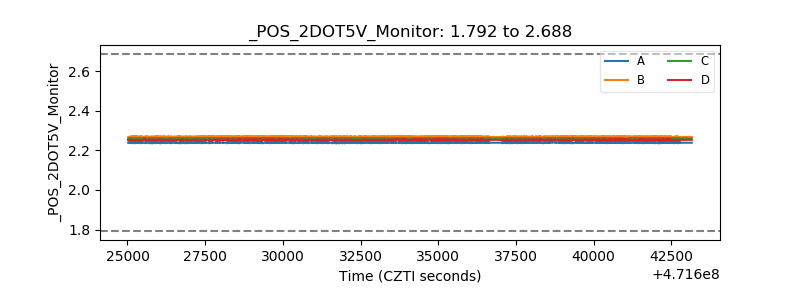 |
| +5 Volts monitor |  |
| _ROLL_ROT | 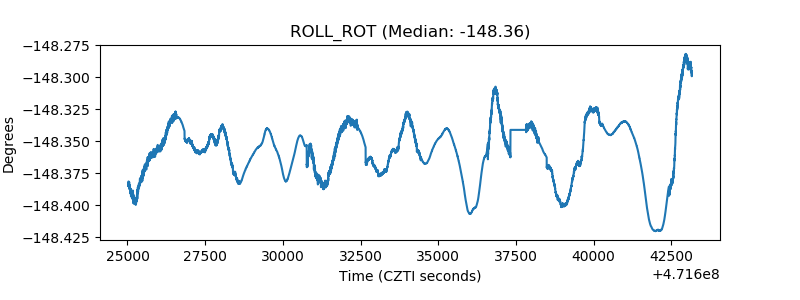 |
| _Roll_DEC | 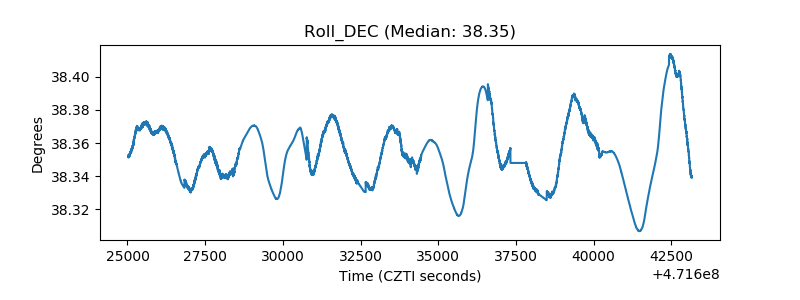 |
| _Roll_RA | 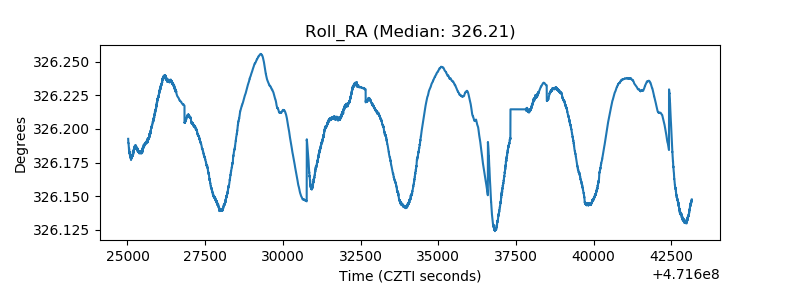 |
| Veto Counter | 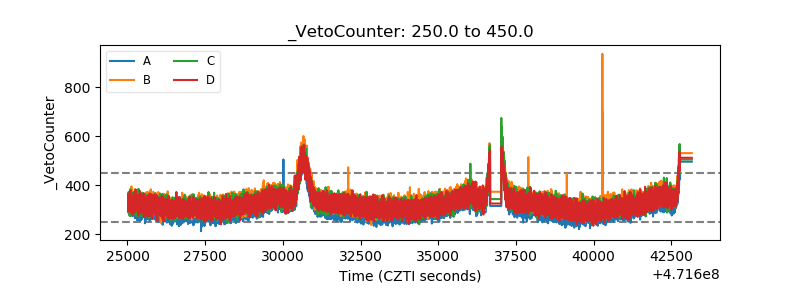 |