| Param | Original file | Final file |
|---|---|---|
| Filename | modeM0/AS1A13_037T01_9000006440_49791cztM0_level2.fits | modeM0/AS1A13_037T01_9000006440_49791cztM0_level2_quad_clean.evt |
| Size (bytes) | 1,172,471,040 | 57,911,040 |
| Size | 1.1 GB | 55.2 MB |
| Events in quadrant A | 9,666,188 | 539,329 |
| Events in quadrant B | 6,745,723 | 638,092 |
| Events in quadrant C | 8,078,346 | 54,260 |
| Events in quadrant D | 18,335,360 | 4,950 |
| Mode M9 | |||
|---|---|---|---|
| Quadrant | BADHDUFLAG | Total packets | Discarded packets |
| A | 0 | 14 | 0 |
| B | 0 | 14 | 0 |
| C | 0 | 14 | 0 |
| D | 0 | 14 | 0 |
| Mode SS | |||
|---|---|---|---|
| Quadrant | BADHDUFLAG | Total packets | Discarded packets |
| A | 0 | 154 | 0 |
| B | 0 | 154 | 0 |
| C | 0 | 154 | 0 |
| D | 0 | 154 | 0 |
| Mode M0 | |||
|---|---|---|---|
| Quadrant | BADHDUFLAG | Total packets | Discarded packets |
| A | 0 | 33888 | 2 |
| B | 0 | 25220 | 2 |
| C | 0 | 29225 | 4 |
| D | 0 | 59458 | 2 |
| Quadrant | Total seconds | Saturated seconds | Saturation percentage |
|---|---|---|---|
| A | 7413 | 1768 | 23.849993% |
| B | 7414 | 1181 | 15.929323% |
| C | 7413 | 6909 | 93.201133% |
| D | 7413 | 7364 | 99.338999% |
Noise dominated data is calculated using 1-second bins in cleaned event files. If a bin has >2000 counts, and if more than 50% of those come from <1% of pixels, then it is considered to be noise-dominated and hence unusable.
| Quadrant | # 1 sec bins | Bins with >0 counts | Bins with >2000 counts | High rate bins dominated by noise | Noise dominated (total time) | Noise dominated (detector-on time) | Marked lightcurve |
|---|---|---|---|---|---|---|---|
| A | 8898 | 7415 | 1497 | 1497 | 16.82% | 20.19% | 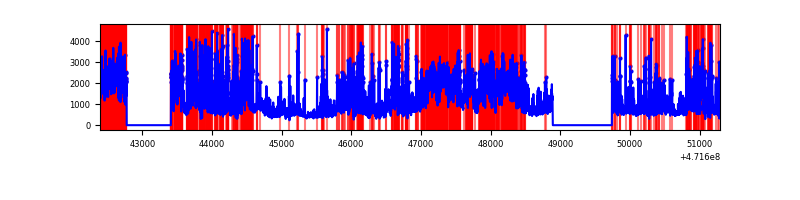 |
| B | 8899 | 7416 | 951 | 951 | 10.69% | 12.82% | 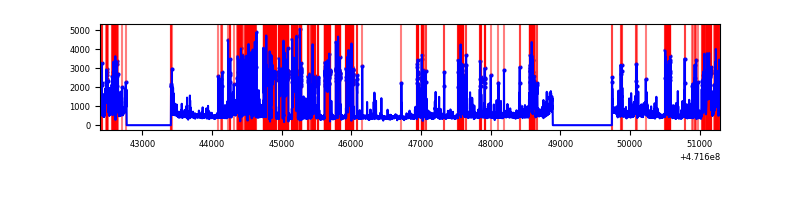 |
| C | 8897 | 7412 | 1762 | 1762 | 19.80% | 23.77% | 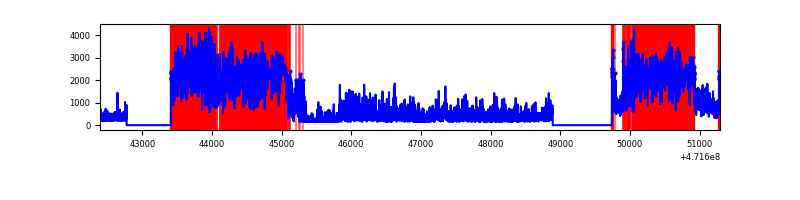 |
| D | 8897 | 7412 | 7025 | 7025 | 78.96% | 94.78% | 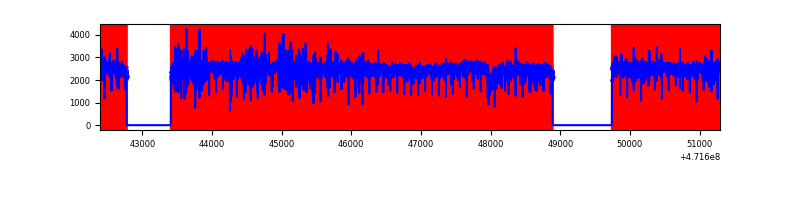 |
Top three noisy pixels from each quadrant. If the there are fewer than three noisy pixels in the level2.evt file, extra rows are filled as -1
| Pixel properties | Quadrant properties | ||||||
|---|---|---|---|---|---|---|---|
| Quadrant | DetID | PixID | Counts | Sigma | Mean | Median | Sigma |
| A | 0 | 98 | 1834049 | 9777.83 | 728 | 709 | 187.5 |
| A | 15 | 63 | 905020 | 4823.0 | 728 | 709 | 187.5 |
| A | 12 | 50 | 752700 | 4010.63 | 728 | 709 | 187.5 |
| B | 5 | 172 | 1537972 | 9838.17 | 734 | 709 | 156.3 |
| B | 10 | 28 | 998245 | 6384.03 | 734 | 709 | 156.3 |
| B | 1 | 255 | 333743 | 2131.35 | 734 | 709 | 156.3 |
| C | 15 | 147 | 1377608 | 22849.74 | 180 | 176 | 60.3 |
| C | 15 | 148 | 1341282 | 22247.14 | 180 | 176 | 60.3 |
| C | 15 | 197 | 1088092 | 18047.06 | 180 | 176 | 60.3 |
| D | 14 | 52 | 4246100 | 52704.83 | 205 | 193 | 80.6 |
| D | 8 | 129 | 3431296 | 42590.6 | 205 | 193 | 80.6 |
| D | 7 | 61 | 2342168 | 29071.15 | 205 | 193 | 80.6 |
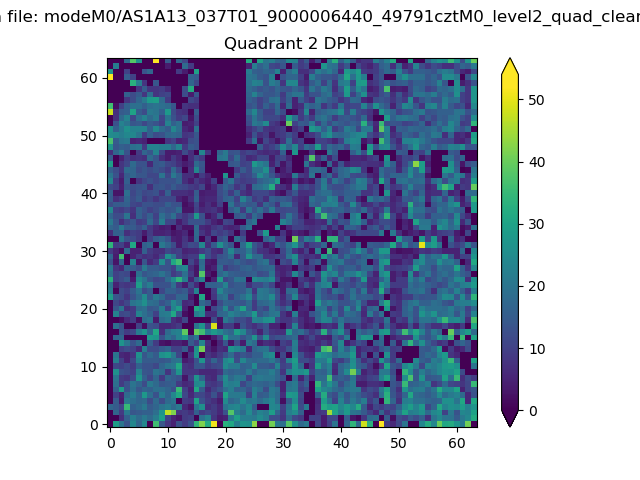
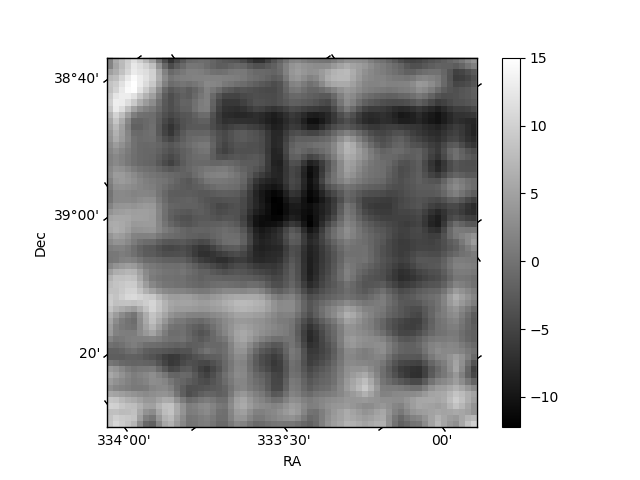
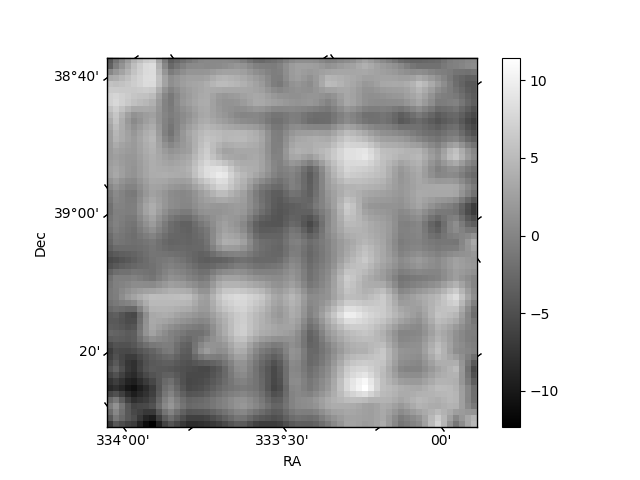
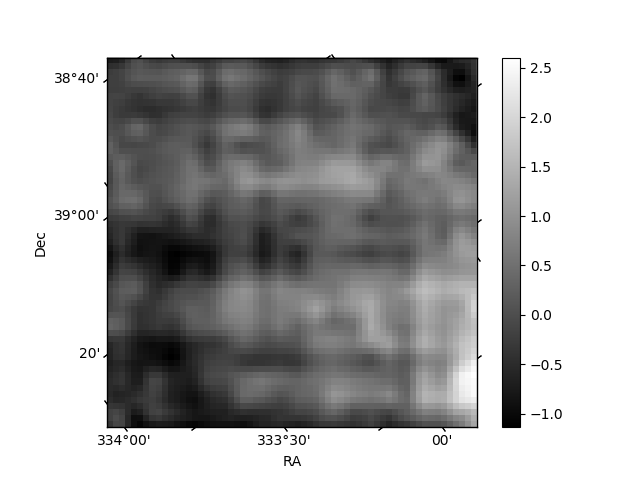
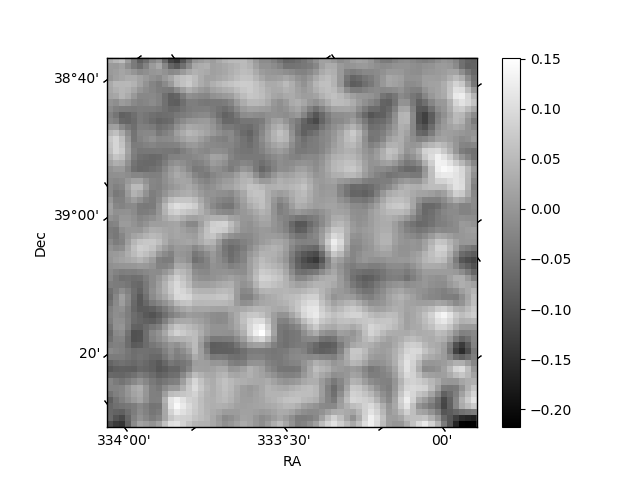
Histogram calculated using DETX and DETY for each event in the final _common_clean file
| Quadrant A | 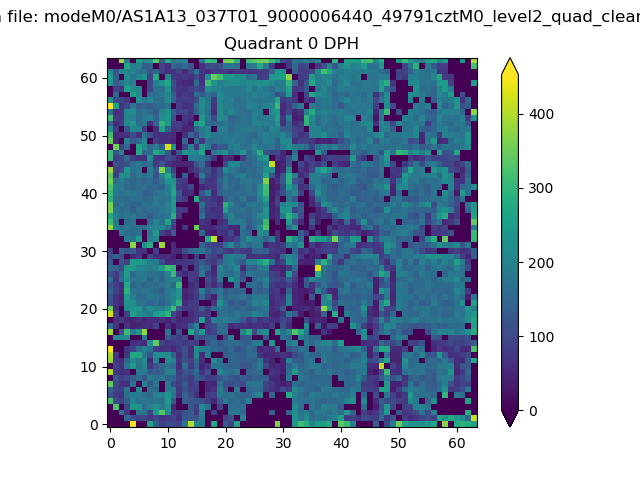 |
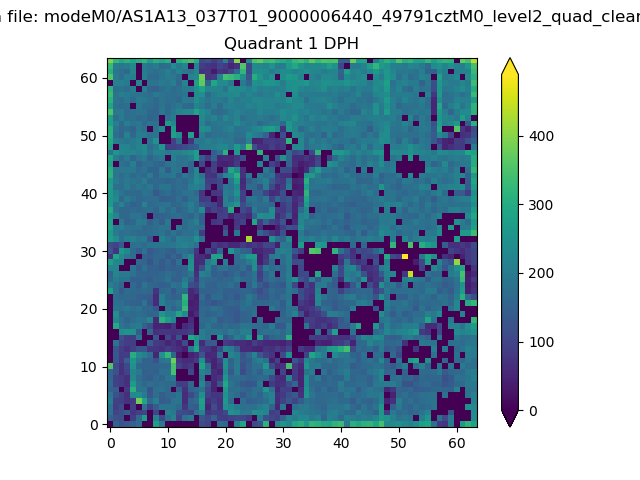 |
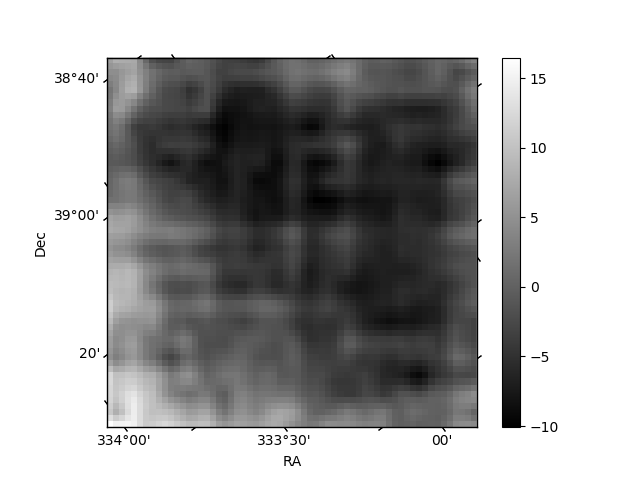
Quadrant B |
|---|---|---|---|
| Quadrant D | 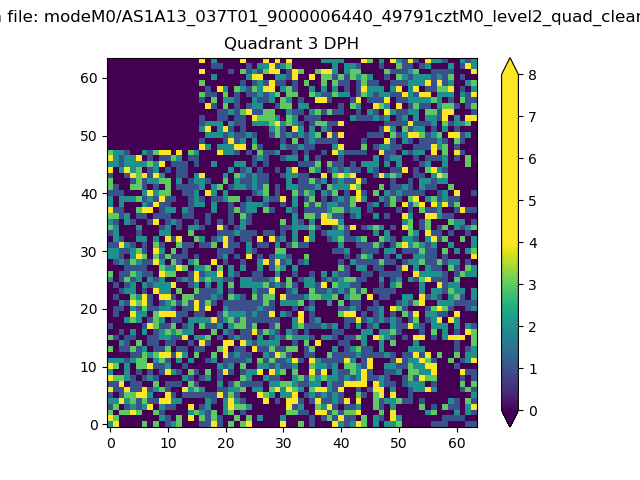 |
 |
Quadrant C |
| Plot type | Count rate plots | Images |
|---|---|---|
| Comparison with Poisson distribution Blue bars denote a histogram of data divided into 1 sec bins. Red curve is a Poisson curve with rate = median count rate of data. |
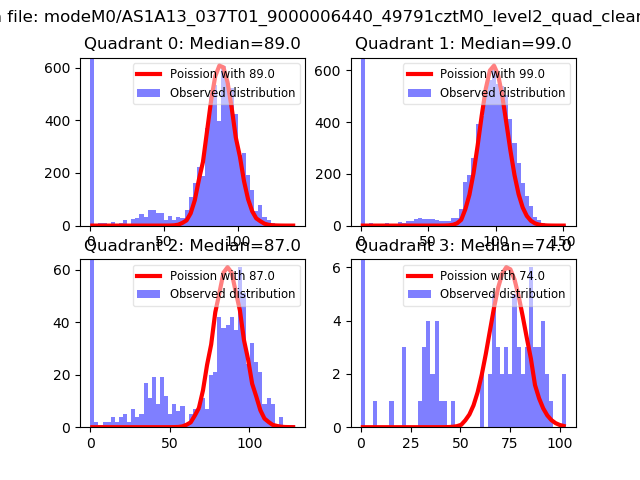 |
 |
| Quadrant-wise count rates Data is divided into 100 sec bins |
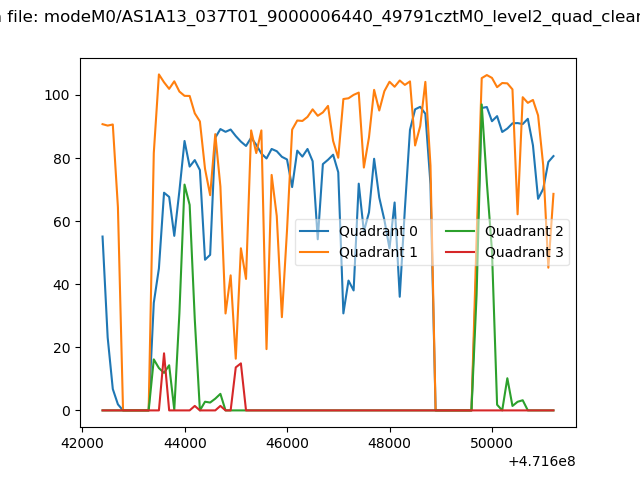 |
|
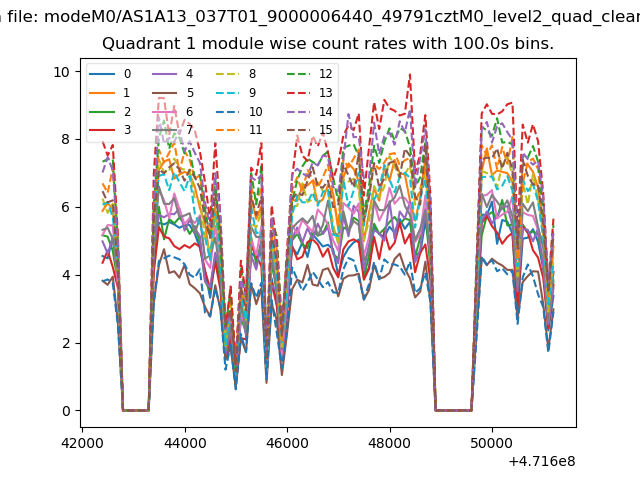
| Module-wise count rates for Quadrant A Data is divided into 100 sec bins |
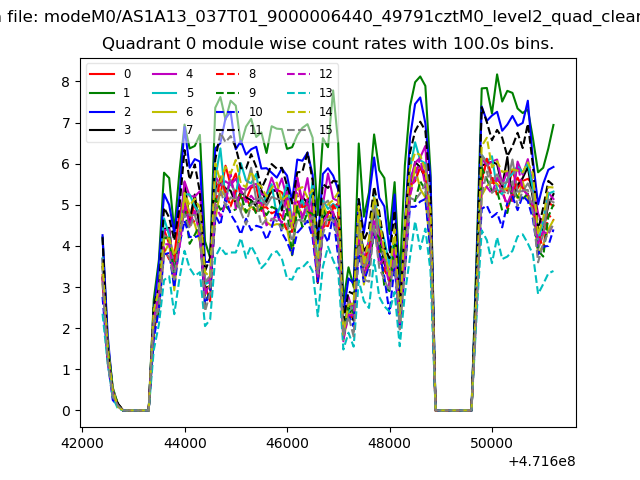 |
 |
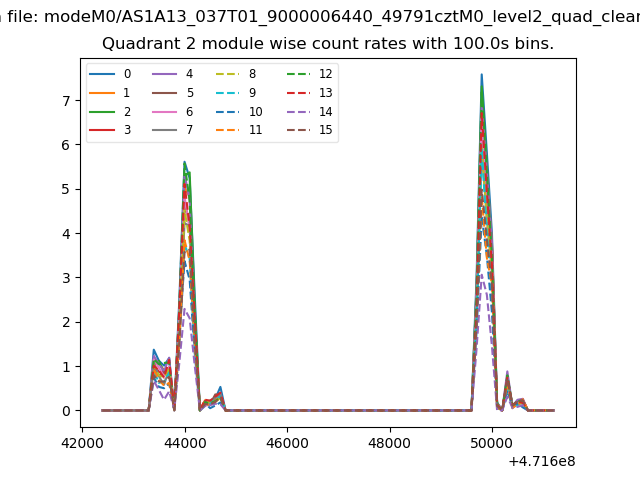
| Module-wise count rates for Quadrant B Data is divided into 100 sec bins |
 |
 |
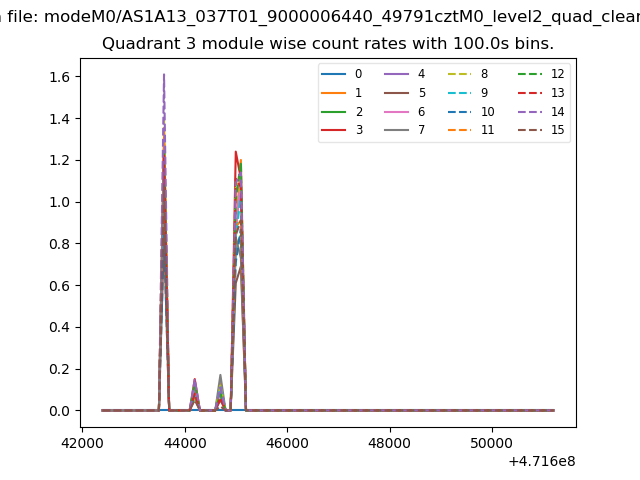
| Module-wise count rates for Quadrant C Data is divided into 100 sec bins |
 |
 |
| Module-wise count rates for Quadrant D Data is divided into 100 sec bins |
 |
 |
| Parameter | Plot |
|---|---|
| CZT HV Monitor | 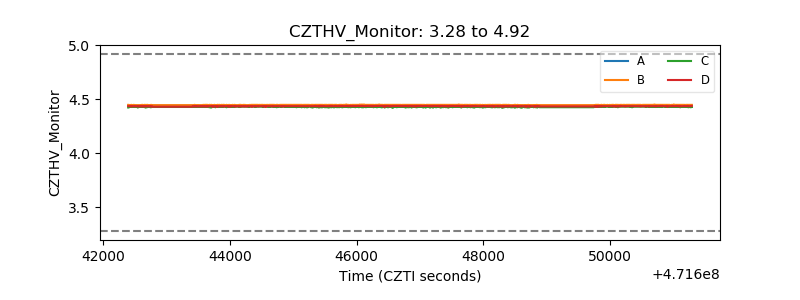 |
| D_VDD | 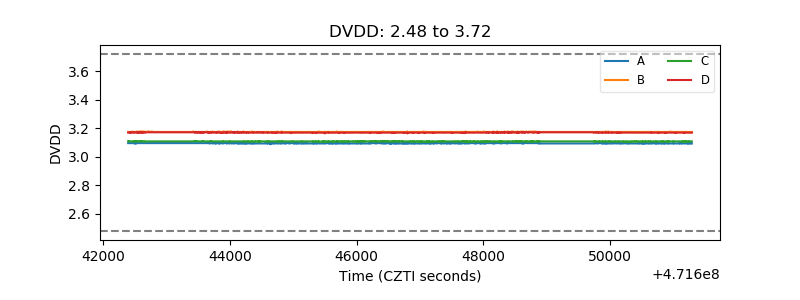 |
| Temperature 1 | 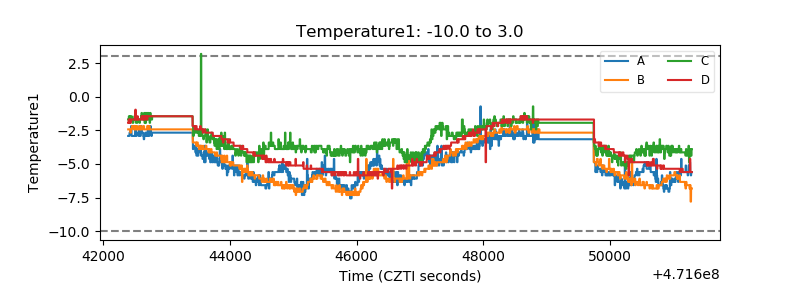 |
| Veto HV Monitor | 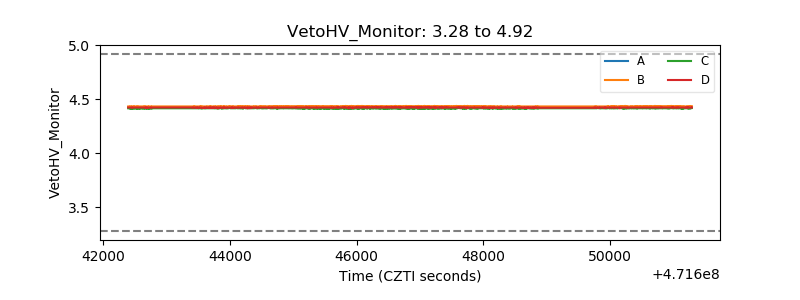 |
| Veto LLD | 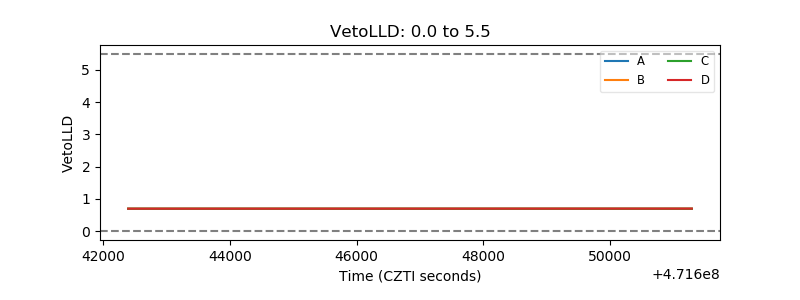 |
| Alpha Counter | 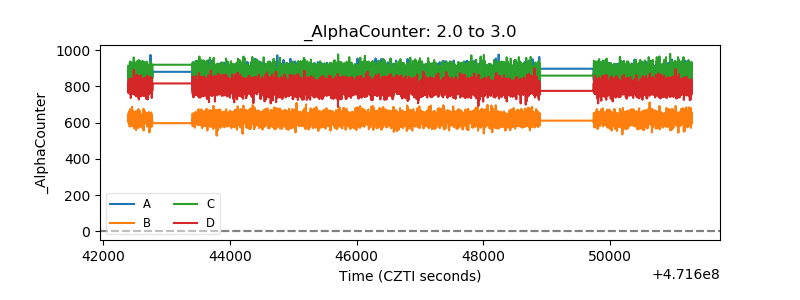 |
| _CPM_Rate | 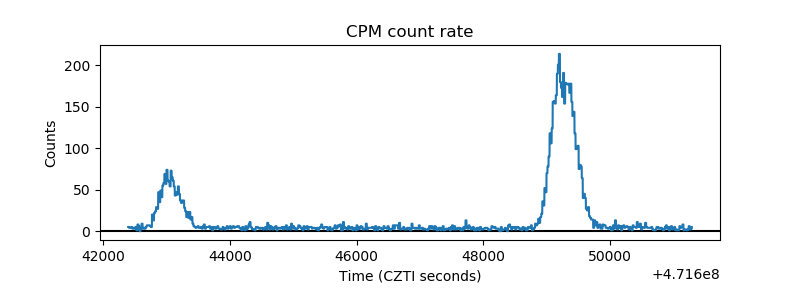 |
| CZT Counter | 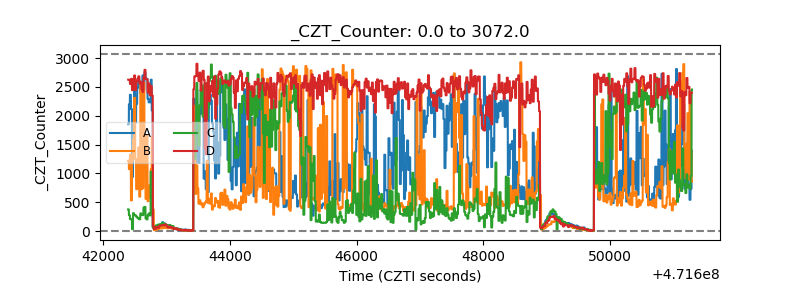 |
| +2.5 Volts monitor | 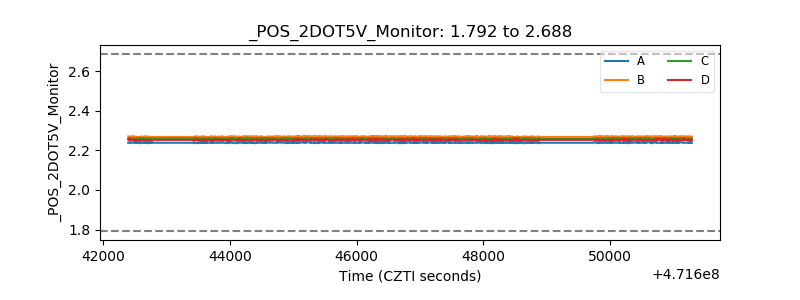 |
| +5 Volts monitor | 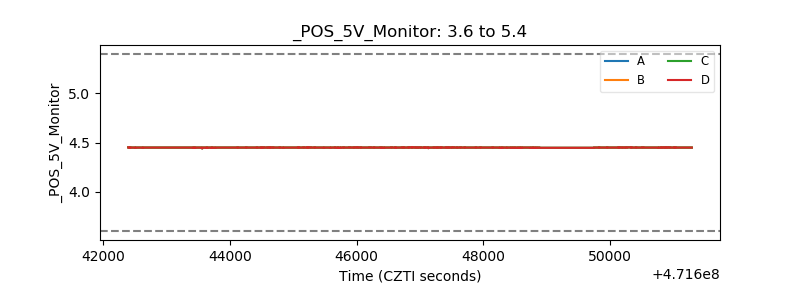 |
| _ROLL_ROT | 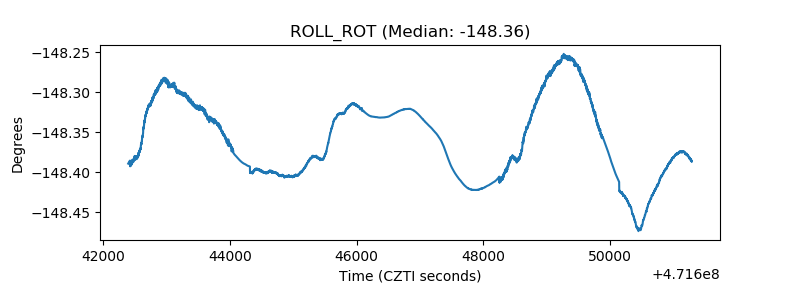 |
| _Roll_DEC | 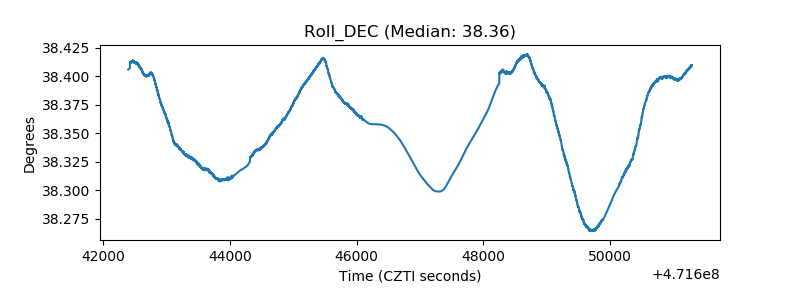 |
| _Roll_RA | 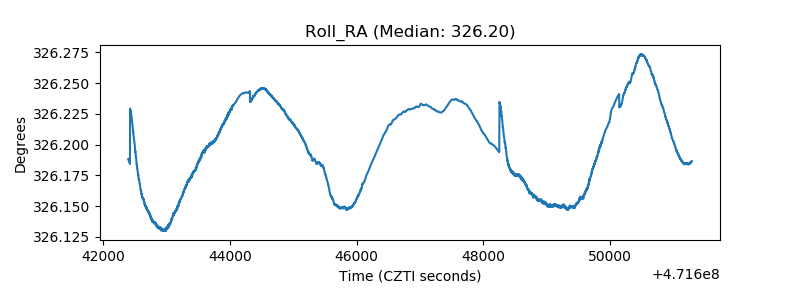 |
| Veto Counter | 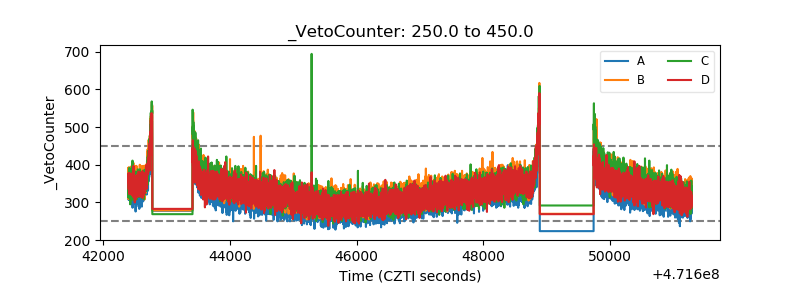 |