| Param | Original file | Final file |
|---|---|---|
| Filename | modeM0/AS1A13_037T01_9000006440_49792cztM0_level2.fits | modeM0/AS1A13_037T01_9000006440_49792cztM0_level2_quad_clean.evt |
| Size (bytes) | 914,993,280 | 56,511,360 |
| Size | 872.6 MB | 53.9 MB |
| Events in quadrant A | 6,850,889 | 526,606 |
| Events in quadrant B | 5,089,600 | 580,407 |
| Events in quadrant C | 6,896,220 | 76,032 |
| Events in quadrant D | 14,567,138 | 103,069 |
| Mode M9 | |||
|---|---|---|---|
| Quadrant | BADHDUFLAG | Total packets | Discarded packets |
| A | 0 | 10 | 0 |
| B | 0 | 10 | 0 |
| C | 0 | 10 | 0 |
| D | 0 | 10 | 0 |
| Mode SS | |||
|---|---|---|---|
| Quadrant | BADHDUFLAG | Total packets | Discarded packets |
| A | 0 | 122 | 0 |
| B | 0 | 122 | 0 |
| C | 0 | 122 | 0 |
| D | 0 | 122 | 0 |
| Mode M0 | |||
|---|---|---|---|
| Quadrant | BADHDUFLAG | Total packets | Discarded packets |
| A | 0 | 24591 | 0 |
| B | 0 | 19315 | 0 |
| C | 0 | 24732 | 0 |
| D | 0 | 47344 | 0 |
| Quadrant | Total seconds | Saturated seconds | Saturation percentage |
|---|---|---|---|
| A | 5992 | 708 | 11.815754% |
| B | 5993 | 620 | 10.345403% |
| C | 5993 | 5682 | 94.810612% |
| D | 5993 | 5993 | 100.000000% |
Noise dominated data is calculated using 1-second bins in cleaned event files. If a bin has >2000 counts, and if more than 50% of those come from <1% of pixels, then it is considered to be noise-dominated and hence unusable.
| Quadrant | # 1 sec bins | Bins with >0 counts | Bins with >2000 counts | High rate bins dominated by noise | Noise dominated (total time) | Noise dominated (detector-on time) | Marked lightcurve |
|---|---|---|---|---|---|---|---|
| A | 6987 | 5993 | 588 | 588 | 8.42% | 9.81% | 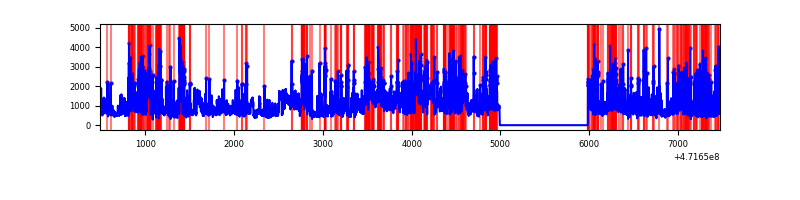 |
| B | 6988 | 5994 | 498 | 498 | 7.13% | 8.31% | 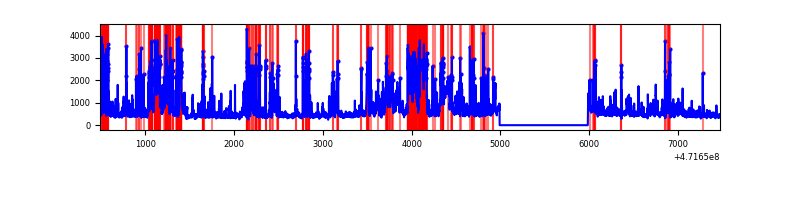 |
| C | 6987 | 5992 | 710 | 710 | 10.16% | 11.85% | 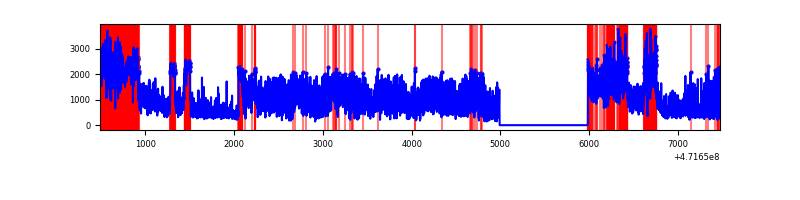 |
| D | 6987 | 5992 | 5681 | 5681 | 81.31% | 94.81% | 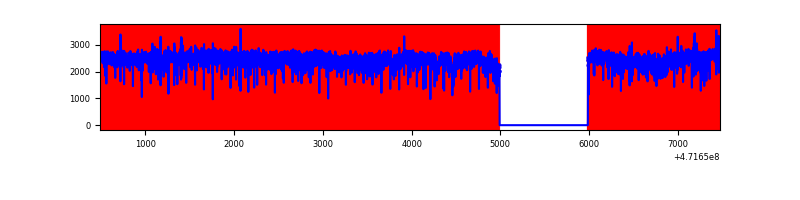 |
Top three noisy pixels from each quadrant. If the there are fewer than three noisy pixels in the level2.evt file, extra rows are filled as -1
| Pixel properties | Quadrant properties | ||||||
|---|---|---|---|---|---|---|---|
| Quadrant | DetID | PixID | Counts | Sigma | Mean | Median | Sigma |
| A | 15 | 63 | 663840 | 4227.68 | 607 | 592 | 156.9 |
| A | 12 | 50 | 539053 | 3432.26 | 607 | 592 | 156.9 |
| A | 4 | 204 | 492357 | 3134.61 | 607 | 592 | 156.9 |
| B | 10 | 28 | 1747709 | 13615.51 | 604 | 586 | 128.3 |
| B | 1 | 207 | 434582 | 3382.18 | 604 | 586 | 128.3 |
| B | 5 | 185 | 215155 | 1672.16 | 604 | 586 | 128.3 |
| C | 15 | 148 | 2508713 | 74846.23 | 98 | 97 | 33.5 |
| C | 15 | 147 | 1039640 | 31015.46 | 98 | 97 | 33.5 |
| C | 15 | 174 | 682073 | 20347.21 | 98 | 97 | 33.5 |
| D | 8 | 129 | 2990228 | 52655.13 | 141 | 133 | 56.8 |
| D | 14 | 52 | 2220492 | 39100.19 | 141 | 133 | 56.8 |
| D | 15 | 168 | 2089304 | 36789.99 | 141 | 133 | 56.8 |
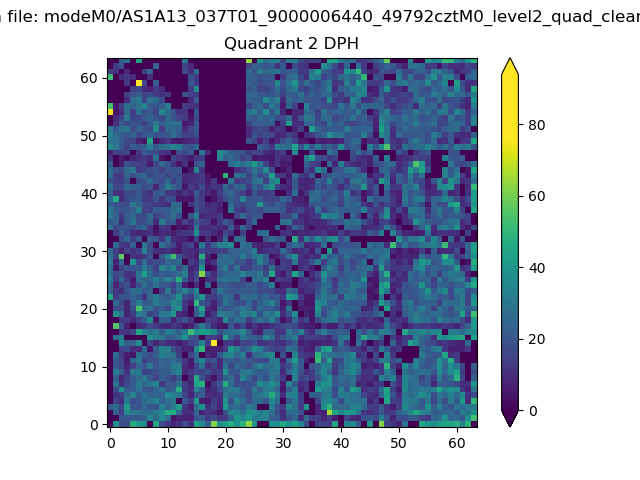
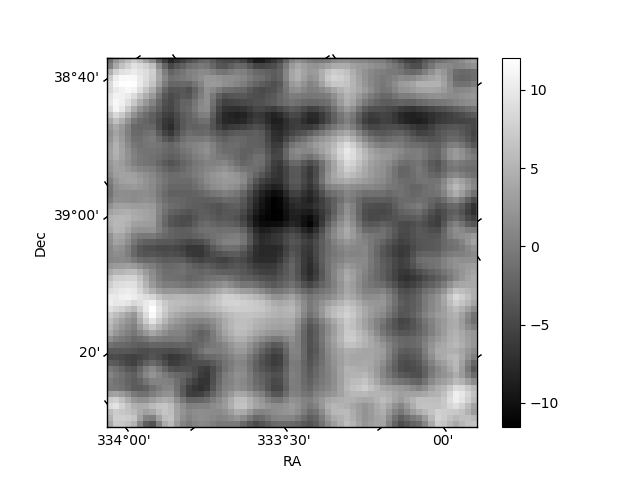
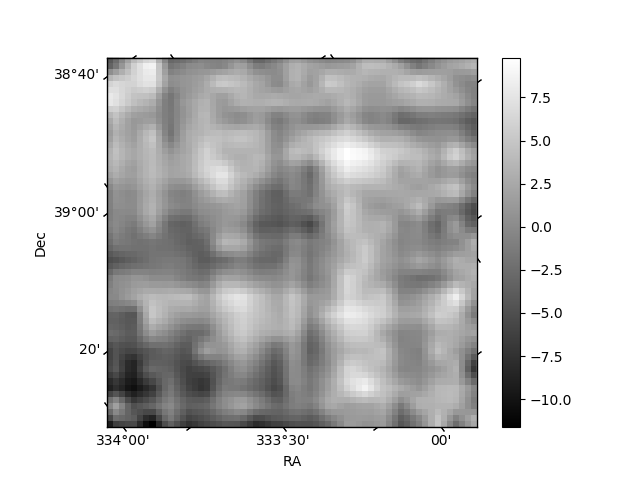
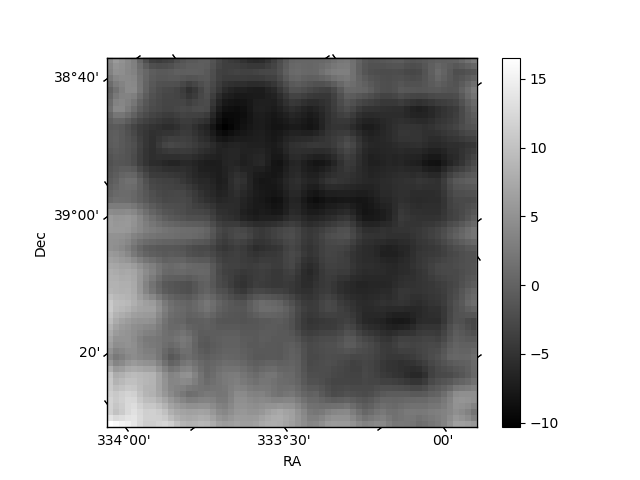
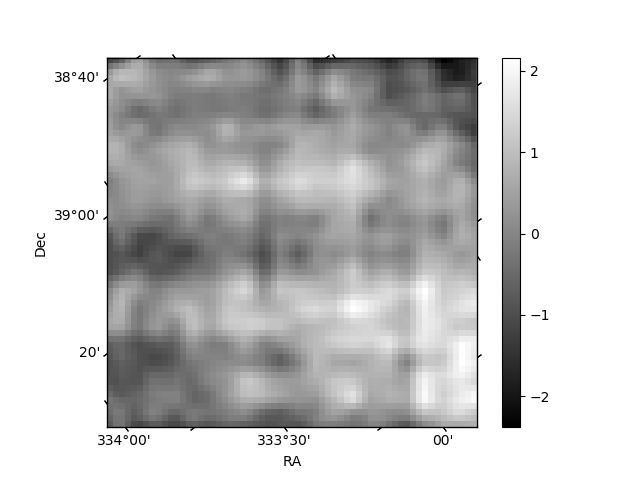
Histogram calculated using DETX and DETY for each event in the final _common_clean file
| Quadrant A | 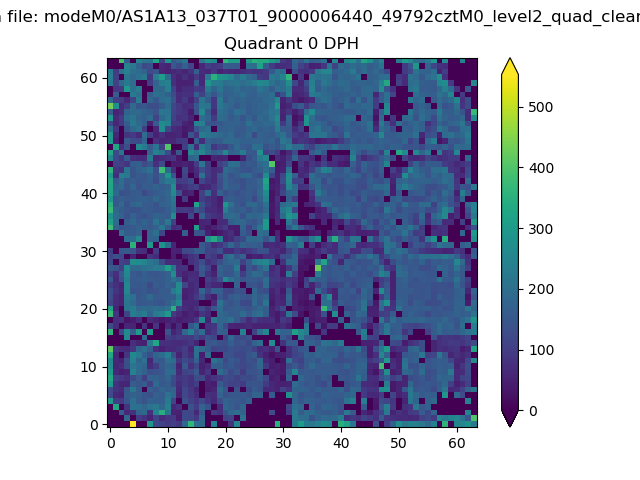 |
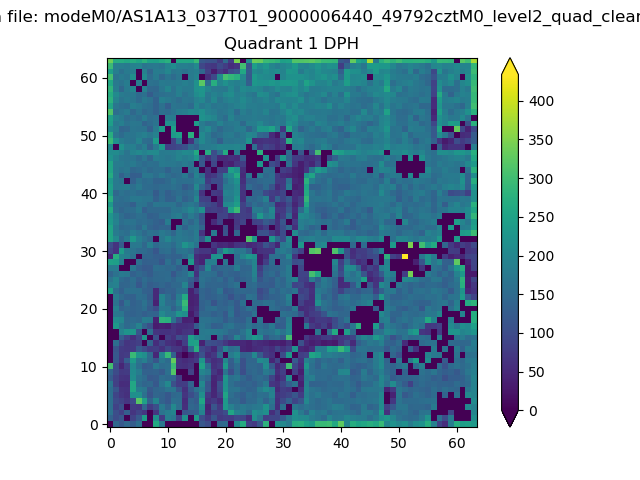 |
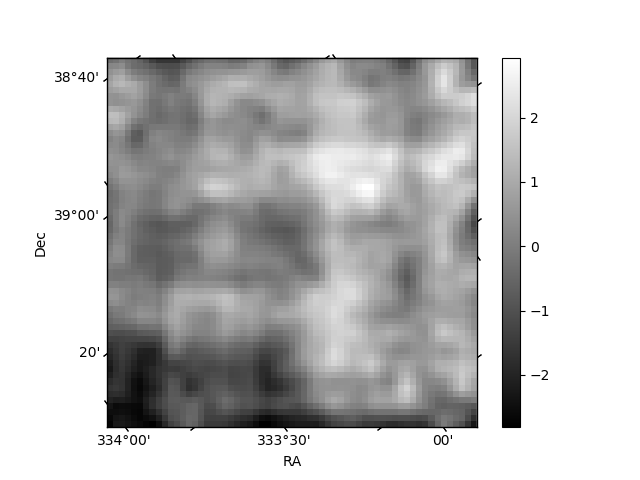
Quadrant B |
|---|---|---|---|
| Quadrant D | 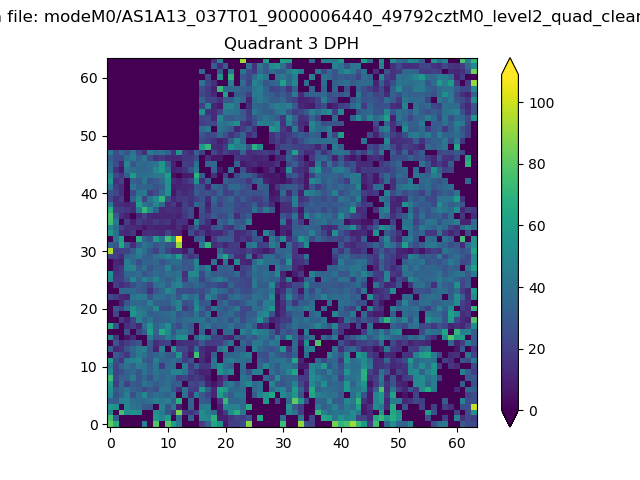 |
 |
Quadrant C |
| Plot type | Count rate plots | Images |
|---|---|---|
| Comparison with Poisson distribution Blue bars denote a histogram of data divided into 1 sec bins. Red curve is a Poisson curve with rate = median count rate of data. |
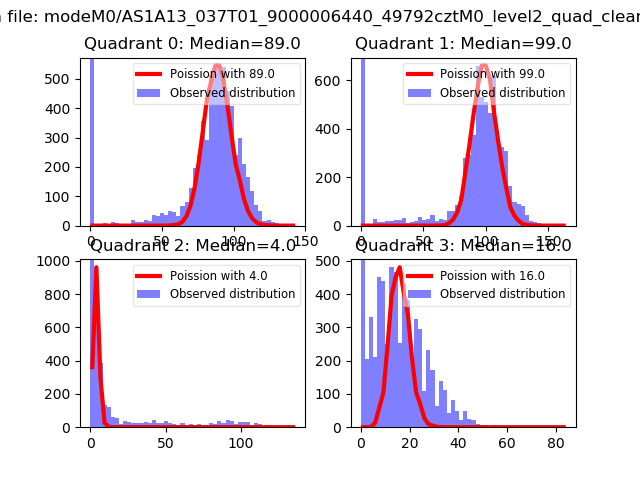 |
 |
| Quadrant-wise count rates Data is divided into 100 sec bins |
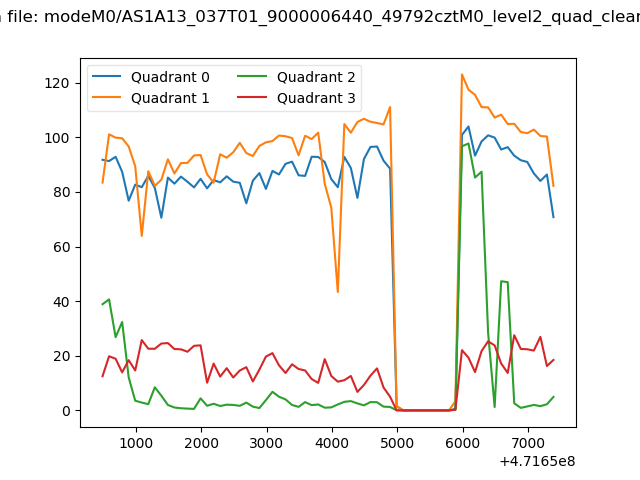 |
|
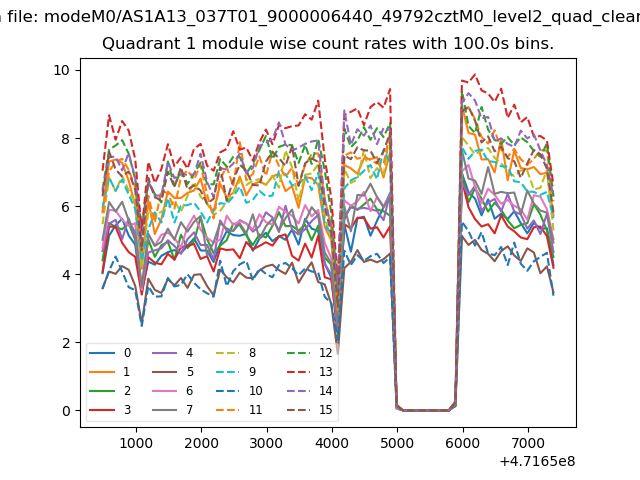
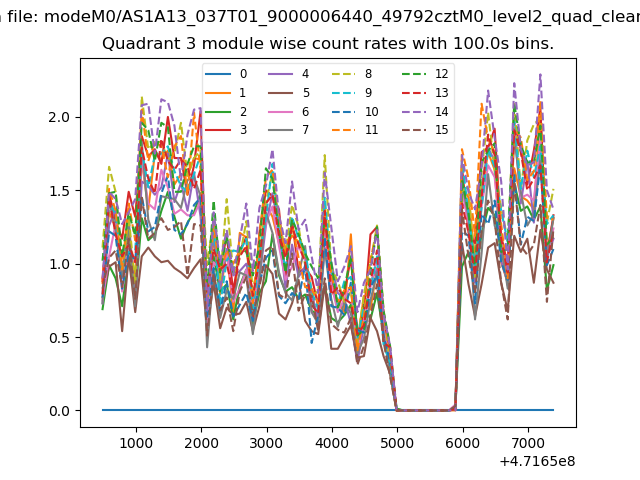
| Module-wise count rates for Quadrant A Data is divided into 100 sec bins |
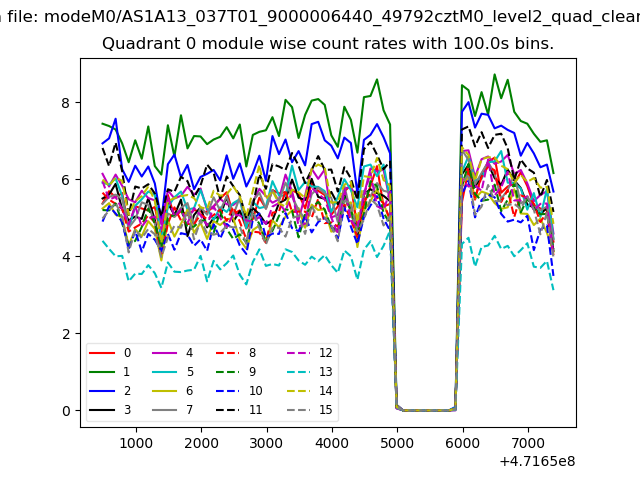 |
 |
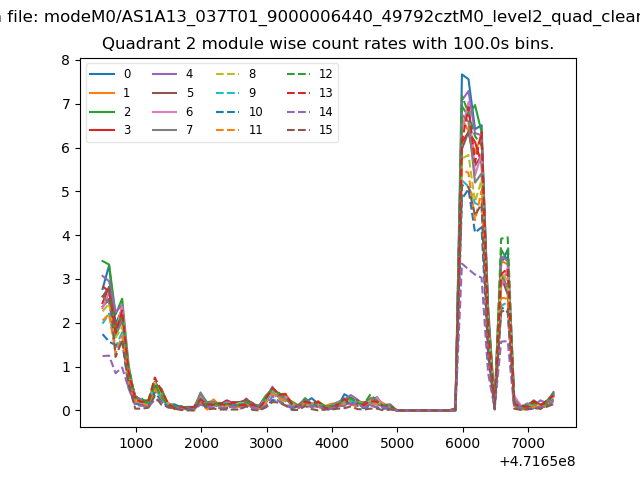
| Module-wise count rates for Quadrant B Data is divided into 100 sec bins |
 |
 |
| Module-wise count rates for Quadrant C Data is divided into 100 sec bins |
 |
 |
| Module-wise count rates for Quadrant D Data is divided into 100 sec bins |
 |
 |
| Parameter | Plot |
|---|---|
| CZT HV Monitor | 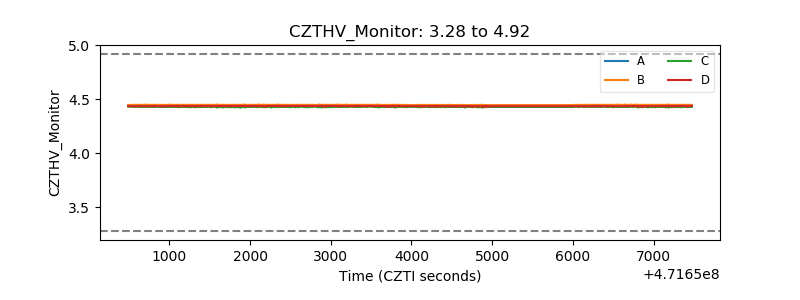 |
| D_VDD | 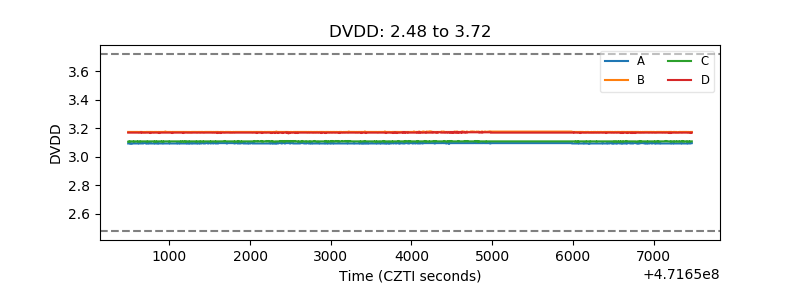 |
| Temperature 1 | 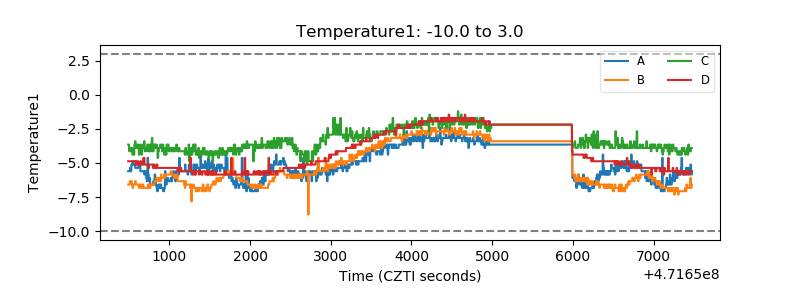 |
| Veto HV Monitor | 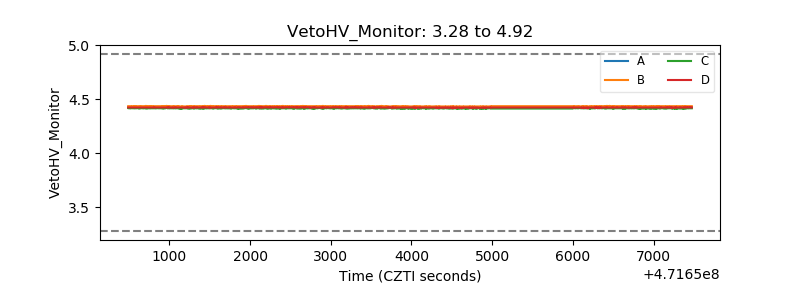 |
| Veto LLD | 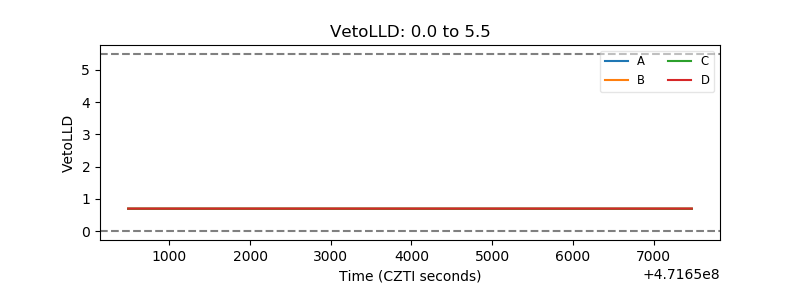 |
| Alpha Counter | 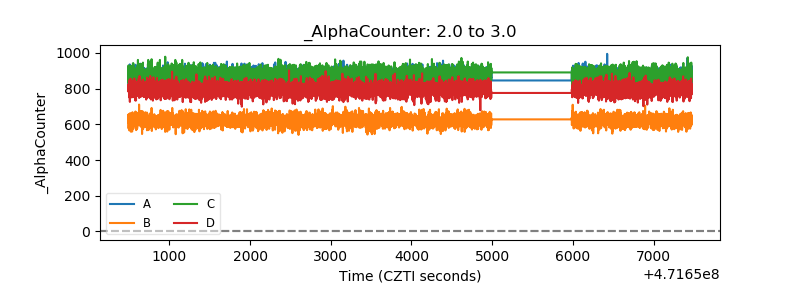 |
| _CPM_Rate | 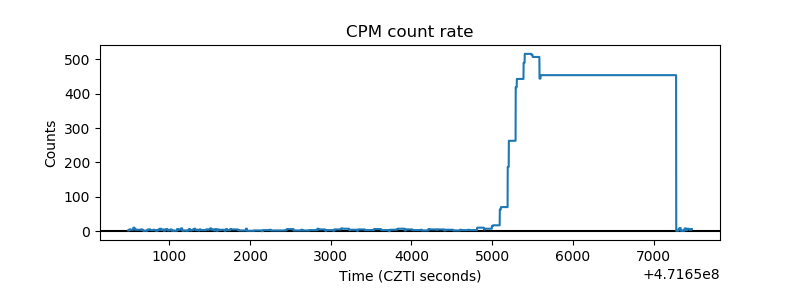 |
| CZT Counter | 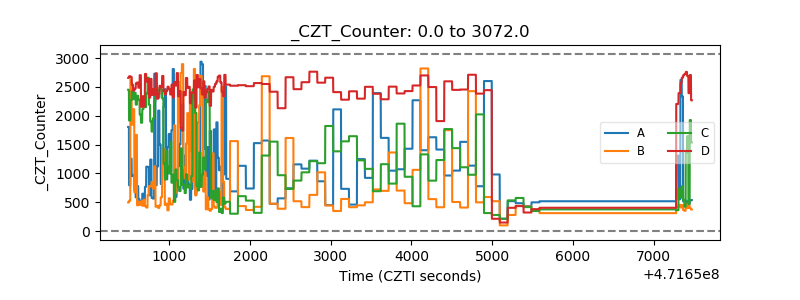 |
| +2.5 Volts monitor | 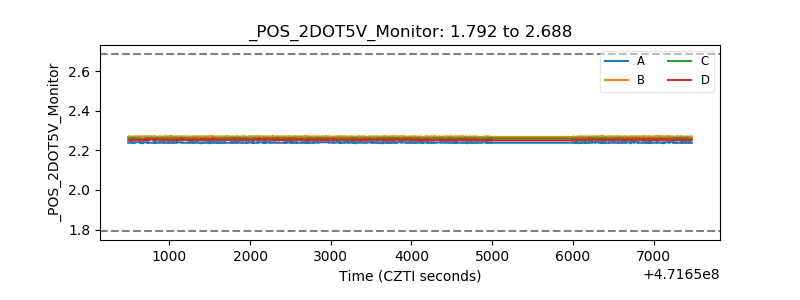 |
| +5 Volts monitor | 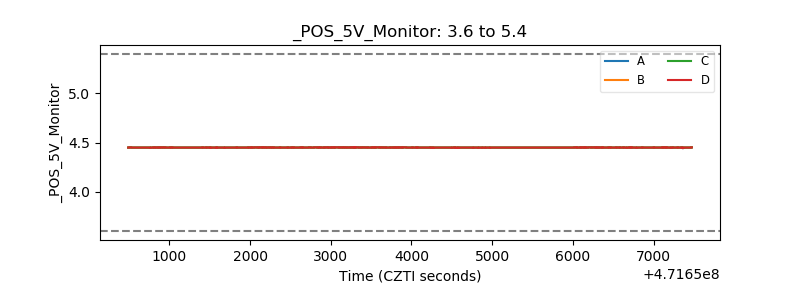 |
| _ROLL_ROT | 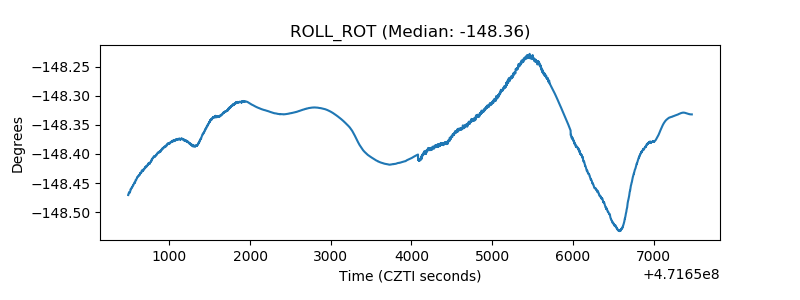 |
| _Roll_DEC | 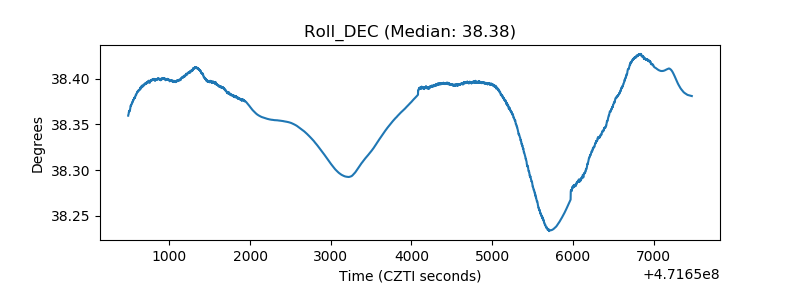 |
| _Roll_RA | 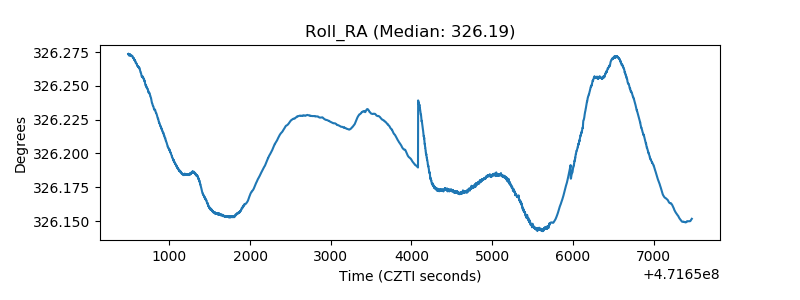 |
| Veto Counter | 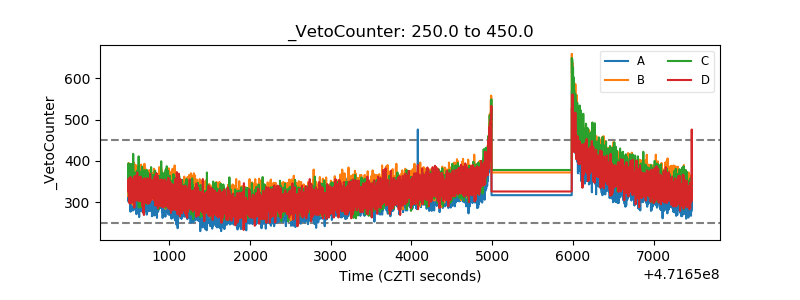 |