| Param | Original file | Final file |
|---|---|---|
| Filename | modeM0/AS1A13_037T01_9000006440_49794cztM0_level2.fits | modeM0/AS1A13_037T01_9000006440_49794cztM0_level2_quad_clean.evt |
| Size (bytes) | 1,009,854,720 | 57,222,720 |
| Size | 963.1 MB | 54.6 MB |
| Events in quadrant A | 8,582,014 | 481,367 |
| Events in quadrant B | 3,507,610 | 684,324 |
| Events in quadrant C | 8,910,933 | 69,162 |
| Events in quadrant D | 15,872,989 | 41,353 |
| Mode M9 | |||
|---|---|---|---|
| Quadrant | BADHDUFLAG | Total packets | Discarded packets |
| A | 0 | 11 | 0 |
| B | 0 | 11 | 0 |
| C | 0 | 11 | 0 |
| D | 0 | 11 | 0 |
| Mode SS | |||
|---|---|---|---|
| Quadrant | BADHDUFLAG | Total packets | Discarded packets |
| A | 0 | 132 | 0 |
| B | 0 | 132 | 0 |
| C | 0 | 132 | 0 |
| D | 0 | 132 | 0 |
| Mode M0 | |||
|---|---|---|---|
| Quadrant | BADHDUFLAG | Total packets | Discarded packets |
| A | 0 | 30055 | 1 |
| B | 0 | 15016 | 1 |
| C | 0 | 31109 | 1 |
| D | 0 | 51623 | 8 |
| Quadrant | Total seconds | Saturated seconds | Saturation percentage |
|---|---|---|---|
| A | 6543 | 1676 | 25.615161% |
| B | 6543 | 112 | 1.711753% |
| C | 6543 | 5973 | 91.288400% |
| D | 6543 | 6186 | 94.543787% |
Noise dominated data is calculated using 1-second bins in cleaned event files. If a bin has >2000 counts, and if more than 50% of those come from <1% of pixels, then it is considered to be noise-dominated and hence unusable.
| Quadrant | # 1 sec bins | Bins with >0 counts | Bins with >2000 counts | High rate bins dominated by noise | Noise dominated (total time) | Noise dominated (detector-on time) | Marked lightcurve |
|---|---|---|---|---|---|---|---|
| A | 7632 | 6542 | 1425 | 1425 | 18.67% | 21.78% | 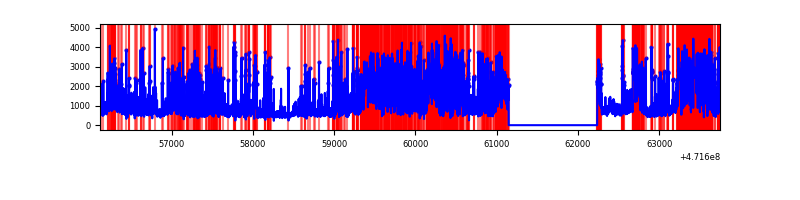 |
| B | 7633 | 6544 | 42 | 42 | 0.55% | 0.64% | 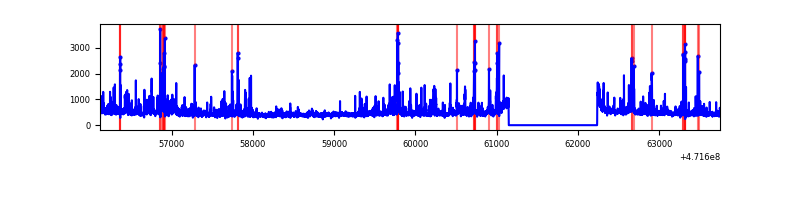 |
| C | 7632 | 6542 | 1005 | 1005 | 13.17% | 15.36% | 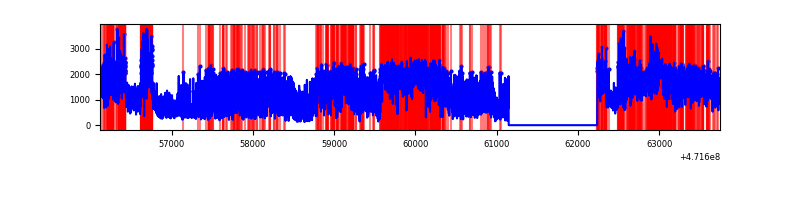 |
| D | 7632 | 6542 | 5814 | 5814 | 76.18% | 88.87% | 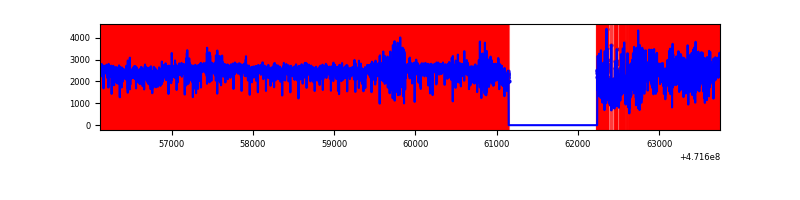 |
Top three noisy pixels from each quadrant. If the there are fewer than three noisy pixels in the level2.evt file, extra rows are filled as -1
| Pixel properties | Quadrant properties | ||||||
|---|---|---|---|---|---|---|---|
| Quadrant | DetID | PixID | Counts | Sigma | Mean | Median | Sigma |
| A | 5 | 17 | 1655429 | 10308.56 | 625 | 611 | 160.5 |
| A | 5 | 16 | 1395229 | 8687.66 | 625 | 611 | 160.5 |
| A | 15 | 63 | 693554 | 4316.63 | 625 | 611 | 160.5 |
| B | 5 | 185 | 223709 | 1481.84 | 710 | 687 | 150.5 |
| B | 4 | 206 | 106728 | 704.58 | 710 | 687 | 150.5 |
| B | 10 | 28 | 95005 | 626.69 | 710 | 687 | 150.5 |
| C | 15 | 148 | 2756865 | 58707.06 | 154 | 153 | 47.0 |
| C | 15 | 147 | 1605421 | 34185.86 | 154 | 153 | 47.0 |
| C | 15 | 213 | 575195 | 12246.12 | 154 | 153 | 47.0 |
| D | 8 | 129 | 2743155 | 33088.54 | 250 | 239 | 82.9 |
| D | 7 | 61 | 2681057 | 32339.44 | 250 | 239 | 82.9 |
| D | 15 | 168 | 2030087 | 24486.61 | 250 | 239 | 82.9 |
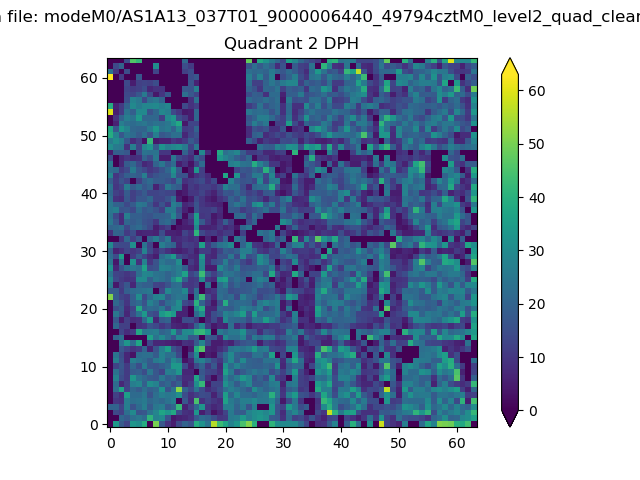
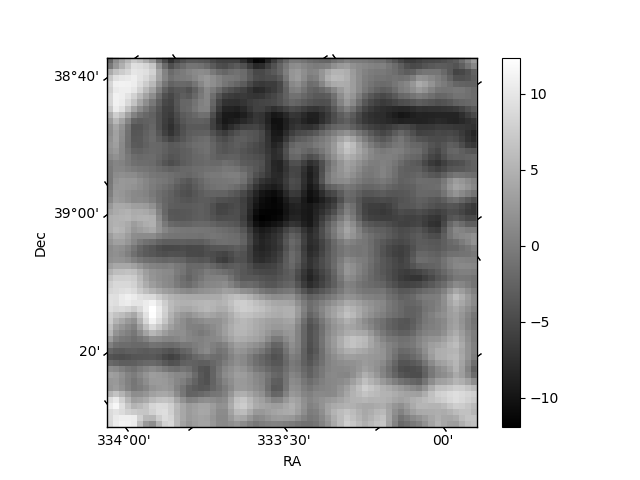
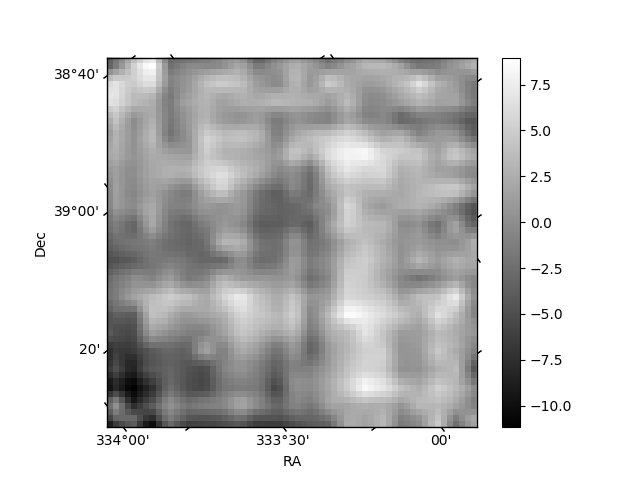
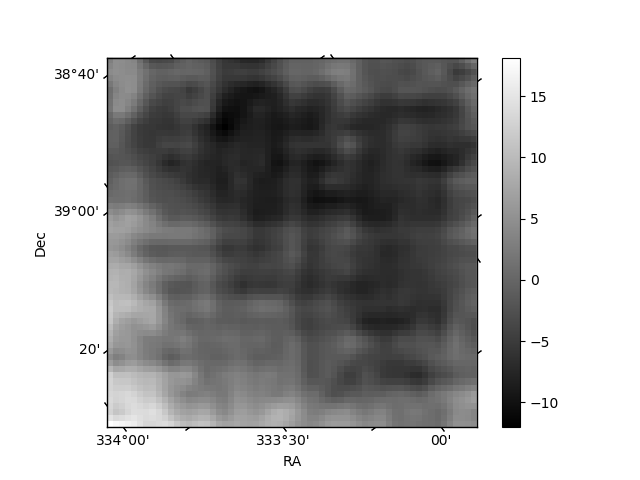
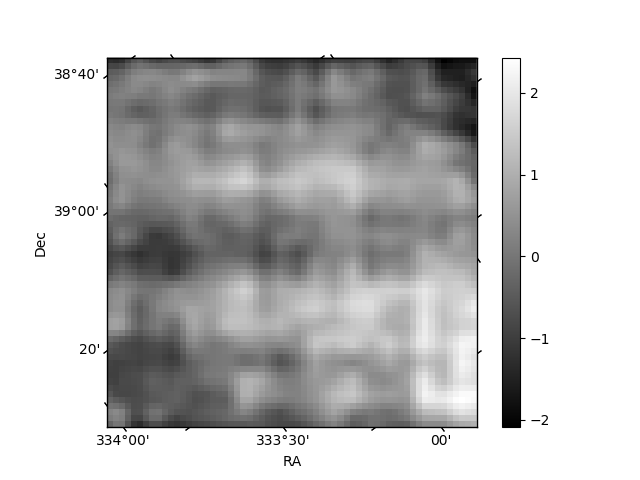
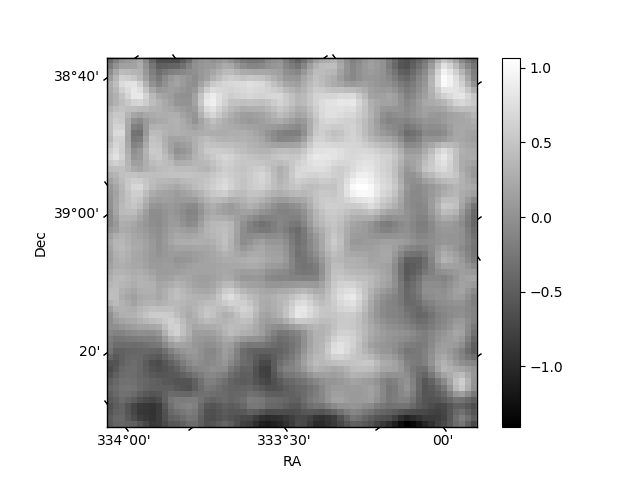
Histogram calculated using DETX and DETY for each event in the final _common_clean file
| Quadrant A | 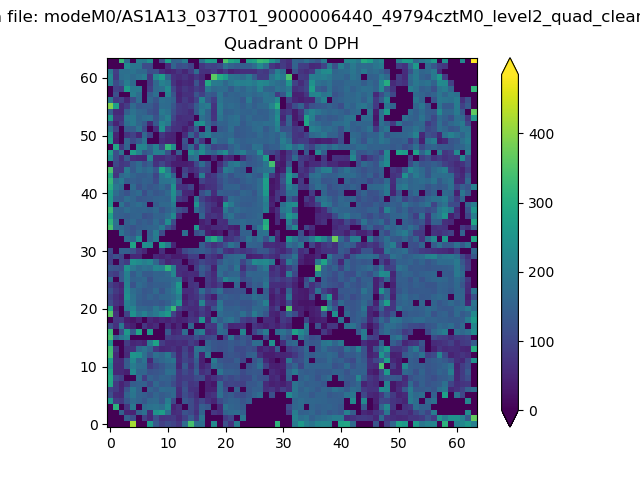 |
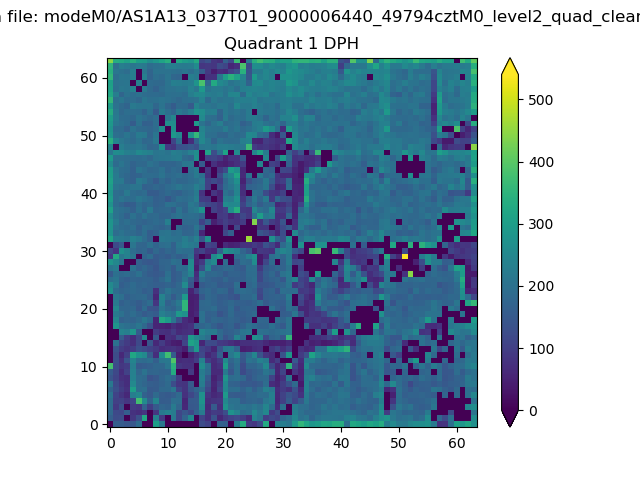 |
Quadrant B |
|---|---|---|---|
| Quadrant D | 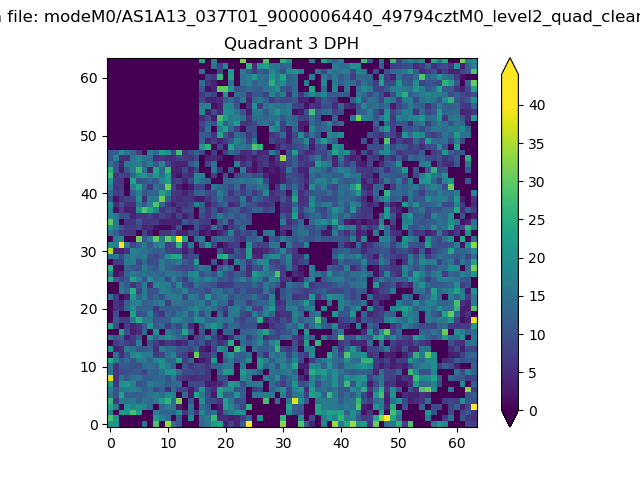 |
 |
Quadrant C |
| Plot type | Count rate plots | Images |
|---|---|---|
| Comparison with Poisson distribution Blue bars denote a histogram of data divided into 1 sec bins. Red curve is a Poisson curve with rate = median count rate of data. |
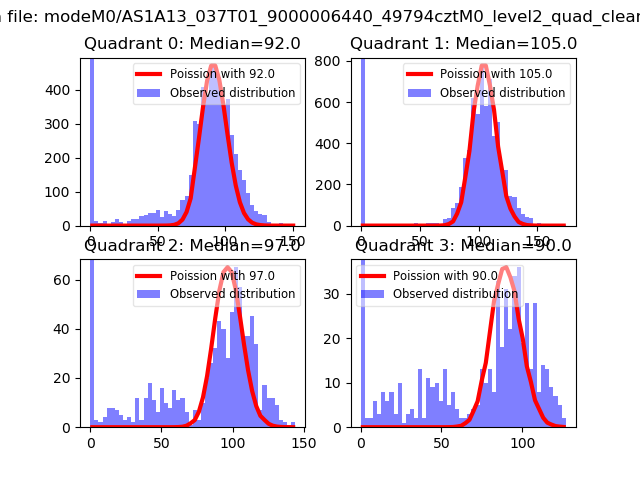 |
 |
| Quadrant-wise count rates Data is divided into 100 sec bins |
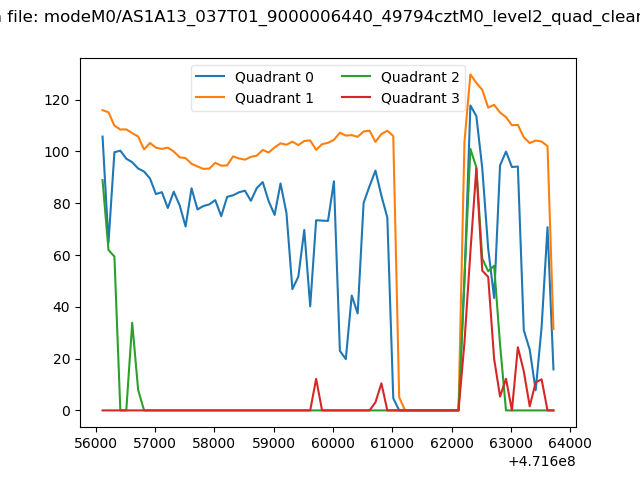 |
|
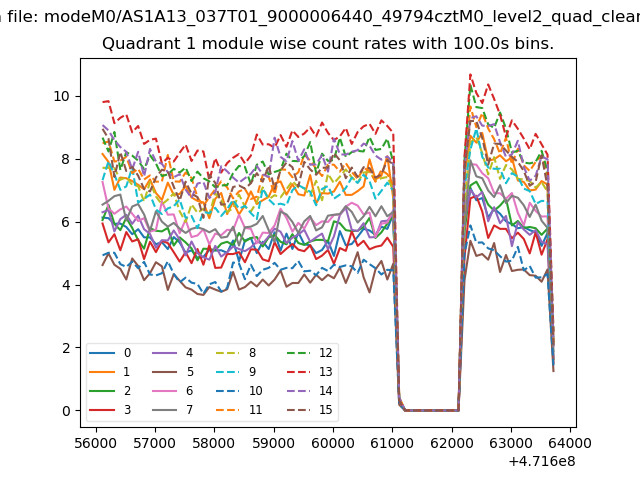
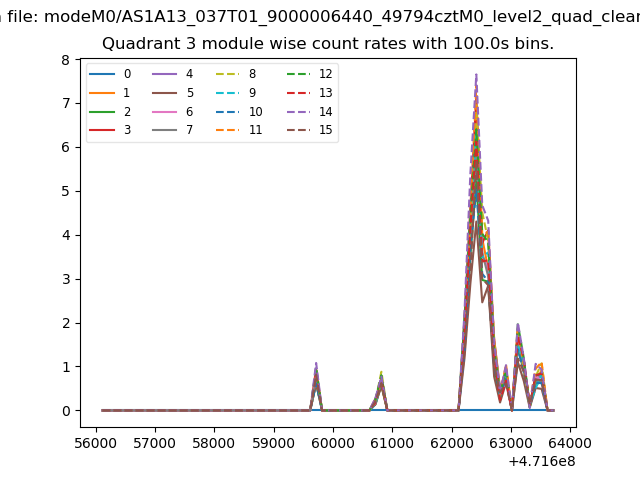
| Module-wise count rates for Quadrant A Data is divided into 100 sec bins |
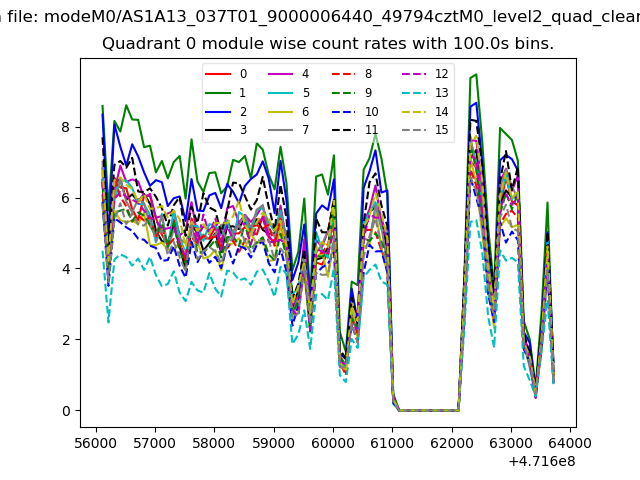 |
 |
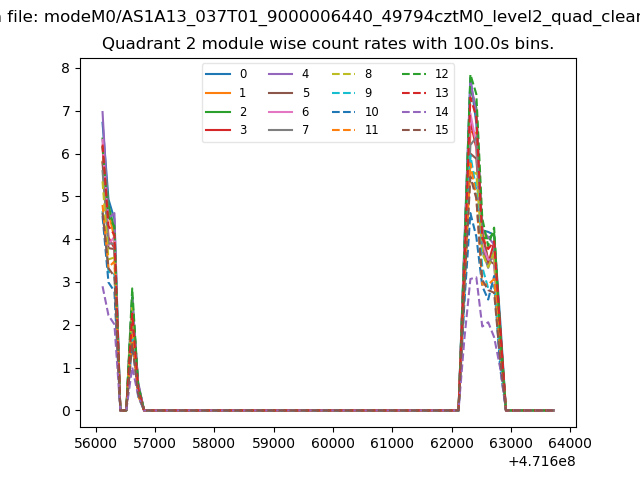
| Module-wise count rates for Quadrant B Data is divided into 100 sec bins |
 |
 |
| Module-wise count rates for Quadrant C Data is divided into 100 sec bins |
 |
 |
| Module-wise count rates for Quadrant D Data is divided into 100 sec bins |
 |
 |
| Parameter | Plot |
|---|---|
| CZT HV Monitor | 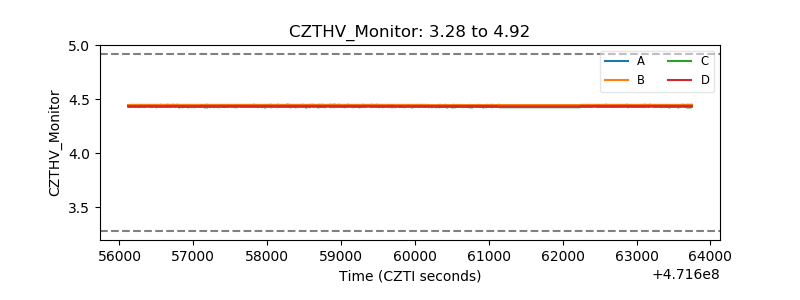 |
| D_VDD | 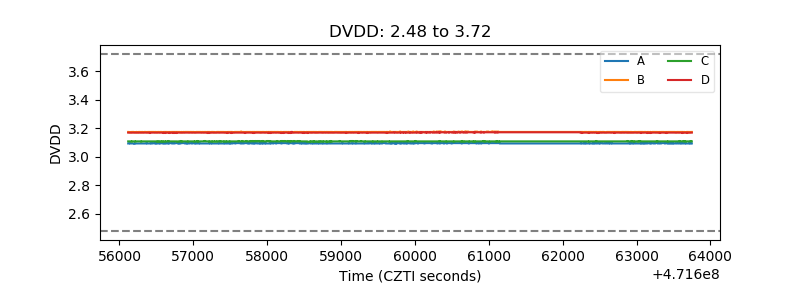 |
| Temperature 1 | 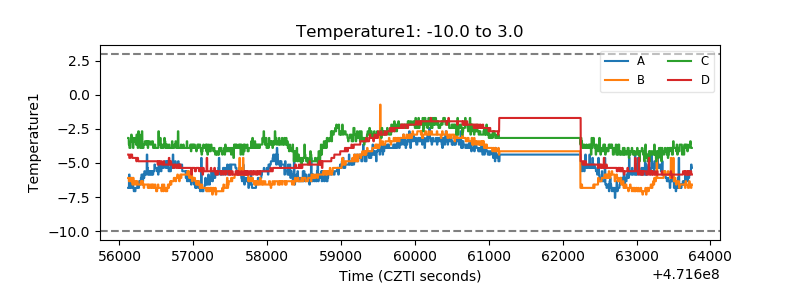 |
| Veto HV Monitor | 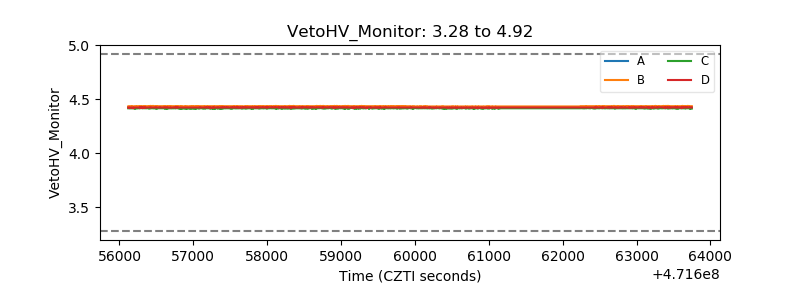 |
| Veto LLD | 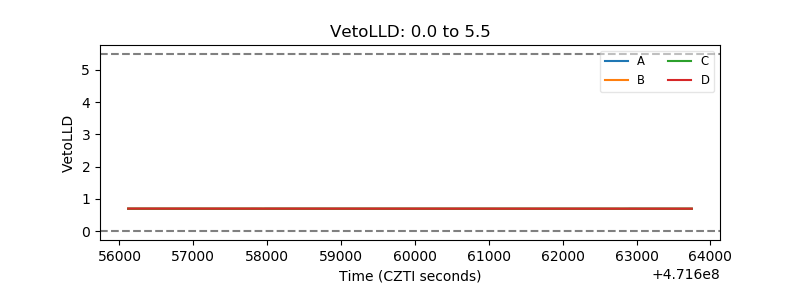 |
| Alpha Counter | 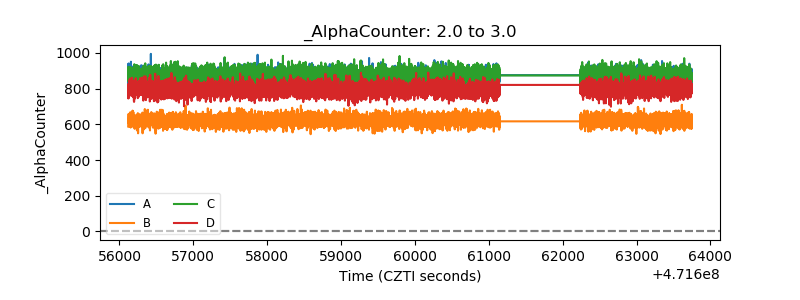 |
| _CPM_Rate | 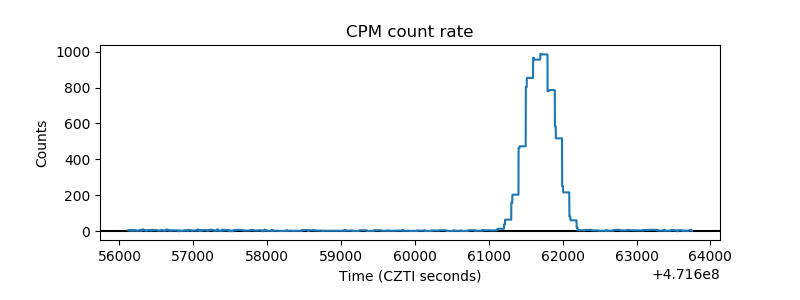 |
| CZT Counter | 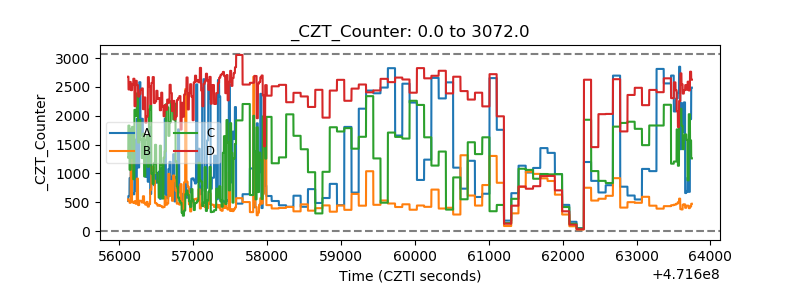 |
| +2.5 Volts monitor | 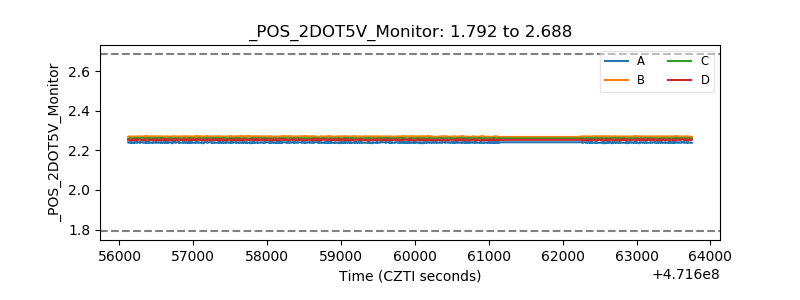 |
| +5 Volts monitor |  |
| _ROLL_ROT | 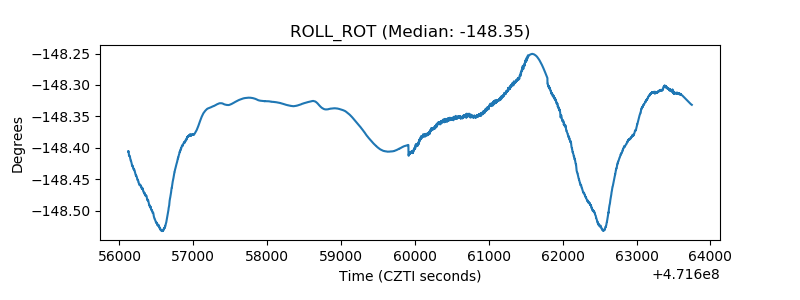 |
| _Roll_DEC | 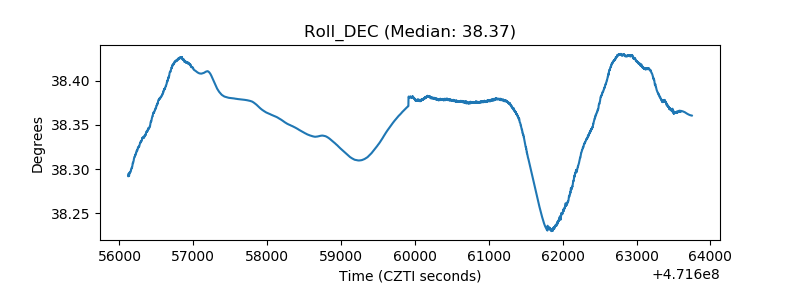 |
| _Roll_RA | 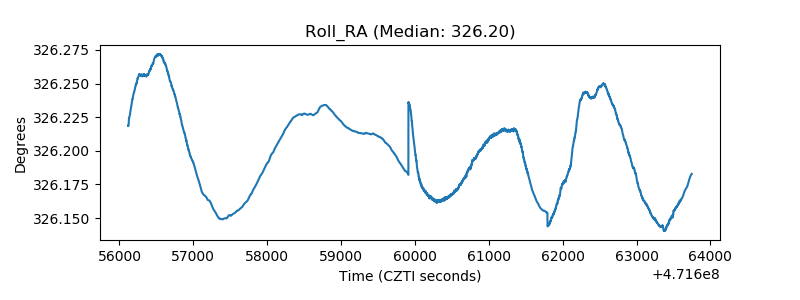 |
| Veto Counter | 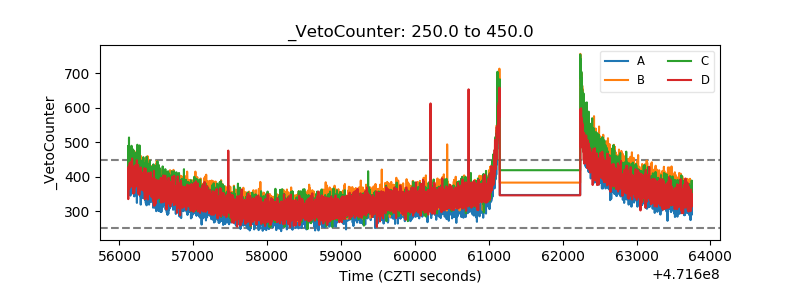 |