| Param | Original file | Final file |
|---|---|---|
| Filename | modeM0/AS1A13_037T01_9000006440_49795cztM0_level2.fits | modeM0/AS1A13_037T01_9000006440_49795cztM0_level2_quad_clean.evt |
| Size (bytes) | 1,013,880,960 | 53,478,720 |
| Size | 966.9 MB | 51.0 MB |
| Events in quadrant A | 9,473,561 | 444,106 |
| Events in quadrant B | 3,529,327 | 671,528 |
| Events in quadrant C | 9,184,673 | 20,385 |
| Events in quadrant D | 14,859,318 | 48,216 |
| Mode M9 | |||
|---|---|---|---|
| Quadrant | BADHDUFLAG | Total packets | Discarded packets |
| A | 0 | 11 | 0 |
| B | 0 | 11 | 0 |
| C | 0 | 11 | 0 |
| D | 0 | 11 | 0 |
| Mode SS | |||
|---|---|---|---|
| Quadrant | BADHDUFLAG | Total packets | Discarded packets |
| A | 0 | 126 | 0 |
| B | 0 | 126 | 0 |
| C | 0 | 126 | 0 |
| D | 0 | 126 | 0 |
| Mode M0 | |||
|---|---|---|---|
| Quadrant | BADHDUFLAG | Total packets | Discarded packets |
| A | 0 | 32505 | 1 |
| B | 0 | 14785 | 2 |
| C | 0 | 31683 | 1 |
| D | 0 | 48350 | 1 |
| Quadrant | Total seconds | Saturated seconds | Saturation percentage |
|---|---|---|---|
| A | 6231 | 2054 | 32.964211% |
| B | 6231 | 199 | 3.193709% |
| C | 6231 | 6080 | 97.576633% |
| D | 6231 | 5832 | 93.596533% |
Noise dominated data is calculated using 1-second bins in cleaned event files. If a bin has >2000 counts, and if more than 50% of those come from <1% of pixels, then it is considered to be noise-dominated and hence unusable.
| Quadrant | # 1 sec bins | Bins with >0 counts | Bins with >2000 counts | High rate bins dominated by noise | Noise dominated (total time) | Noise dominated (detector-on time) | Marked lightcurve |
|---|---|---|---|---|---|---|---|
| A | 7381 | 6231 | 1712 | 1712 | 23.19% | 27.48% | 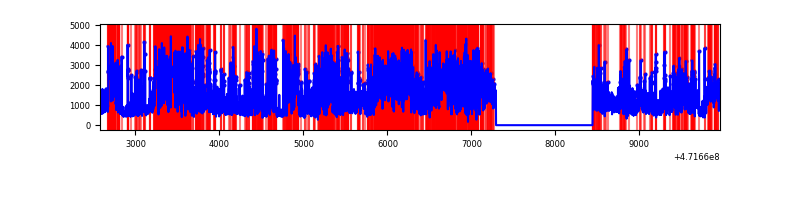 |
| B | 7381 | 6231 | 93 | 93 | 1.26% | 1.49% | 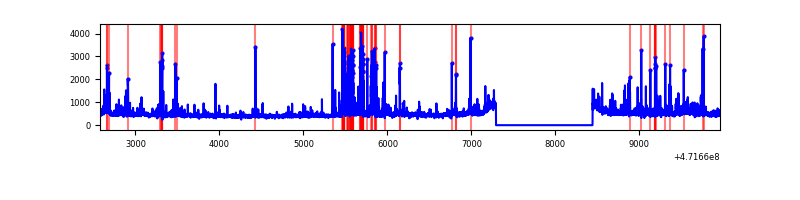 |
| C | 7380 | 6230 | 1293 | 1293 | 17.52% | 20.75% | 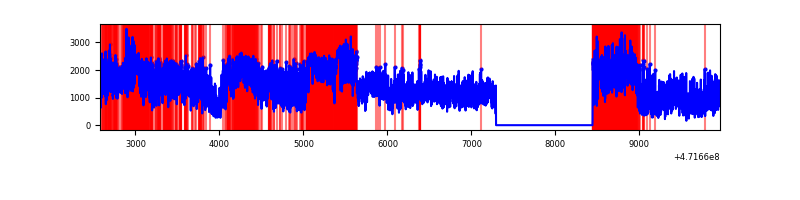 |
| D | 7380 | 6230 | 5250 | 5250 | 71.14% | 84.27% | 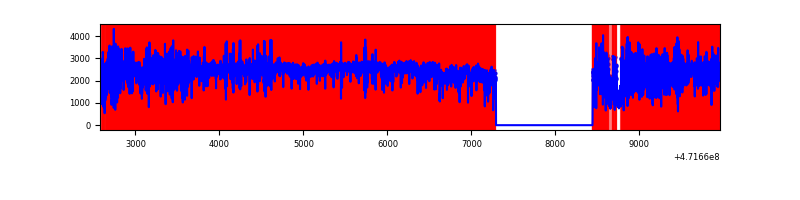 |
Top three noisy pixels from each quadrant. If the there are fewer than three noisy pixels in the level2.evt file, extra rows are filled as -1
| Pixel properties | Quadrant properties | ||||||
|---|---|---|---|---|---|---|---|
| Quadrant | DetID | PixID | Counts | Sigma | Mean | Median | Sigma |
| A | 5 | 16 | 1554003 | 10107.86 | 604 | 588 | 153.7 |
| A | 5 | 17 | 1299103 | 8449.26 | 604 | 588 | 153.7 |
| A | 4 | 249 | 745983 | 4850.18 | 604 | 588 | 153.7 |
| B | 1 | 255 | 182044 | 1242.83 | 692 | 671 | 145.9 |
| B | 10 | 28 | 164874 | 1125.18 | 692 | 671 | 145.9 |
| B | 4 | 206 | 144098 | 982.81 | 692 | 671 | 145.9 |
| C | 15 | 147 | 3569120 | 87672.4 | 117 | 115 | 40.7 |
| C | 15 | 148 | 1659151 | 40754.12 | 117 | 115 | 40.7 |
| C | 15 | 197 | 927447 | 22779.86 | 117 | 115 | 40.7 |
| D | 7 | 61 | 2824277 | 32654.82 | 265 | 254 | 86.5 |
| D | 15 | 168 | 2294504 | 26528.94 | 265 | 254 | 86.5 |
| D | 8 | 129 | 1401424 | 16202.05 | 265 | 254 | 86.5 |
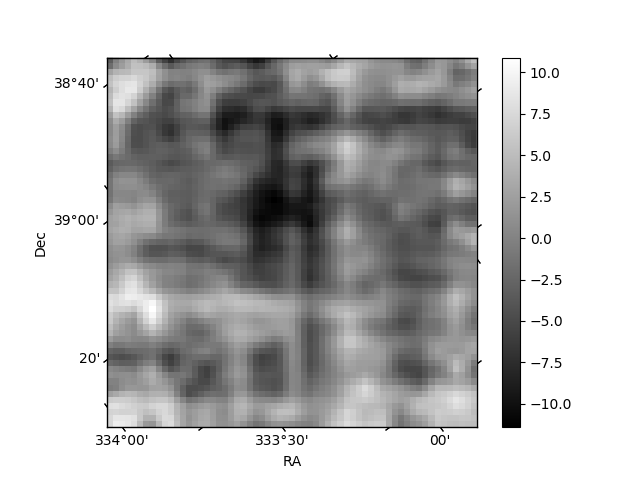
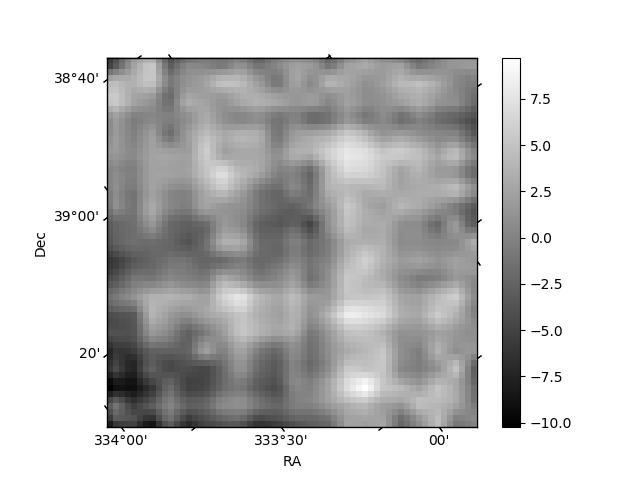
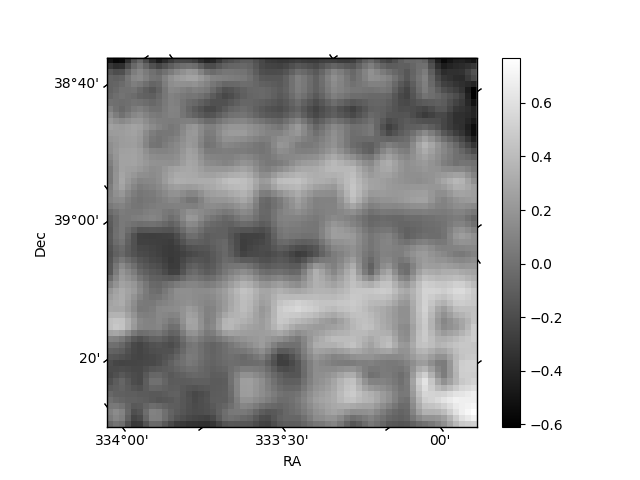
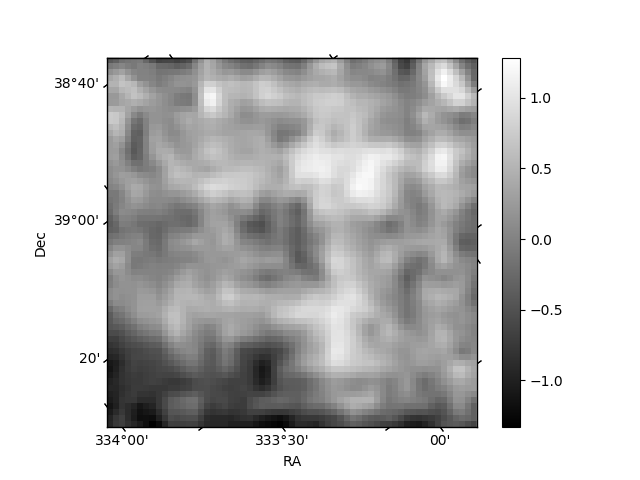
Histogram calculated using DETX and DETY for each event in the final _common_clean file
| Quadrant A | 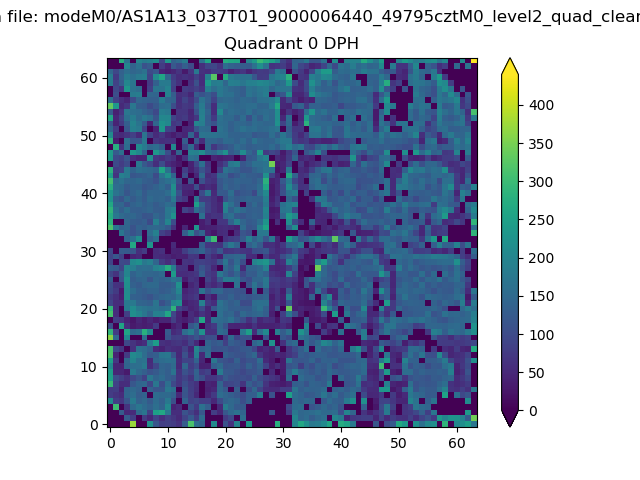 |
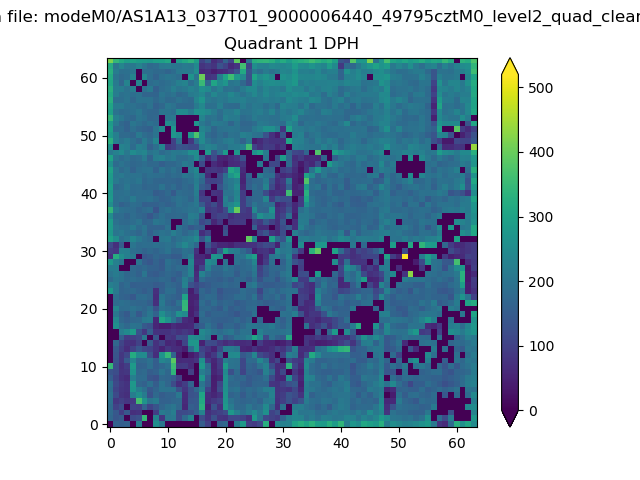 |
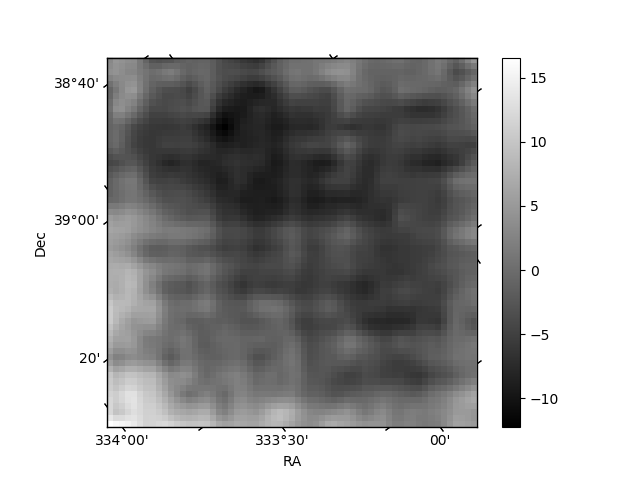
Quadrant B |
|---|---|---|---|
| Quadrant D | 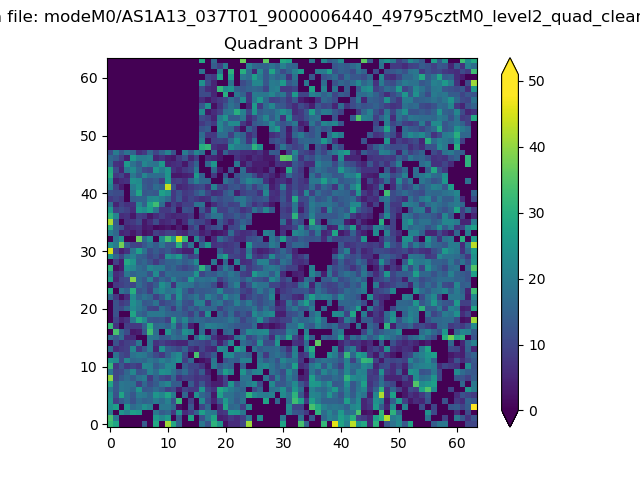 |
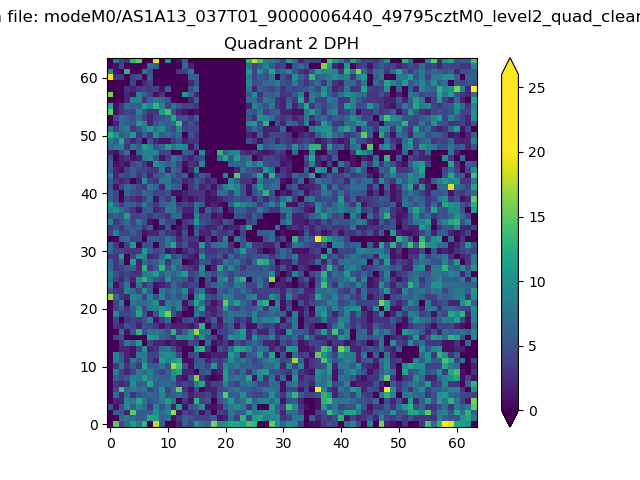 |
Quadrant C |
| Plot type | Count rate plots | Images |
|---|---|---|
| Comparison with Poisson distribution Blue bars denote a histogram of data divided into 1 sec bins. Red curve is a Poisson curve with rate = median count rate of data. |
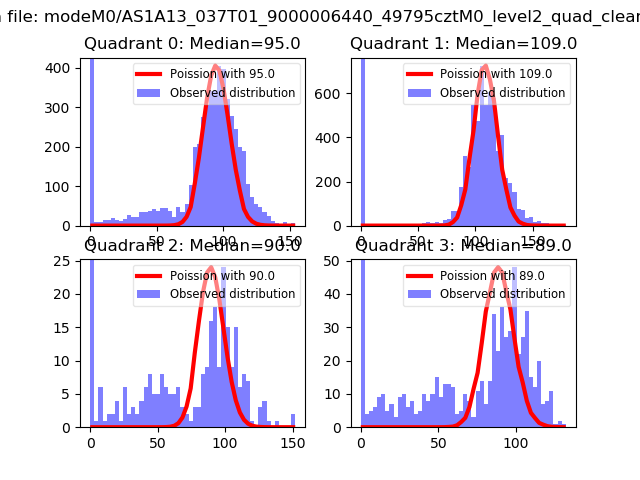 |
 |
| Quadrant-wise count rates Data is divided into 100 sec bins |
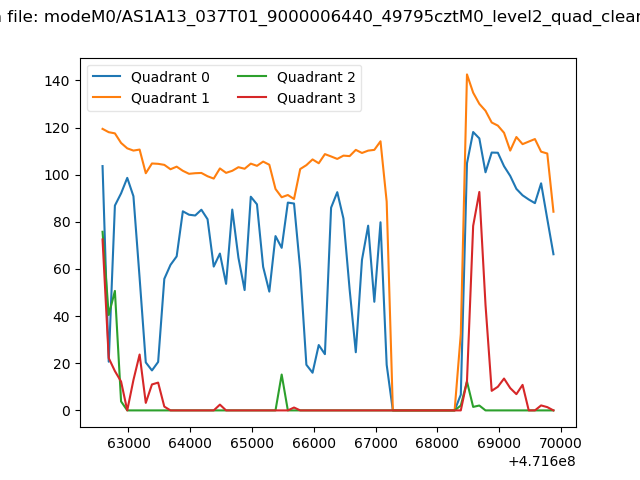 |
|
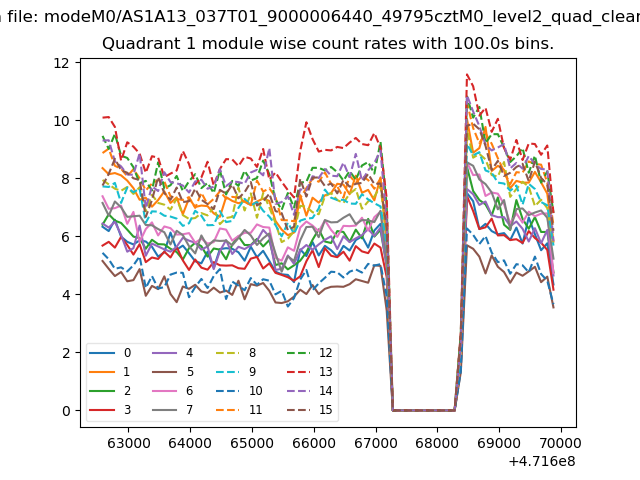
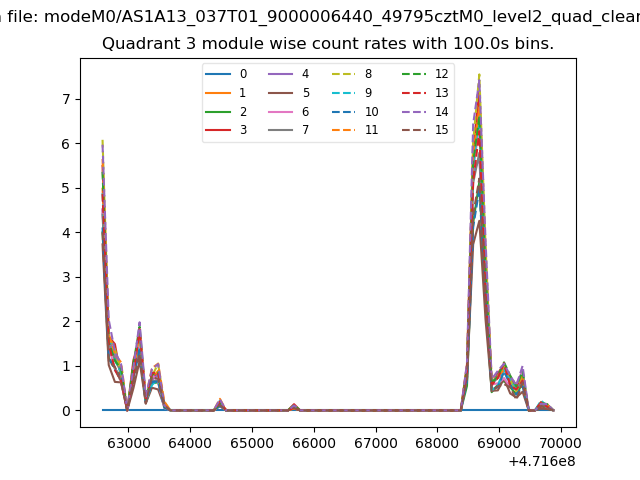
| Module-wise count rates for Quadrant A Data is divided into 100 sec bins |
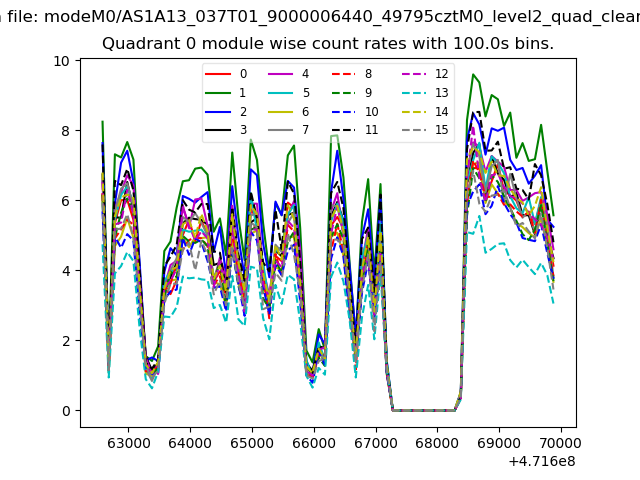 |
 |
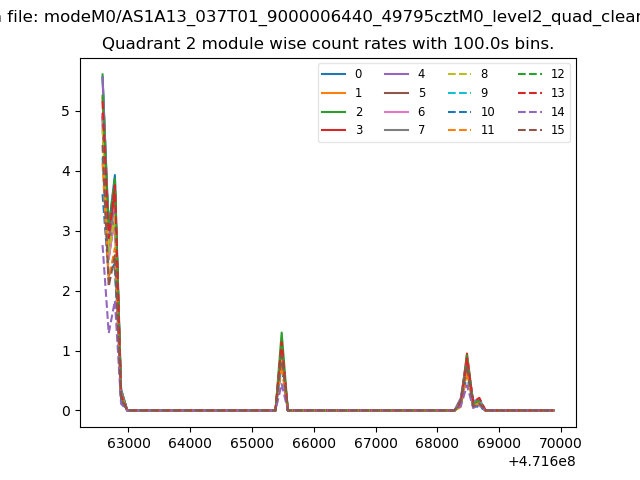
| Module-wise count rates for Quadrant B Data is divided into 100 sec bins |
 |
 |
| Module-wise count rates for Quadrant C Data is divided into 100 sec bins |
 |
 |
| Module-wise count rates for Quadrant D Data is divided into 100 sec bins |
 |
 |
| Parameter | Plot |
|---|---|
| CZT HV Monitor | 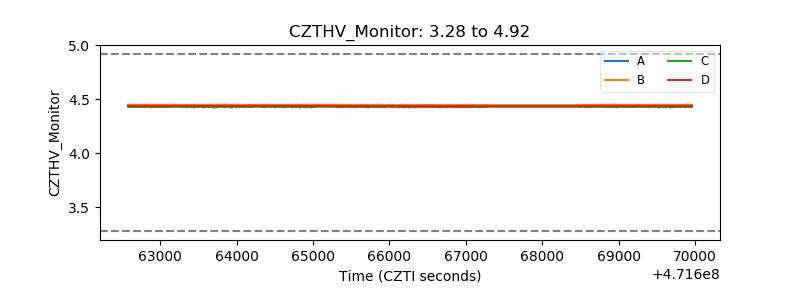 |
| D_VDD | 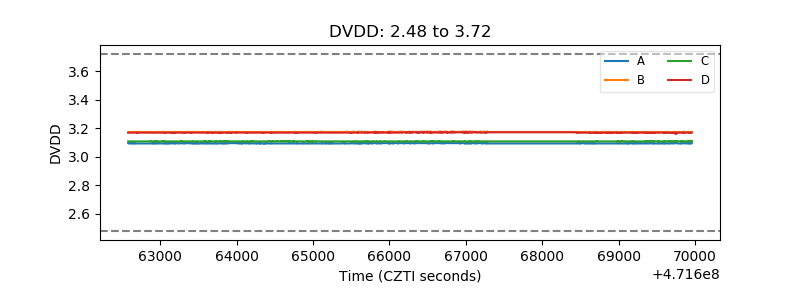 |
| Temperature 1 | 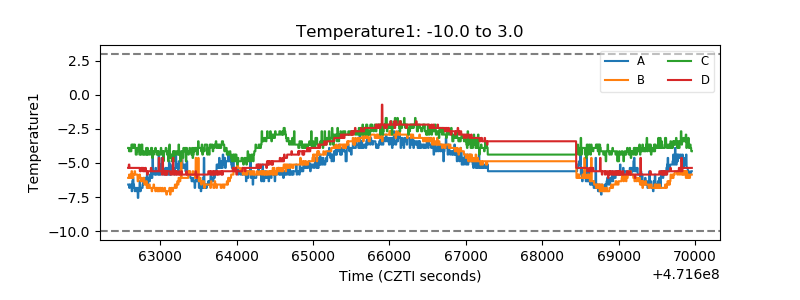 |
| Veto HV Monitor | 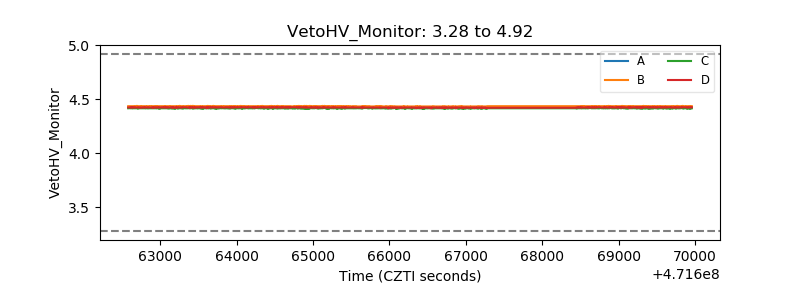 |
| Veto LLD | 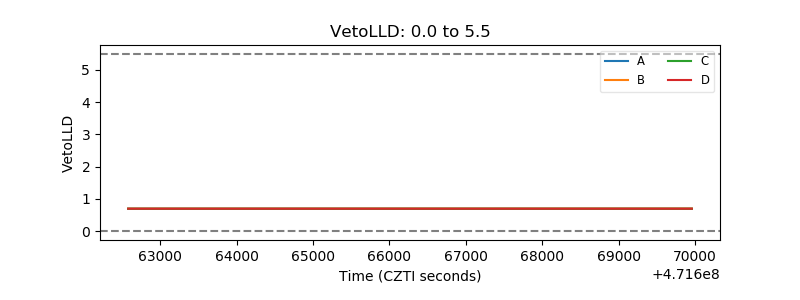 |
| Alpha Counter | 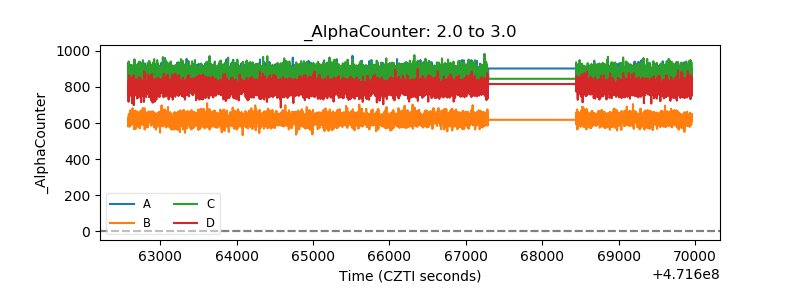 |
| _CPM_Rate | 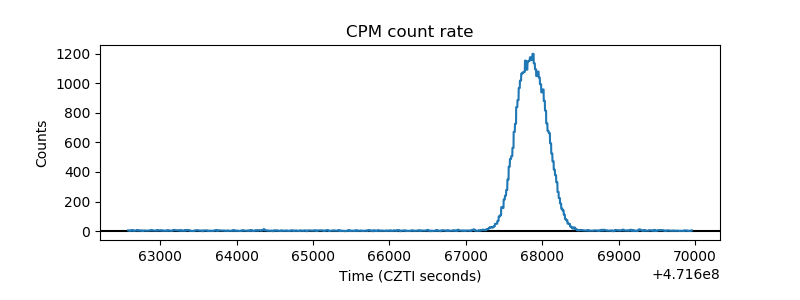 |
| CZT Counter | 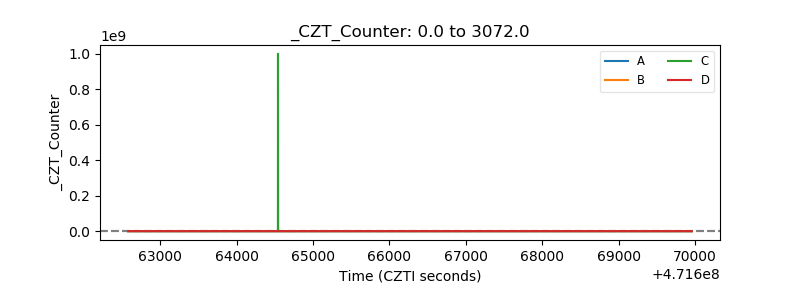 |
| +2.5 Volts monitor | 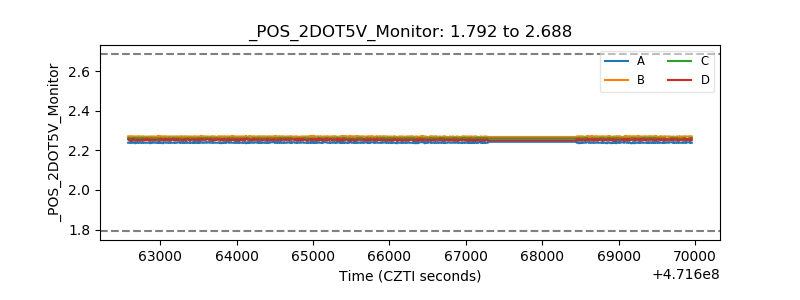 |
| +5 Volts monitor | 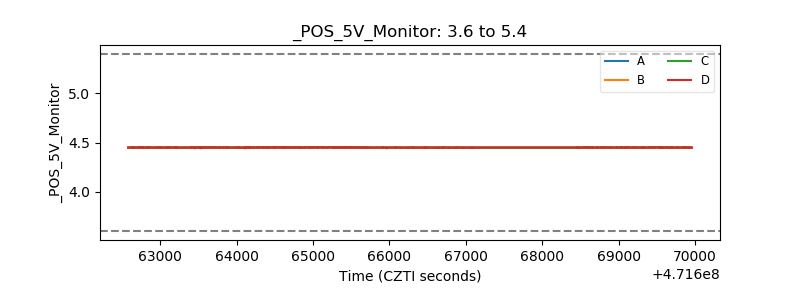 |
| _ROLL_ROT | 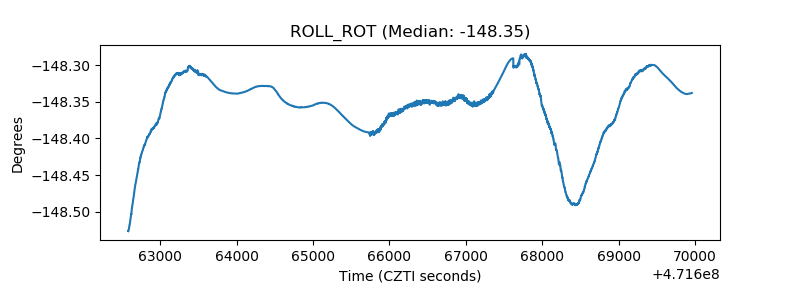 |
| _Roll_DEC | 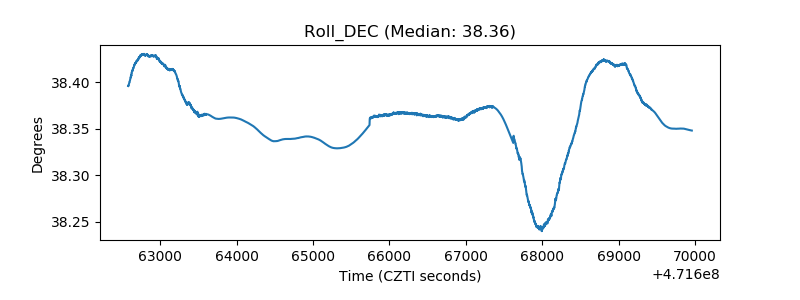 |
| _Roll_RA | 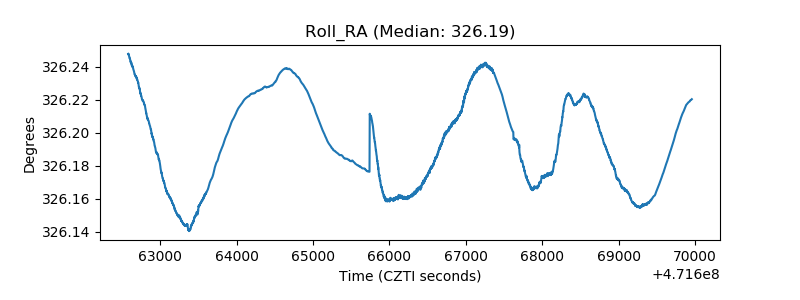 |
| Veto Counter | 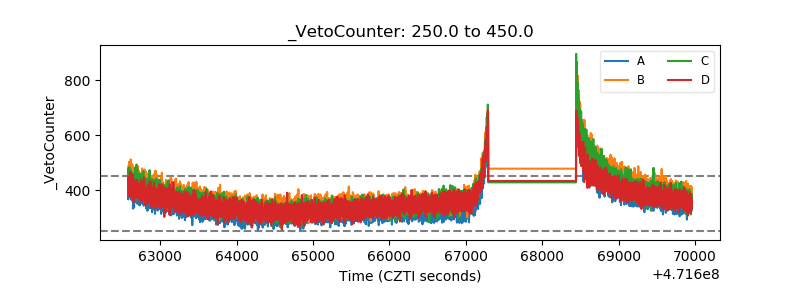 |