| Param | Original file | Final file |
|---|---|---|
| Filename | modeM0/AS1A13_037T01_9000006440_49796cztM0_level2.fits | modeM0/AS1A13_037T01_9000006440_49796cztM0_level2_quad_clean.evt |
| Size (bytes) | 911,090,880 | 56,738,880 |
| Size | 868.9 MB | 54.1 MB |
| Events in quadrant A | 6,189,168 | 570,840 |
| Events in quadrant B | 3,604,815 | 668,440 |
| Events in quadrant C | 8,748,262 | 24,513 |
| Events in quadrant D | 14,706,998 | 26,133 |
| Mode M9 | |||
|---|---|---|---|
| Quadrant | BADHDUFLAG | Total packets | Discarded packets |
| A | 0 | 11 | 0 |
| B | 0 | 11 | 0 |
| C | 0 | 11 | 0 |
| D | 0 | 11 | 0 |
| Mode SS | |||
|---|---|---|---|
| Quadrant | BADHDUFLAG | Total packets | Discarded packets |
| A | 0 | 126 | 0 |
| B | 0 | 126 | 0 |
| C | 0 | 126 | 0 |
| D | 0 | 126 | 0 |
| Mode M0 | |||
|---|---|---|---|
| Quadrant | BADHDUFLAG | Total packets | Discarded packets |
| A | 0 | 22668 | 1 |
| B | 0 | 14746 | 1 |
| C | 0 | 30337 | 3 |
| D | 0 | 47909 | 1 |
| Quadrant | Total seconds | Saturated seconds | Saturation percentage |
|---|---|---|---|
| A | 6124 | 684 | 11.169170% |
| B | 6125 | 240 | 3.918367% |
| C | 6124 | 5940 | 96.995428% |
| D | 6124 | 5933 | 96.881123% |
Noise dominated data is calculated using 1-second bins in cleaned event files. If a bin has >2000 counts, and if more than 50% of those come from <1% of pixels, then it is considered to be noise-dominated and hence unusable.
| Quadrant | # 1 sec bins | Bins with >0 counts | Bins with >2000 counts | High rate bins dominated by noise | Noise dominated (total time) | Noise dominated (detector-on time) | Marked lightcurve |
|---|---|---|---|---|---|---|---|
| A | 7279 | 6125 | 470 | 470 | 6.46% | 7.67% | 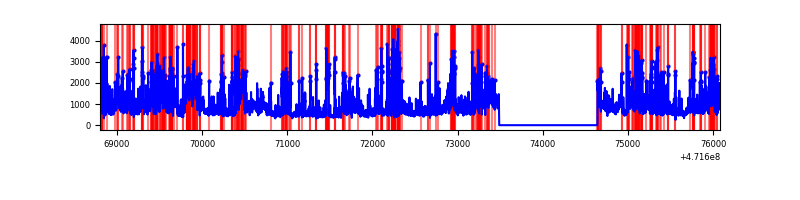 |
| B | 7280 | 6125 | 84 | 84 | 1.15% | 1.37% |  |
| C | 7278 | 6123 | 1590 | 1590 | 21.85% | 25.97% | 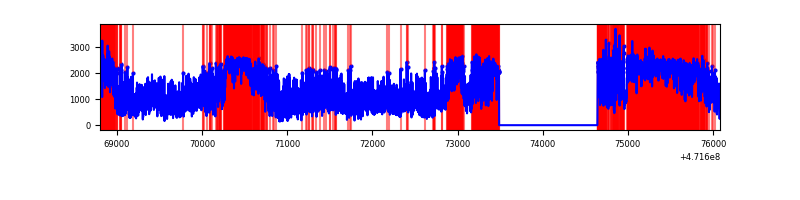 |
| D | 7278 | 6123 | 5165 | 5165 | 70.97% | 84.35% | 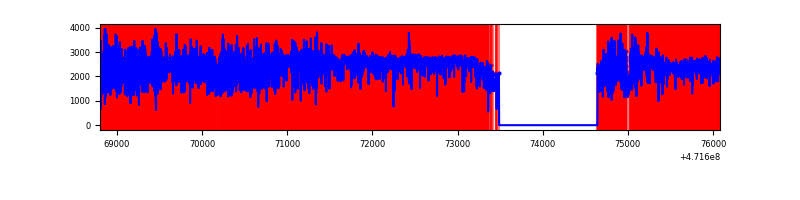 |
Top three noisy pixels from each quadrant. If the there are fewer than three noisy pixels in the level2.evt file, extra rows are filled as -1
| Pixel properties | Quadrant properties | ||||||
|---|---|---|---|---|---|---|---|
| Quadrant | DetID | PixID | Counts | Sigma | Mean | Median | Sigma |
| A | 15 | 63 | 691021 | 4086.52 | 676 | 661 | 168.9 |
| A | 4 | 249 | 294383 | 1738.66 | 676 | 661 | 168.9 |
| A | 5 | 16 | 260080 | 1535.61 | 676 | 661 | 168.9 |
| B | 10 | 28 | 248693 | 1689.27 | 692 | 669 | 146.8 |
| B | 1 | 255 | 166274 | 1127.92 | 692 | 669 | 146.8 |
| B | 4 | 206 | 136623 | 925.97 | 692 | 669 | 146.8 |
| C | 15 | 147 | 2808204 | 82332.89 | 99 | 97 | 34.1 |
| C | 15 | 148 | 1795032 | 52626.98 | 99 | 97 | 34.1 |
| C | 15 | 213 | 875564 | 25668.44 | 99 | 97 | 34.1 |
| D | 15 | 168 | 3212113 | 38229.74 | 260 | 249 | 84.0 |
| D | 7 | 61 | 1683129 | 20030.76 | 260 | 249 | 84.0 |
| D | 8 | 129 | 1473395 | 17534.36 | 260 | 249 | 84.0 |
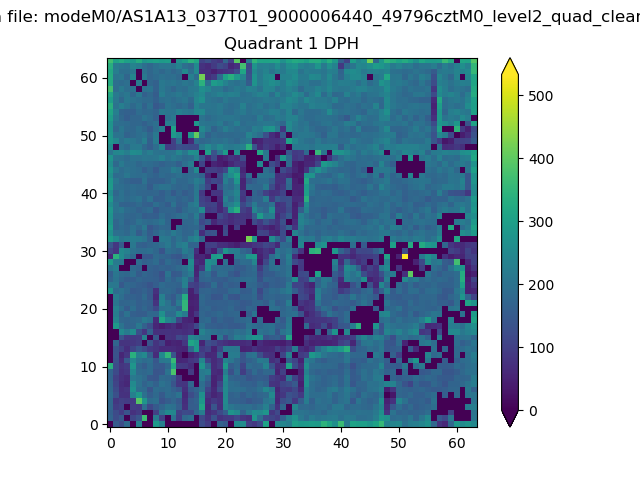
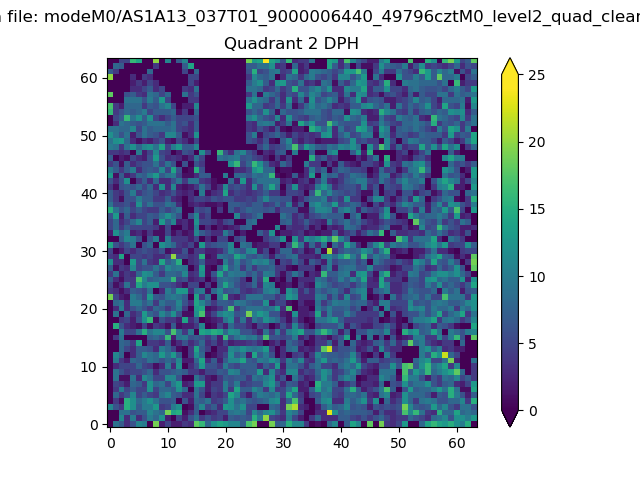
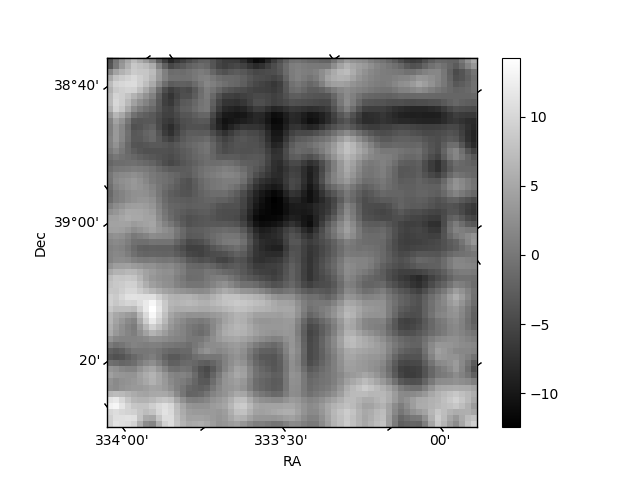
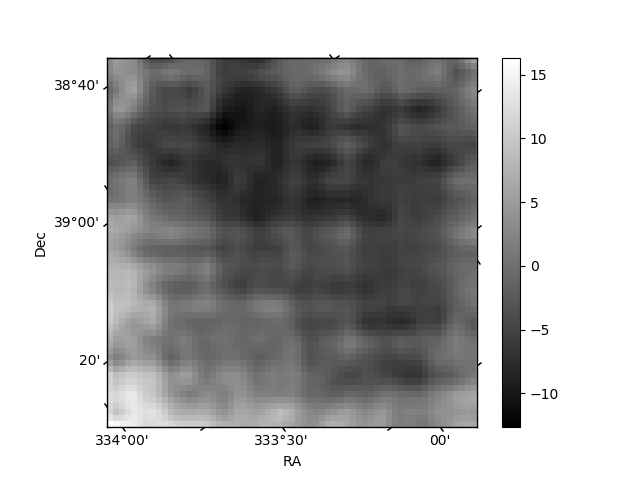
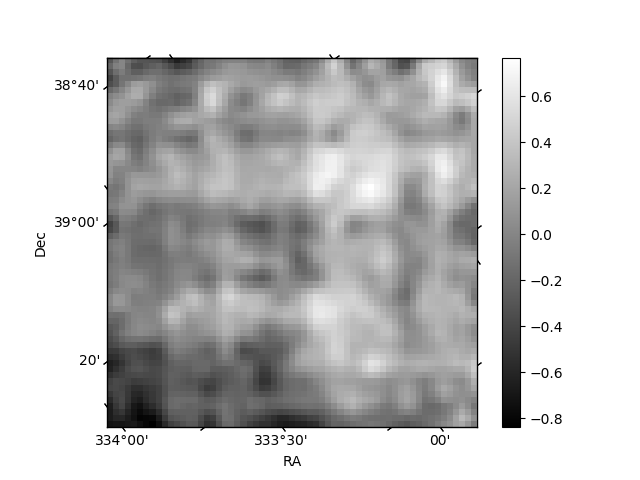
Histogram calculated using DETX and DETY for each event in the final _common_clean file
| Quadrant A | 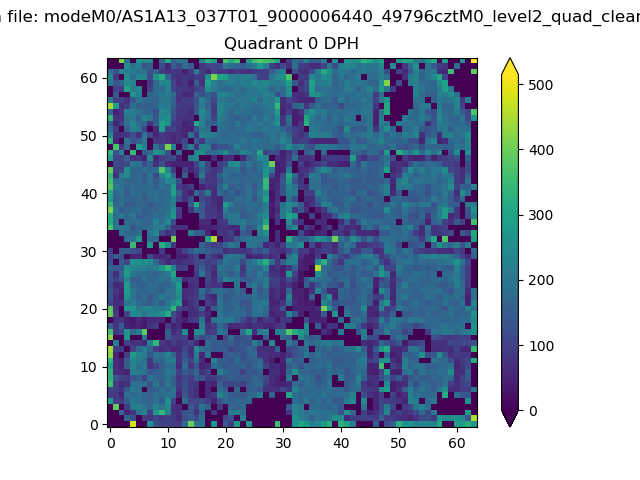 |
 |
Quadrant B |
|---|---|---|---|
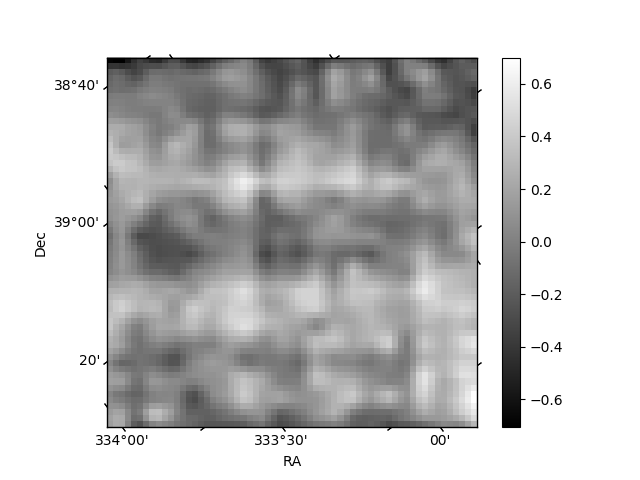
| Quadrant D | 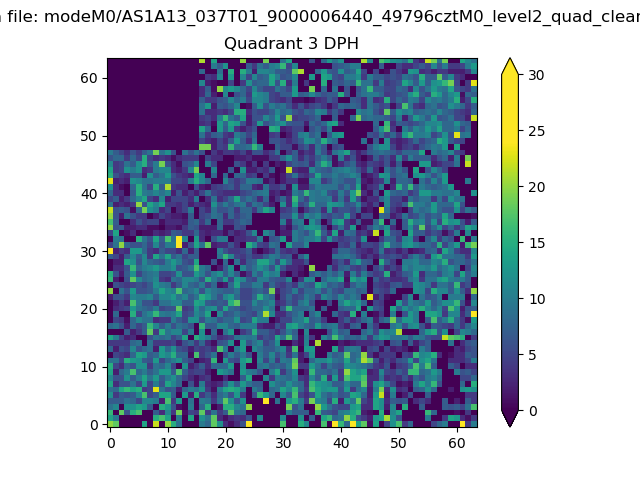 |
 |
Quadrant C |
| Plot type | Count rate plots | Images |
|---|---|---|
| Comparison with Poisson distribution Blue bars denote a histogram of data divided into 1 sec bins. Red curve is a Poisson curve with rate = median count rate of data. |
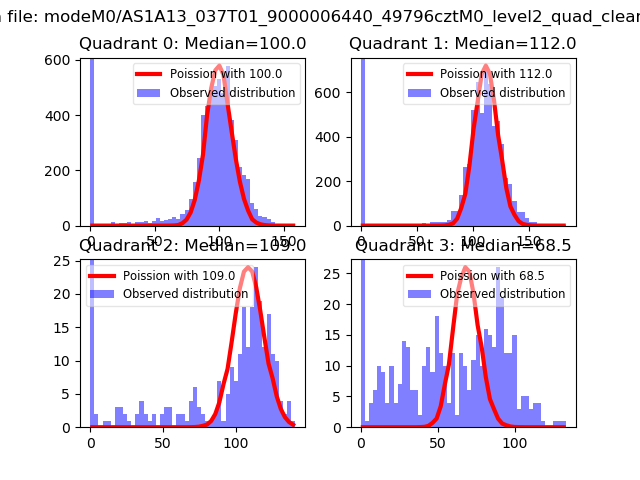 |
 |
| Quadrant-wise count rates Data is divided into 100 sec bins |
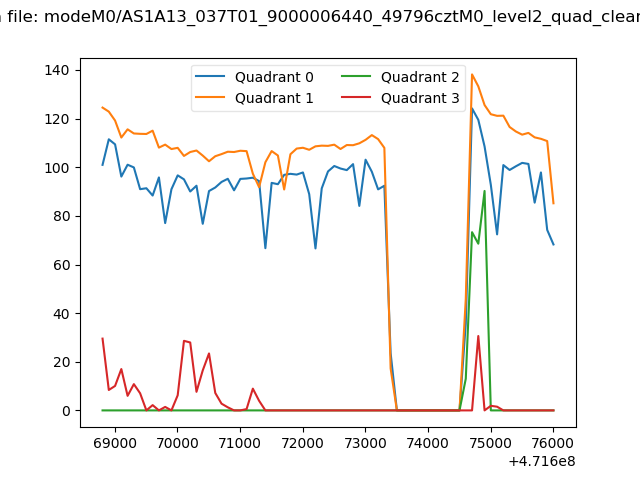 |
|
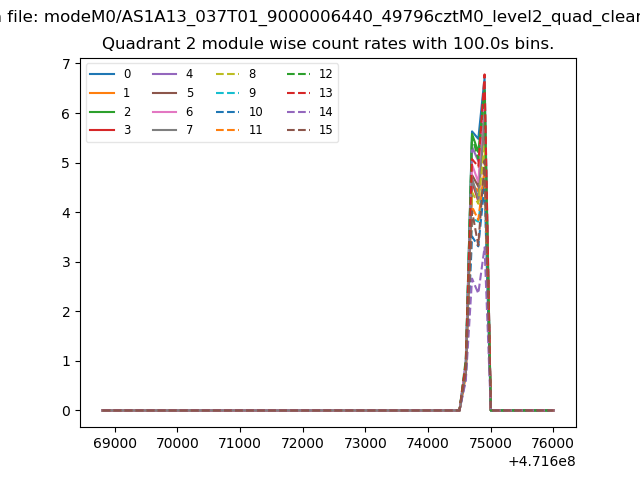
| Module-wise count rates for Quadrant A Data is divided into 100 sec bins |
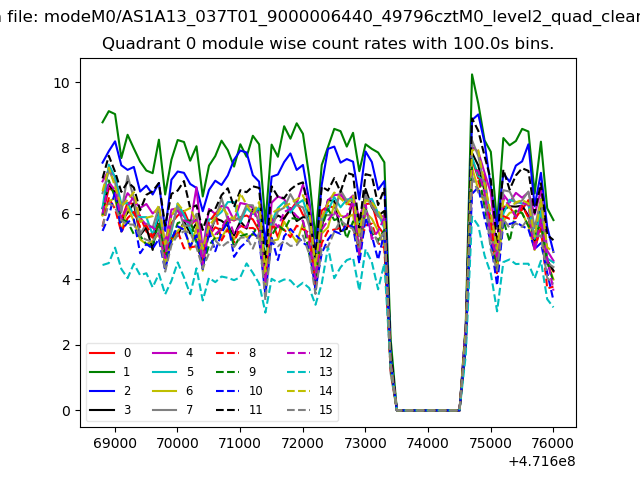 |
 |
| Module-wise count rates for Quadrant B Data is divided into 100 sec bins |
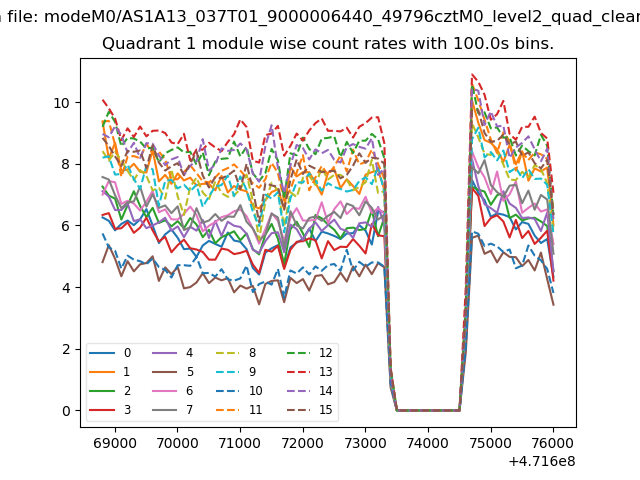 |
 |
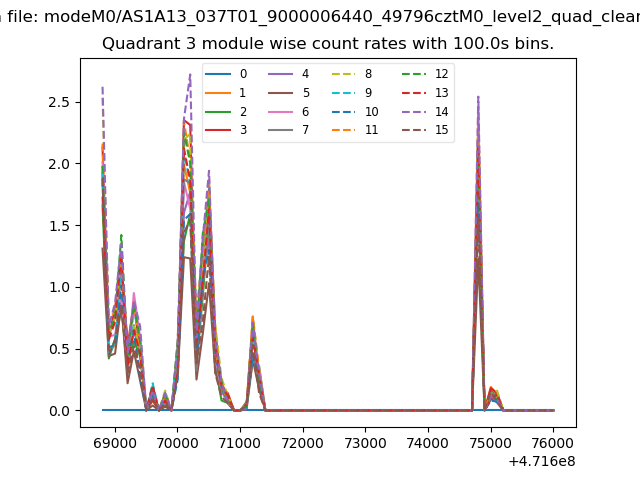
| Module-wise count rates for Quadrant C Data is divided into 100 sec bins |
 |
 |
| Module-wise count rates for Quadrant D Data is divided into 100 sec bins |
 |
 |
| Parameter | Plot |
|---|---|
| CZT HV Monitor | 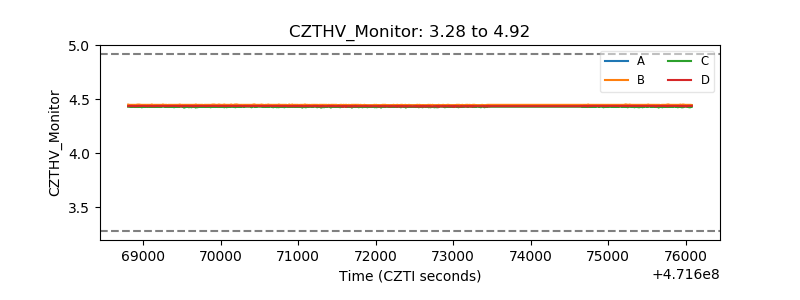 |
| D_VDD | 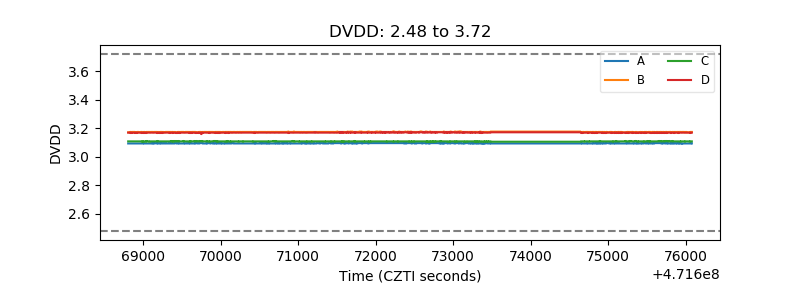 |
| Temperature 1 | 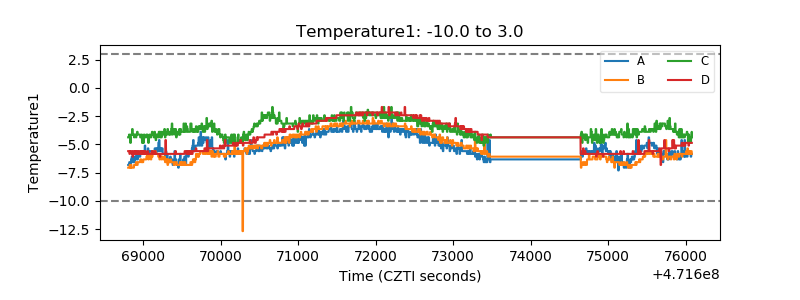 |
| Veto HV Monitor | 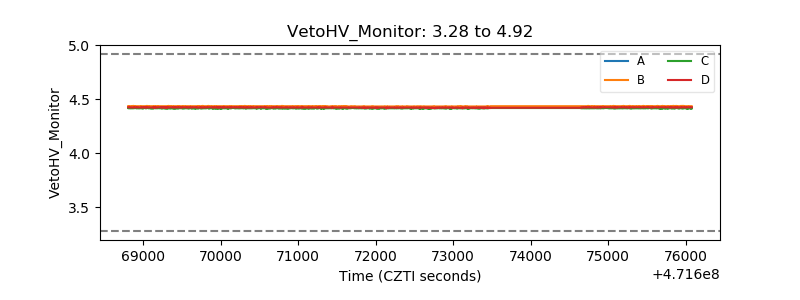 |
| Veto LLD | 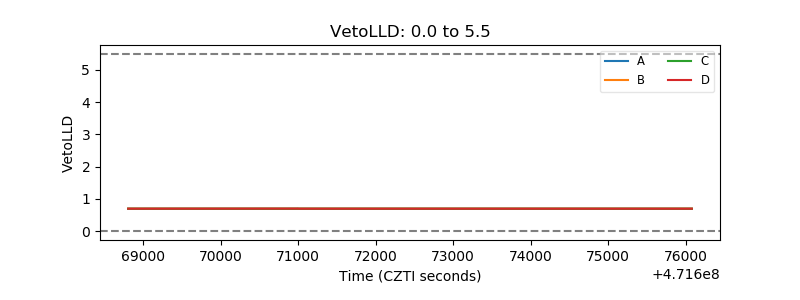 |
| Alpha Counter | 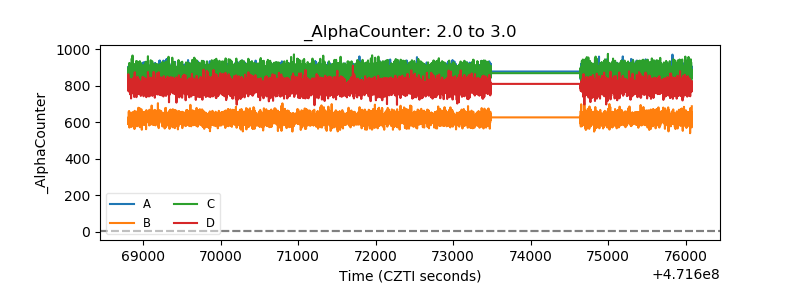 |
| _CPM_Rate | 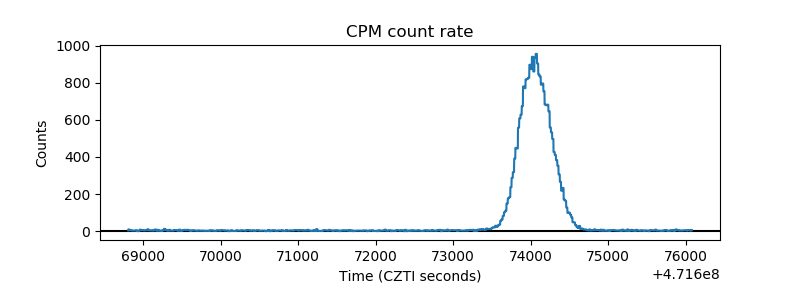 |
| CZT Counter | 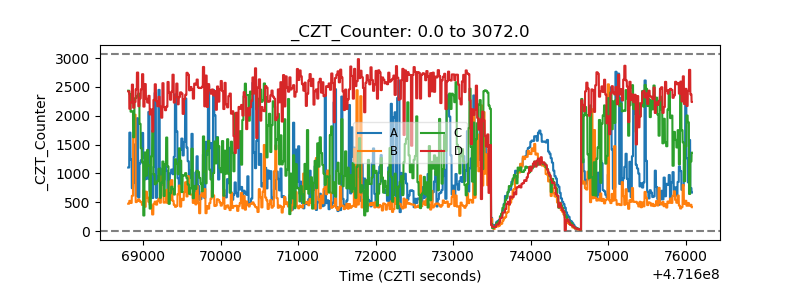 |
| +2.5 Volts monitor | 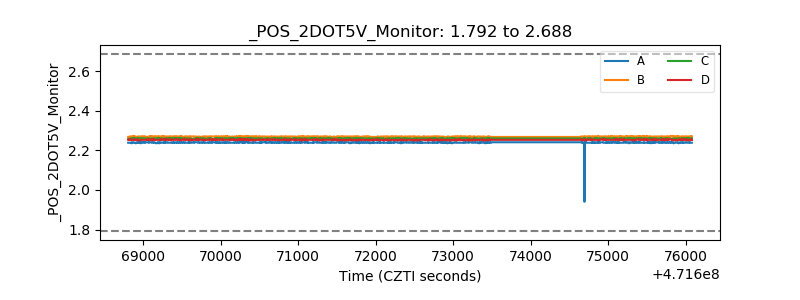 |
| +5 Volts monitor | 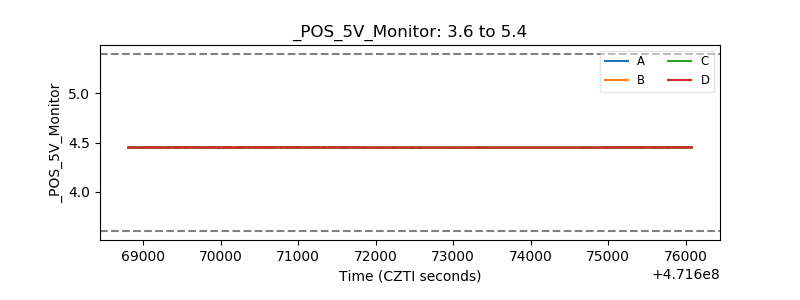 |
| _ROLL_ROT | 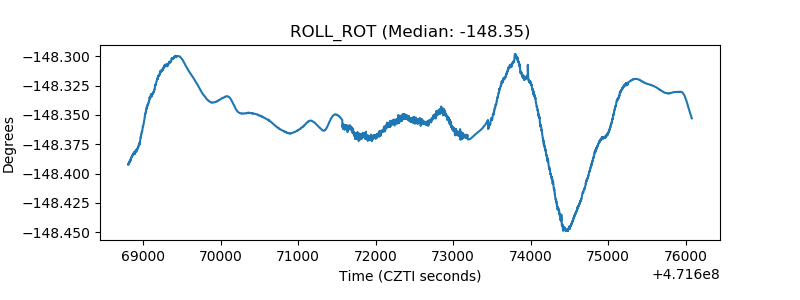 |
| _Roll_DEC | 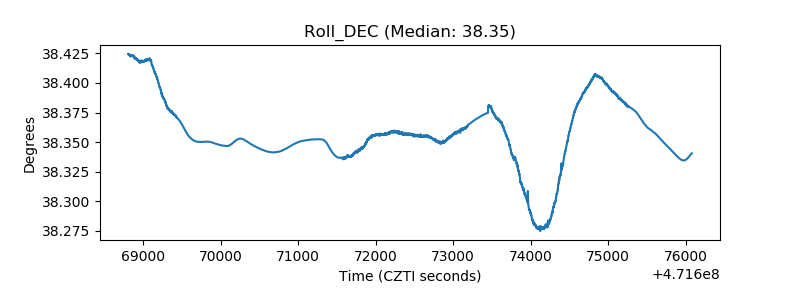 |
| _Roll_RA | 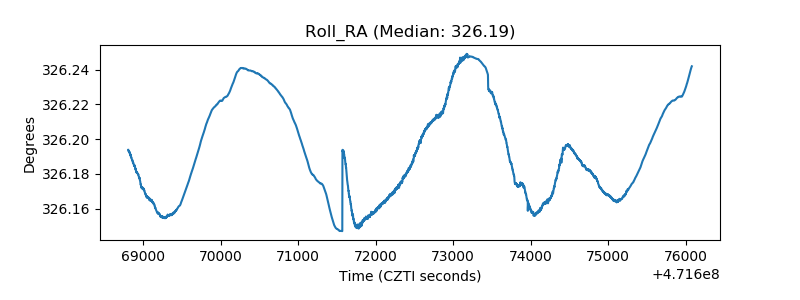 |
| Veto Counter | 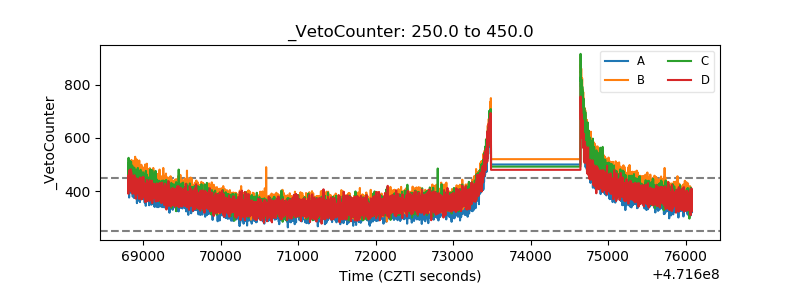 |