| Param | Original file | Final file |
|---|---|---|
| Filename | modeM0/AS1A13_037T01_9000006440_49797cztM0_level2.fits | modeM0/AS1A13_037T01_9000006440_49797cztM0_level2_quad_clean.evt |
| Size (bytes) | 871,220,160 | 51,802,560 |
| Size | 830.9 MB | 49.4 MB |
| Events in quadrant A | 6,550,231 | 507,876 |
| Events in quadrant B | 3,680,865 | 630,846 |
| Events in quadrant C | 8,247,731 | 16,380 |
| Events in quadrant D | 13,311,533 | 1,520 |
| Mode M9 | |||
|---|---|---|---|
| Quadrant | BADHDUFLAG | Total packets | Discarded packets |
| A | 0 | 12 | 0 |
| B | 0 | 12 | 0 |
| C | 0 | 12 | 0 |
| D | 0 | 12 | 0 |
| Mode SS | |||
|---|---|---|---|
| Quadrant | BADHDUFLAG | Total packets | Discarded packets |
| A | 0 | 118 | 0 |
| B | 0 | 118 | 0 |
| C | 0 | 118 | 0 |
| D | 0 | 118 | 0 |
| Mode M0 | |||
|---|---|---|---|
| Quadrant | BADHDUFLAG | Total packets | Discarded packets |
| A | 0 | 23525 | 1 |
| B | 0 | 14869 | 1 |
| C | 0 | 28657 | 1 |
| D | 0 | 43543 | 1 |
| Quadrant | Total seconds | Saturated seconds | Saturation percentage |
|---|---|---|---|
| A | 5898 | 986 | 16.717531% |
| B | 5898 | 249 | 4.221770% |
| C | 5898 | 5766 | 97.761953% |
| D | 5898 | 5888 | 99.830451% |
Noise dominated data is calculated using 1-second bins in cleaned event files. If a bin has >2000 counts, and if more than 50% of those come from <1% of pixels, then it is considered to be noise-dominated and hence unusable.
| Quadrant | # 1 sec bins | Bins with >0 counts | Bins with >2000 counts | High rate bins dominated by noise | Noise dominated (total time) | Noise dominated (detector-on time) | Marked lightcurve |
|---|---|---|---|---|---|---|---|
| A | 7048 | 5899 | 781 | 781 | 11.08% | 13.24% | 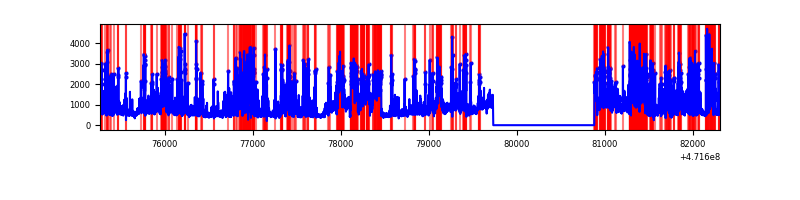 |
| B | 7048 | 5899 | 143 | 143 | 2.03% | 2.42% | 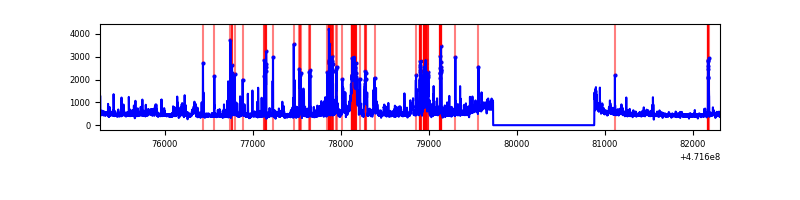 |
| C | 7047 | 5897 | 1483 | 1483 | 21.04% | 25.15% | 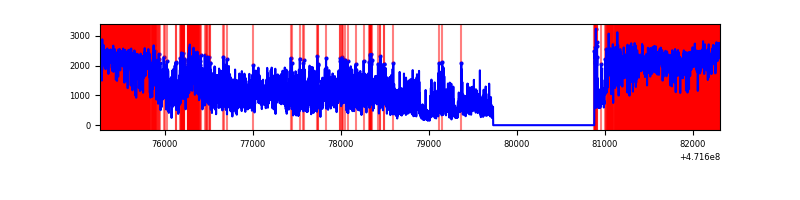 |
| D | 7047 | 5897 | 4715 | 4715 | 66.91% | 79.96% | 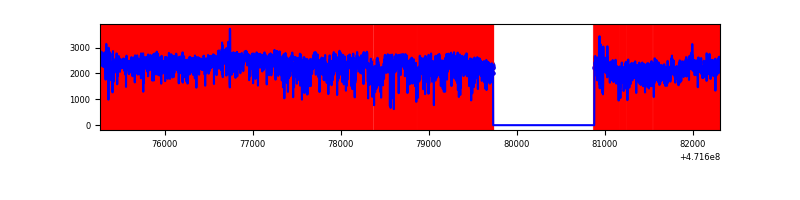 |
Top three noisy pixels from each quadrant. If the there are fewer than three noisy pixels in the level2.evt file, extra rows are filled as -1
| Pixel properties | Quadrant properties | ||||||
|---|---|---|---|---|---|---|---|
| Quadrant | DetID | PixID | Counts | Sigma | Mean | Median | Sigma |
| A | 15 | 63 | 1182909 | 7739.75 | 622 | 610 | 152.8 |
| A | 4 | 249 | 820297 | 5365.97 | 622 | 610 | 152.8 |
| A | 15 | 191 | 385600 | 2520.28 | 622 | 610 | 152.8 |
| B | 5 | 185 | 591829 | 4158.02 | 658 | 635 | 142.2 |
| B | 10 | 28 | 118695 | 830.35 | 658 | 635 | 142.2 |
| B | 4 | 206 | 117216 | 819.94 | 658 | 635 | 142.2 |
| C | 15 | 147 | 3530689 | 117833.02 | 89 | 87 | 30.0 |
| C | 15 | 230 | 1058329 | 35318.58 | 89 | 87 | 30.0 |
| C | 15 | 148 | 787751 | 26288.1 | 89 | 87 | 30.0 |
| D | 8 | 129 | 3628241 | 83523.92 | 115 | 109 | 43.4 |
| D | 7 | 61 | 2448232 | 56358.7 | 115 | 109 | 43.4 |
| D | 15 | 184 | 1430447 | 32928.08 | 115 | 109 | 43.4 |
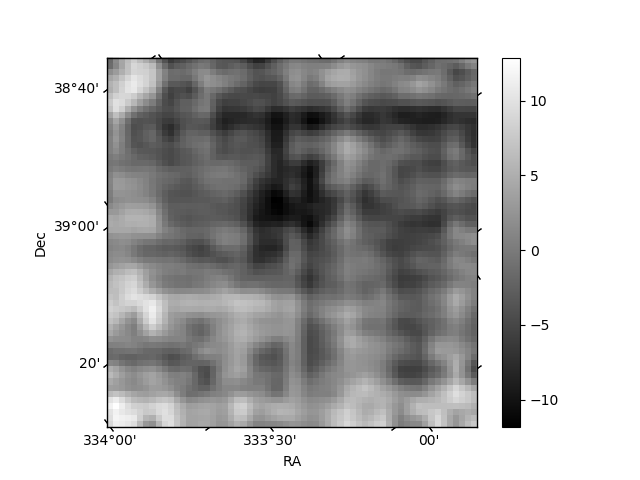
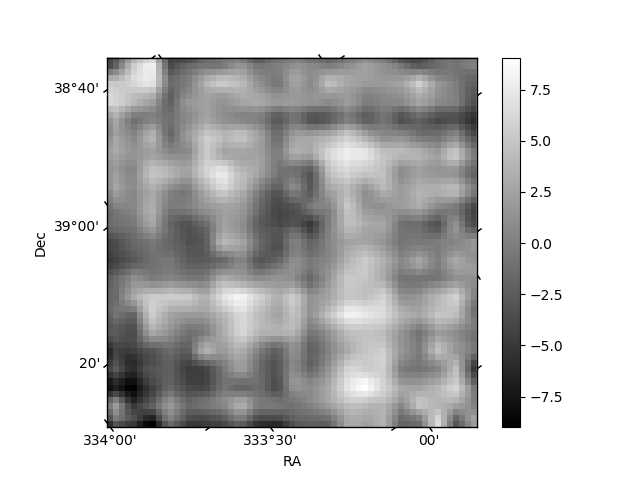
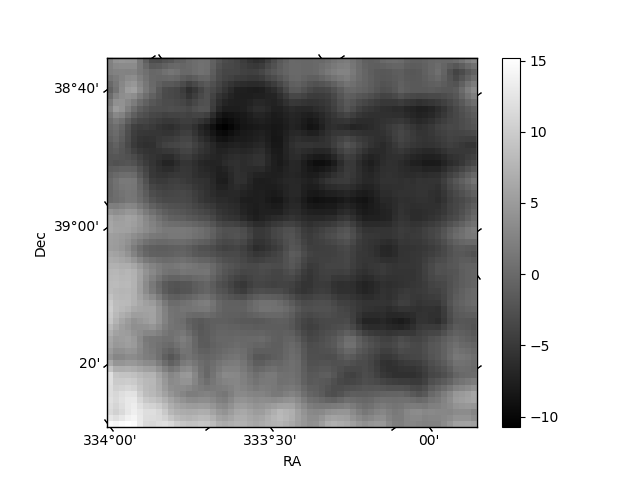
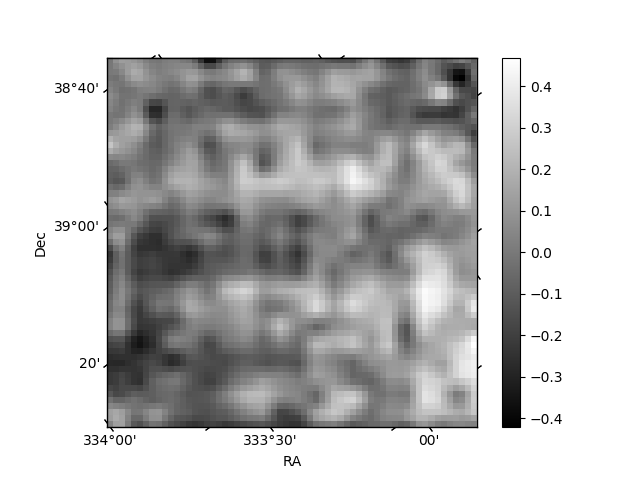
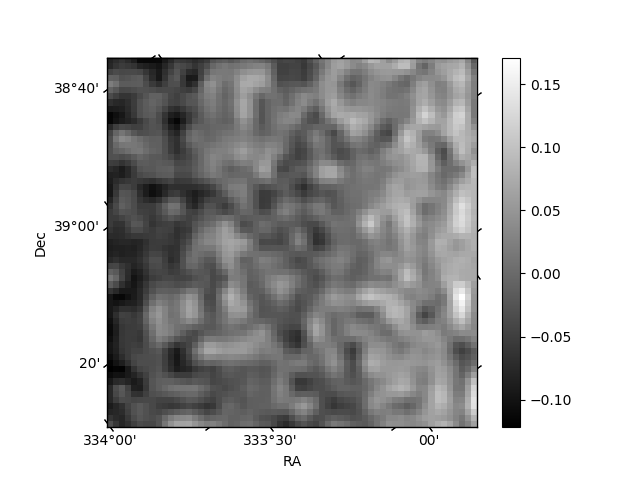
Histogram calculated using DETX and DETY for each event in the final _common_clean file
| Quadrant A | 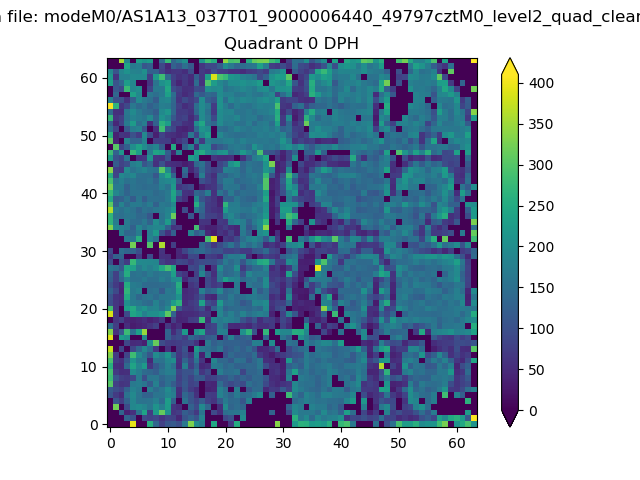 |
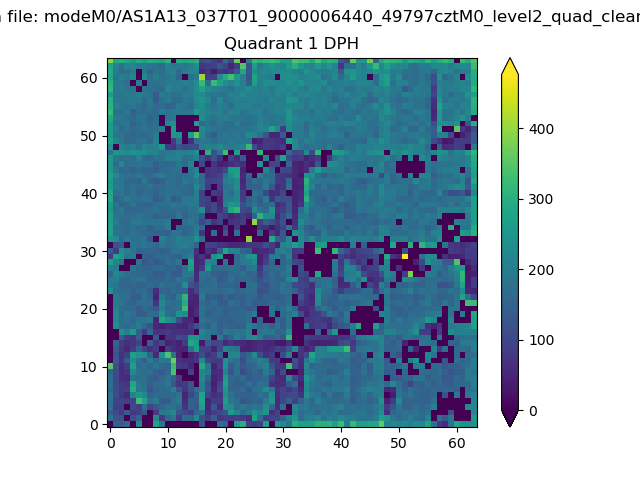 |
Quadrant B |
|---|---|---|---|
| Quadrant D | 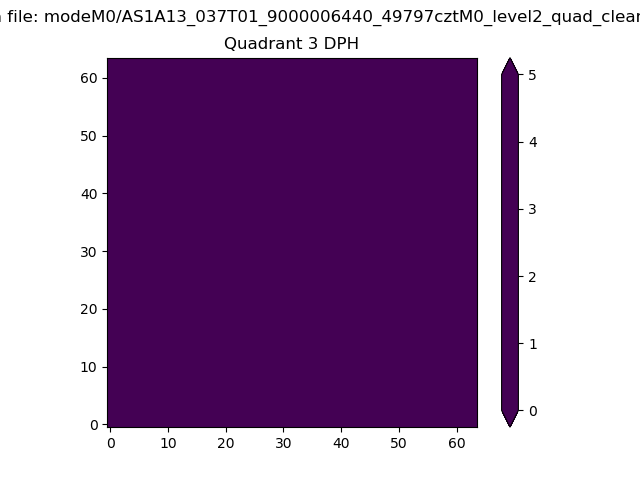 |
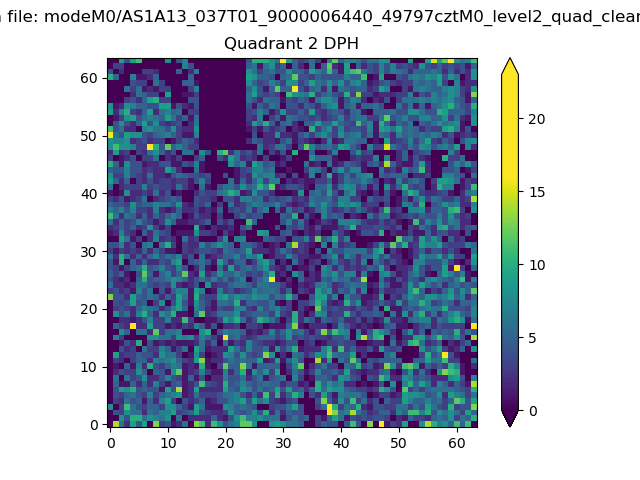 |
Quadrant C |
| Plot type | Count rate plots | Images |
|---|---|---|
| Comparison with Poisson distribution Blue bars denote a histogram of data divided into 1 sec bins. Red curve is a Poisson curve with rate = median count rate of data. |
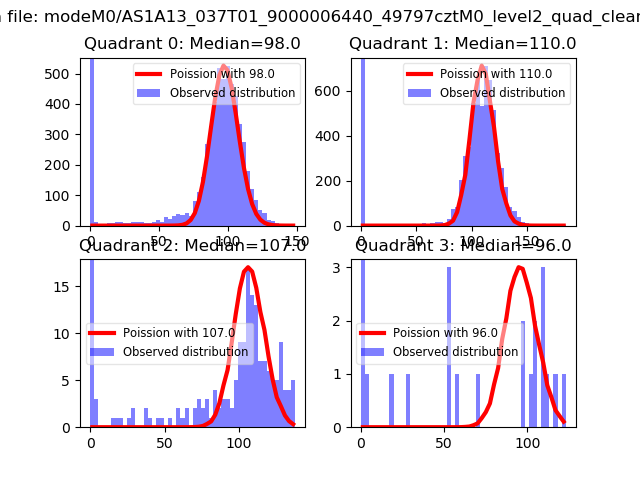 |
 |
| Quadrant-wise count rates Data is divided into 100 sec bins |
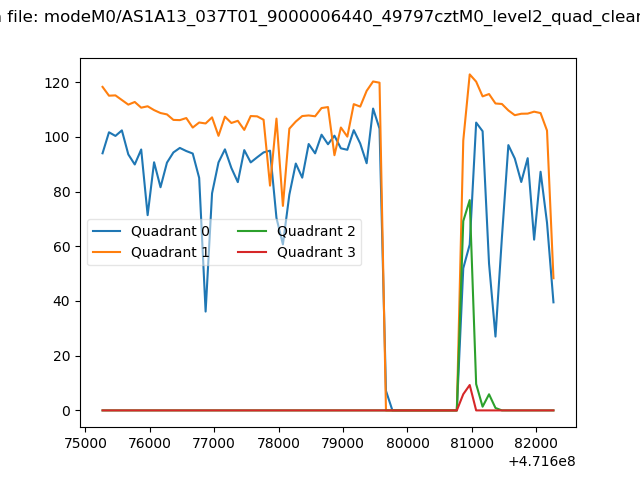 |
|
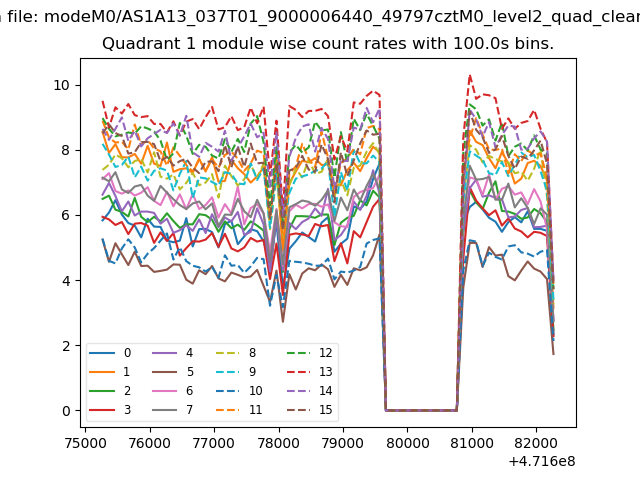
| Module-wise count rates for Quadrant A Data is divided into 100 sec bins |
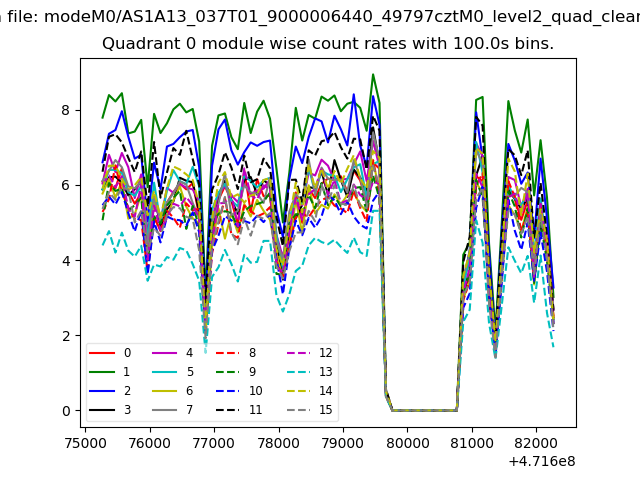 |
 |
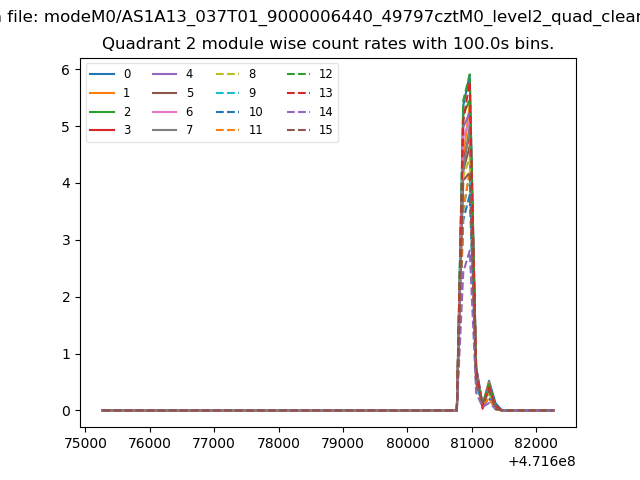
| Module-wise count rates for Quadrant B Data is divided into 100 sec bins |
 |
 |
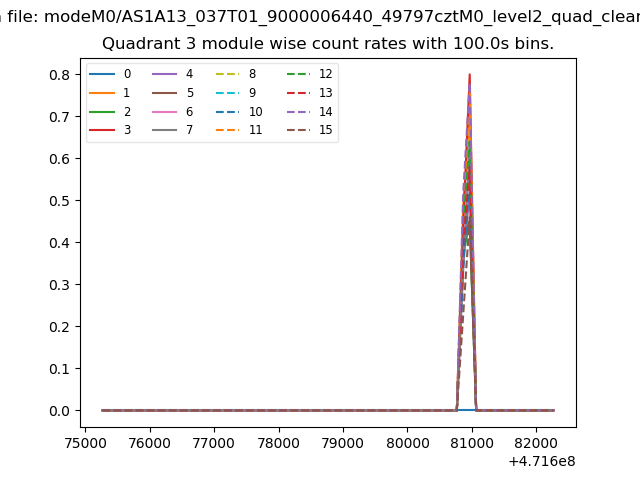
| Module-wise count rates for Quadrant C Data is divided into 100 sec bins |
 |
 |
| Module-wise count rates for Quadrant D Data is divided into 100 sec bins |
 |
 |
| Parameter | Plot |
|---|---|
| CZT HV Monitor | 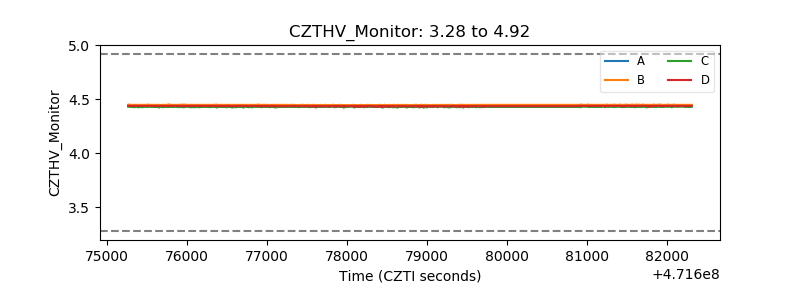 |
| D_VDD | 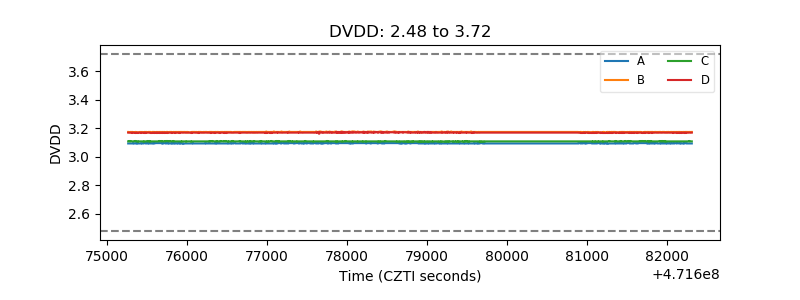 |
| Temperature 1 | 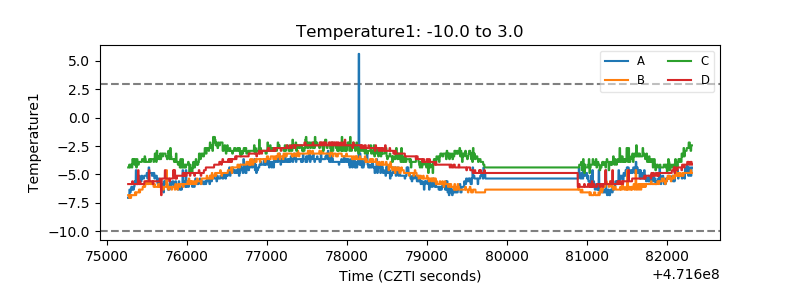 |
| Veto HV Monitor | 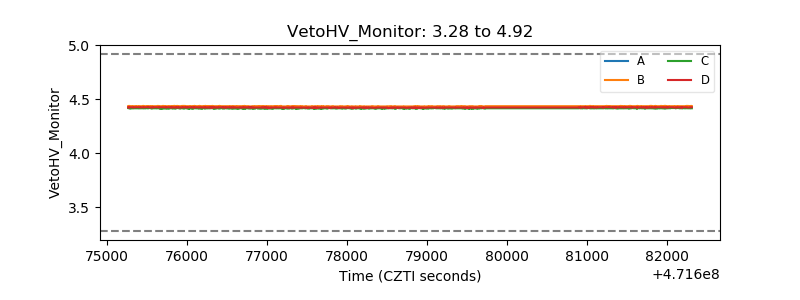 |
| Veto LLD | 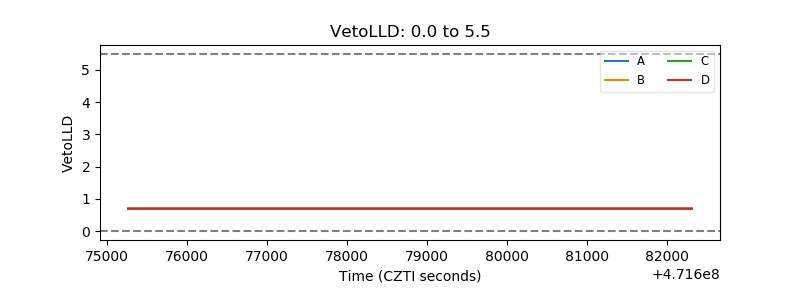 |
| Alpha Counter | 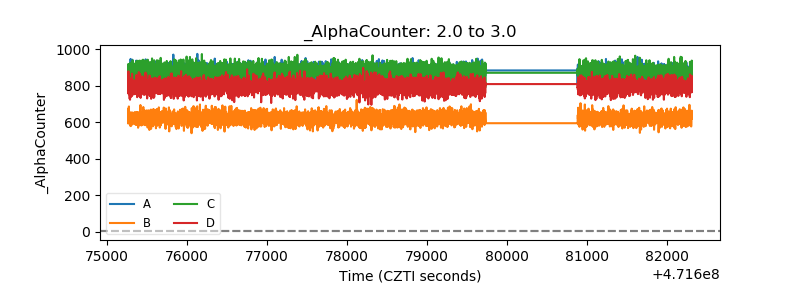 |
| _CPM_Rate | 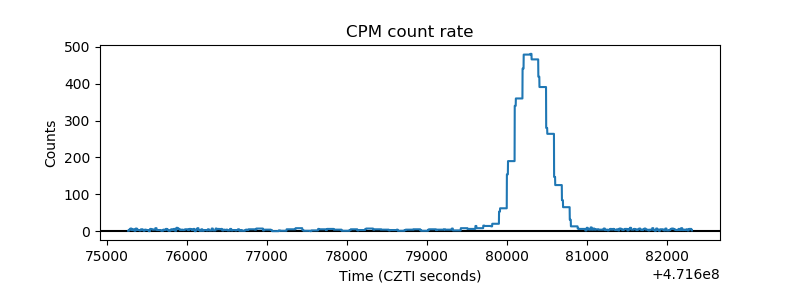 |
| CZT Counter | 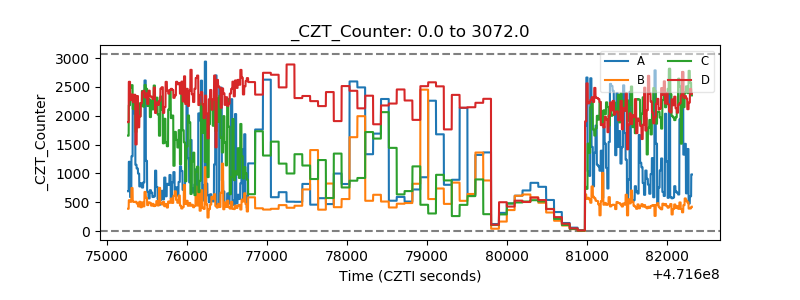 |
| +2.5 Volts monitor | 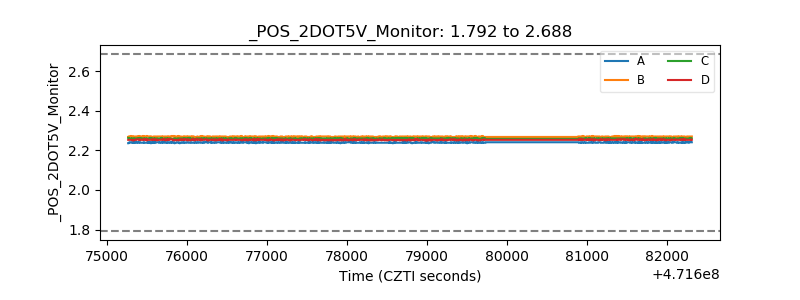 |
| +5 Volts monitor | 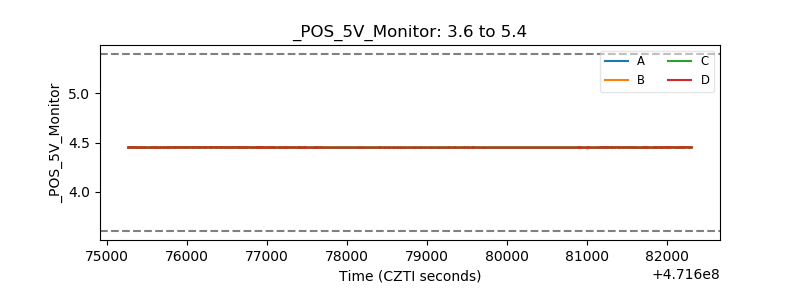 |
| _ROLL_ROT | 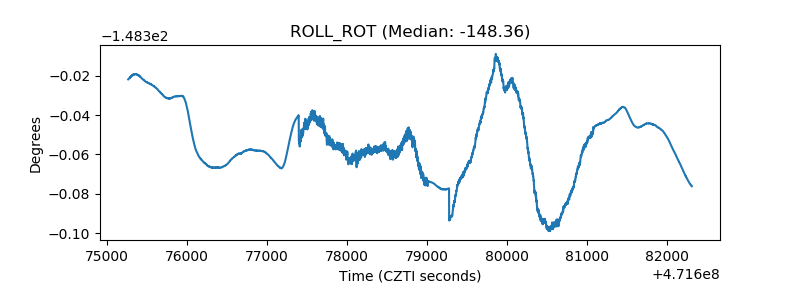 |
| _Roll_DEC | 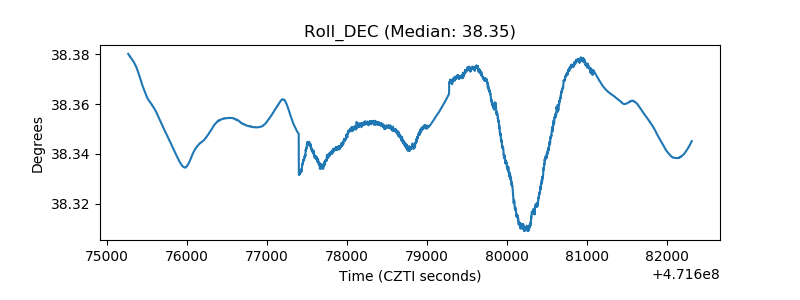 |
| _Roll_RA | 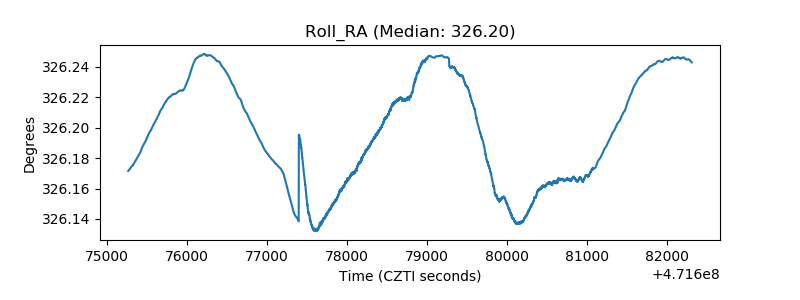 |
| Veto Counter | 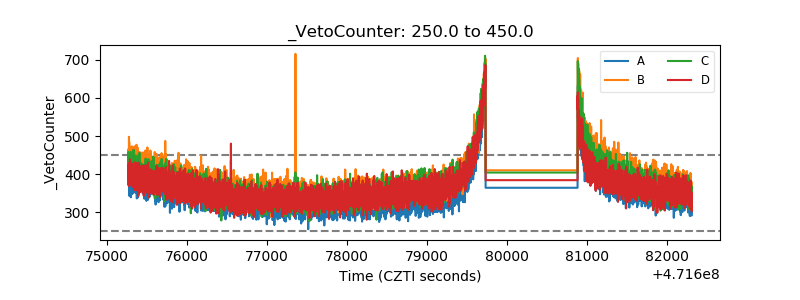 |