| Param | Original file | Final file |
|---|---|---|
| Filename | modeM0/AS1A13_037T01_9000006440_49798cztM0_level2.fits | modeM0/AS1A13_037T01_9000006440_49798cztM0_level2_quad_clean.evt |
| Size (bytes) | 1,067,719,680 | 55,267,200 |
| Size | 1018.3 MB | 52.7 MB |
| Events in quadrant A | 7,801,317 | 522,636 |
| Events in quadrant B | 4,111,353 | 678,775 |
| Events in quadrant C | 11,959,402 | 12,153 |
| Events in quadrant D | 15,140,914 | 612 |
| Mode M9 | |||
|---|---|---|---|
| Quadrant | BADHDUFLAG | Total packets | Discarded packets |
| A | 0 | 9 | 0 |
| B | 0 | 9 | 0 |
| C | 0 | 9 | 0 |
| D | 0 | 9 | 0 |
| Mode SS | |||
|---|---|---|---|
| Quadrant | BADHDUFLAG | Total packets | Discarded packets |
| A | 0 | 134 | 0 |
| B | 0 | 134 | 0 |
| C | 0 | 134 | 0 |
| D | 0 | 134 | 0 |
| Mode M0 | |||
|---|---|---|---|
| Quadrant | BADHDUFLAG | Total packets | Discarded packets |
| A | 0 | 27656 | 1 |
| B | 0 | 16647 | 1 |
| C | 0 | 40083 | 1 |
| D | 0 | 49455 | 1 |
| Quadrant | Total seconds | Saturated seconds | Saturation percentage |
|---|---|---|---|
| A | 6579 | 1396 | 21.219030% |
| B | 6580 | 359 | 5.455927% |
| C | 6580 | 6485 | 98.556231% |
| D | 6580 | 6576 | 99.939210% |
Noise dominated data is calculated using 1-second bins in cleaned event files. If a bin has >2000 counts, and if more than 50% of those come from <1% of pixels, then it is considered to be noise-dominated and hence unusable.
| Quadrant | # 1 sec bins | Bins with >0 counts | Bins with >2000 counts | High rate bins dominated by noise | Noise dominated (total time) | Noise dominated (detector-on time) | Marked lightcurve |
|---|---|---|---|---|---|---|---|
| A | 7544 | 6579 | 1075 | 1075 | 14.25% | 16.34% | 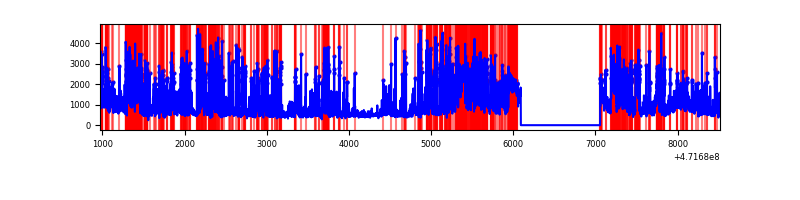 |
| B | 7545 | 6581 | 172 | 172 | 2.28% | 2.61% | 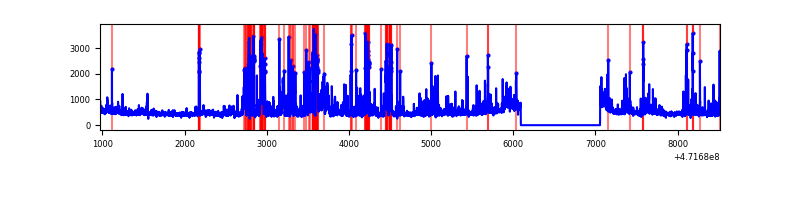 |
| C | 7544 | 6579 | 3067 | 3067 | 40.65% | 46.62% | 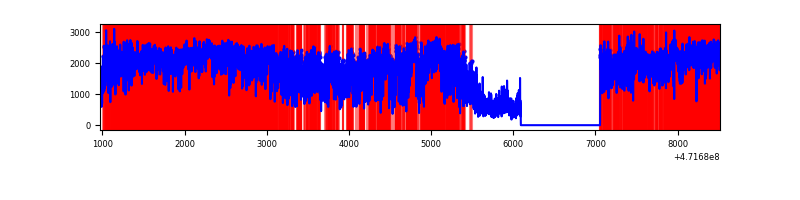 |
| D | 7544 | 6579 | 5636 | 5636 | 74.71% | 85.67% | 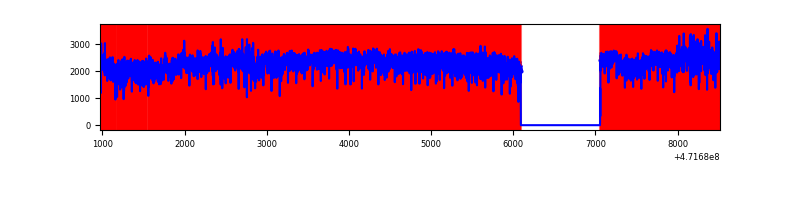 |
Top three noisy pixels from each quadrant. If the there are fewer than three noisy pixels in the level2.evt file, extra rows are filled as -1
| Pixel properties | Quadrant properties | ||||||
|---|---|---|---|---|---|---|---|
| Quadrant | DetID | PixID | Counts | Sigma | Mean | Median | Sigma |
| A | 15 | 63 | 885461 | 5302.84 | 667 | 651 | 166.9 |
| A | 4 | 205 | 811108 | 4857.23 | 667 | 651 | 166.9 |
| A | 0 | 98 | 503404 | 3013.1 | 667 | 651 | 166.9 |
| B | 10 | 28 | 332735 | 2173.43 | 722 | 699 | 152.8 |
| B | 10 | 44 | 303973 | 1985.16 | 722 | 699 | 152.8 |
| B | 4 | 206 | 166433 | 1084.85 | 722 | 699 | 152.8 |
| C | 15 | 147 | 4709321 | 99171.61 | 140 | 138 | 47.5 |
| C | 15 | 230 | 2108539 | 44401.23 | 140 | 138 | 47.5 |
| C | 15 | 213 | 965835 | 20336.8 | 140 | 138 | 47.5 |
| D | 7 | 61 | 4079536 | 67771.15 | 173 | 165 | 60.2 |
| D | 14 | 52 | 2513256 | 41750.32 | 173 | 165 | 60.2 |
| D | 15 | 168 | 1584143 | 26314.84 | 173 | 165 | 60.2 |
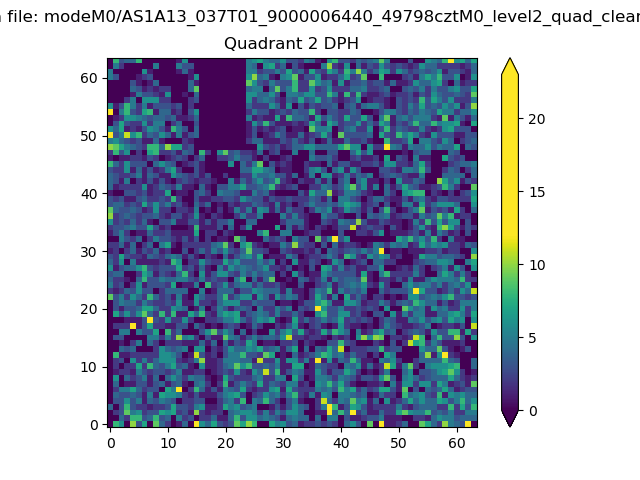
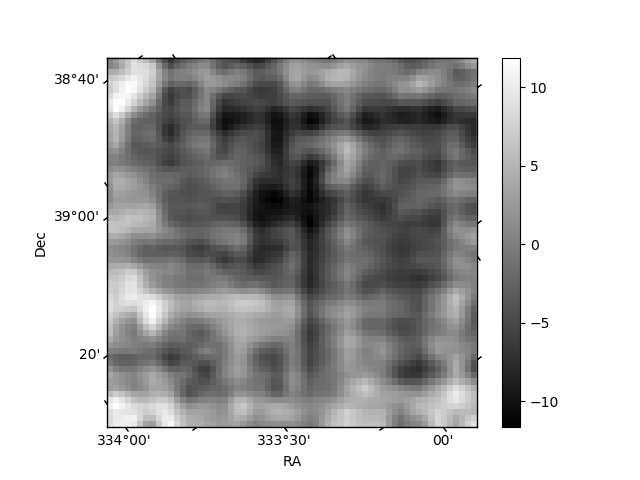
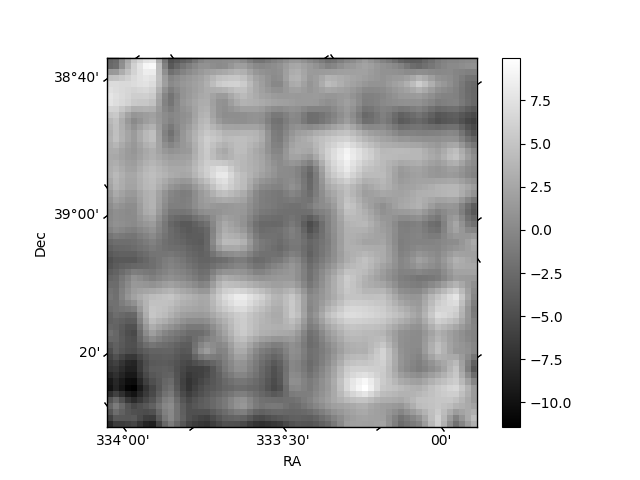
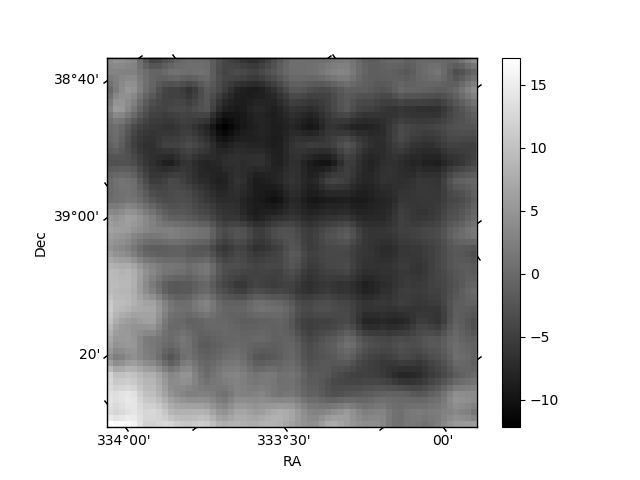
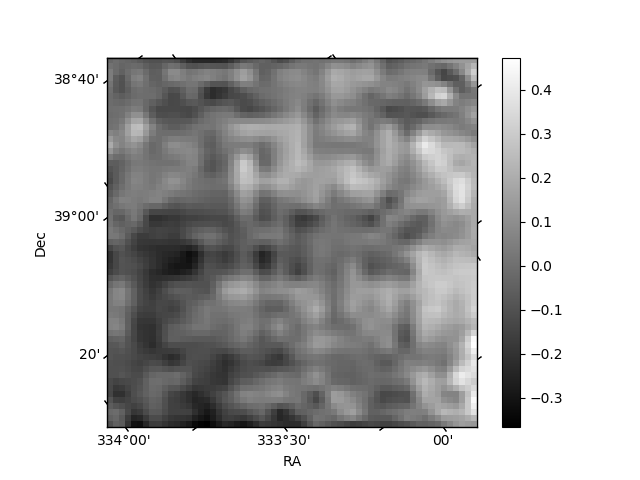
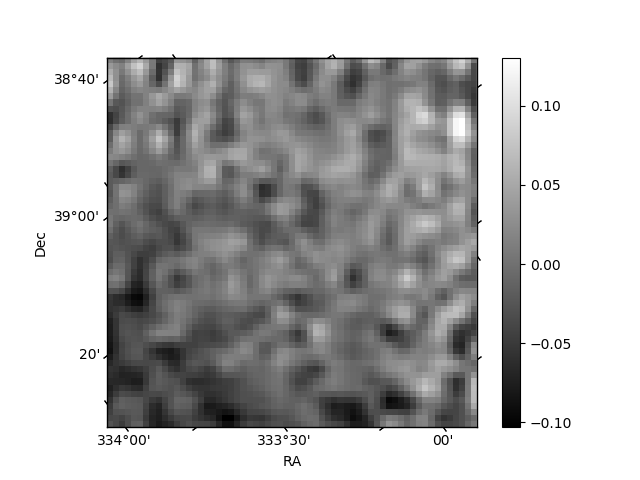
Histogram calculated using DETX and DETY for each event in the final _common_clean file
| Quadrant A | 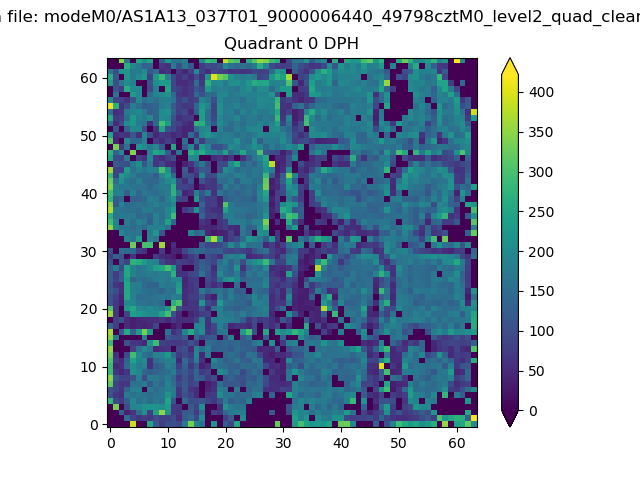 |
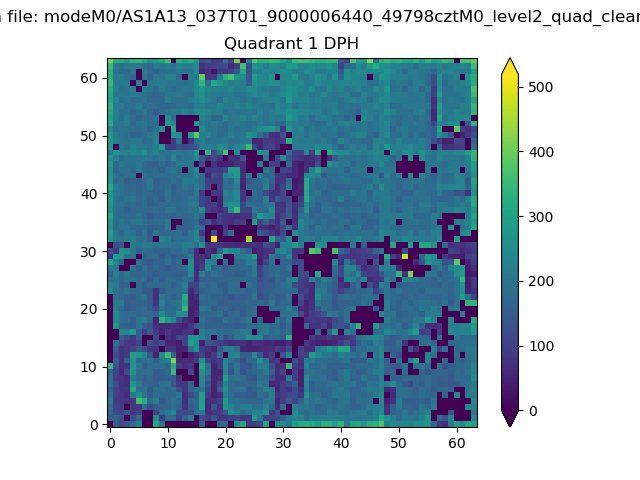 |
Quadrant B |
|---|---|---|---|
| Quadrant D |  |
 |
Quadrant C |
| Plot type | Count rate plots | Images |
|---|---|---|
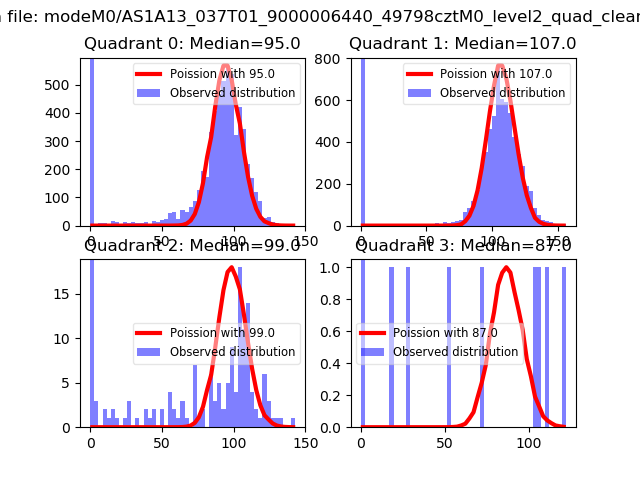
| Comparison with Poisson distribution Blue bars denote a histogram of data divided into 1 sec bins. Red curve is a Poisson curve with rate = median count rate of data. |
 |
 |
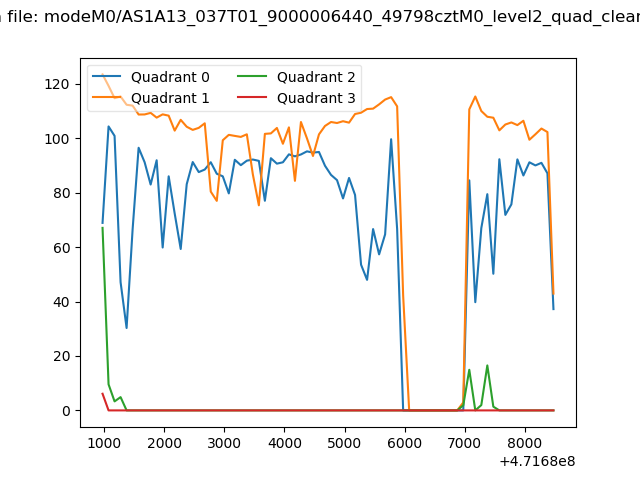
| Quadrant-wise count rates Data is divided into 100 sec bins |
 |
|
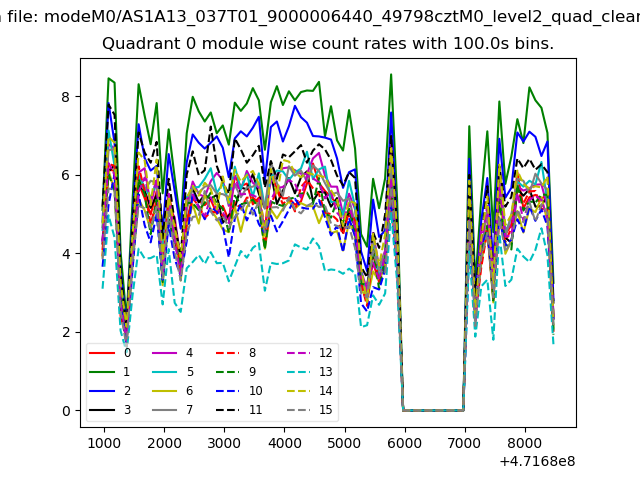
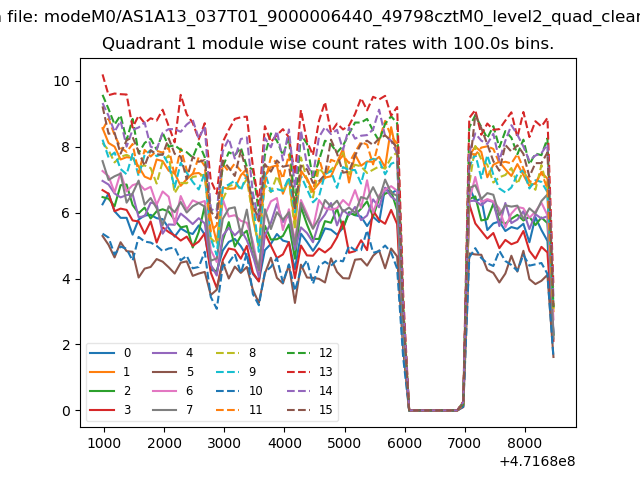
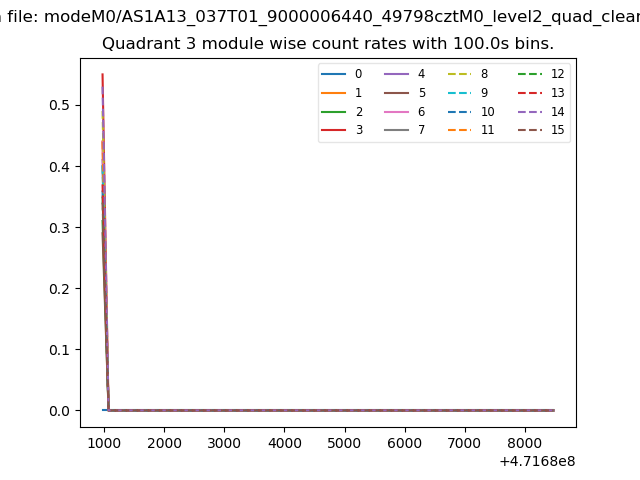
| Module-wise count rates for Quadrant A Data is divided into 100 sec bins |
 |
 |
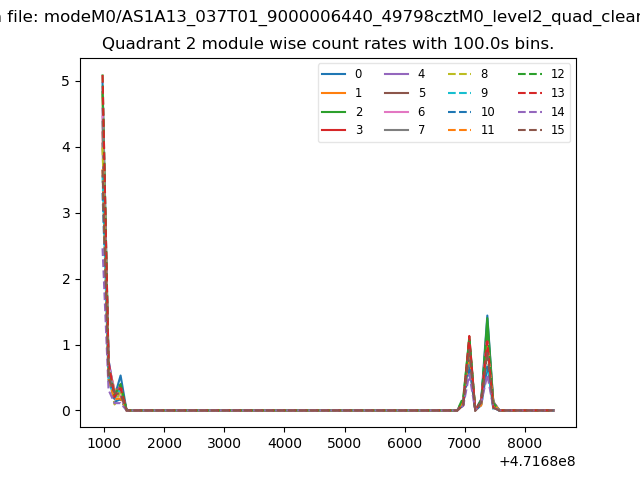
| Module-wise count rates for Quadrant B Data is divided into 100 sec bins |
 |
 |
| Module-wise count rates for Quadrant C Data is divided into 100 sec bins |
 |
 |
| Module-wise count rates for Quadrant D Data is divided into 100 sec bins |
 |
 |
| Parameter | Plot |
|---|---|
| CZT HV Monitor | 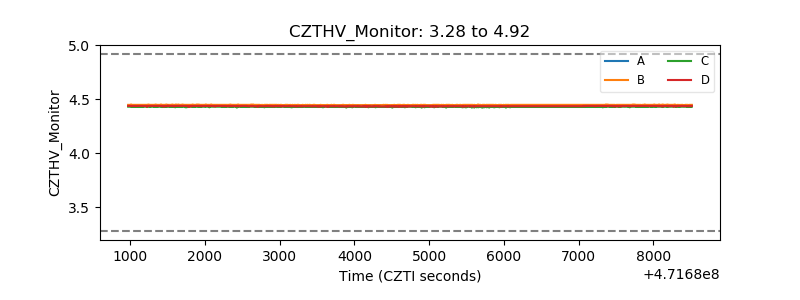 |
| D_VDD | 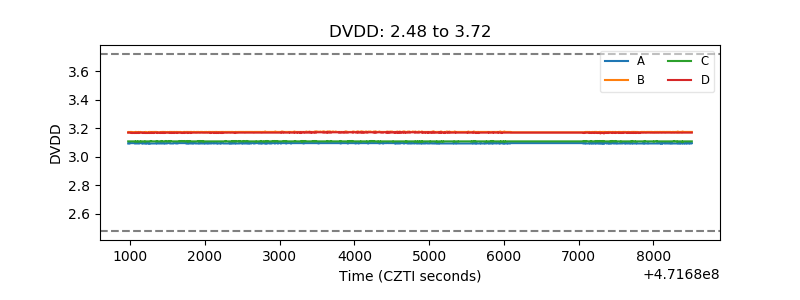 |
| Temperature 1 | 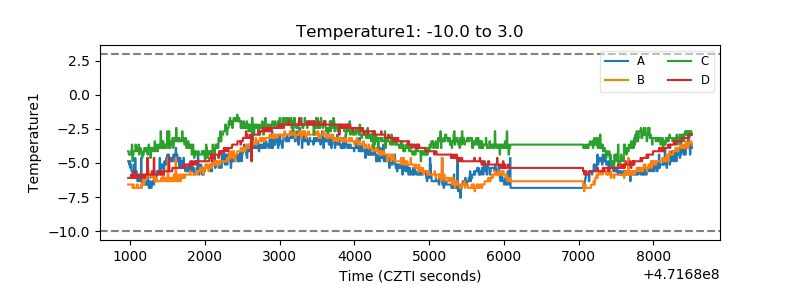 |
| Veto HV Monitor | 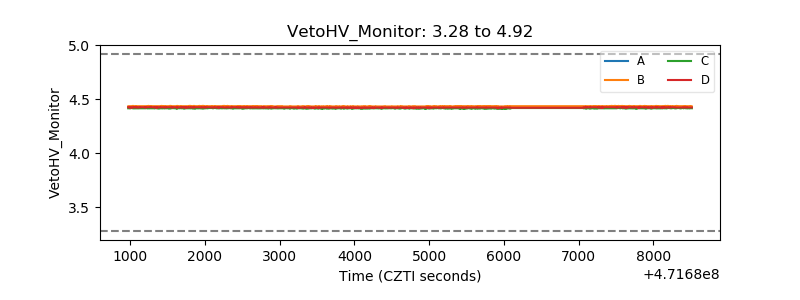 |
| Veto LLD | 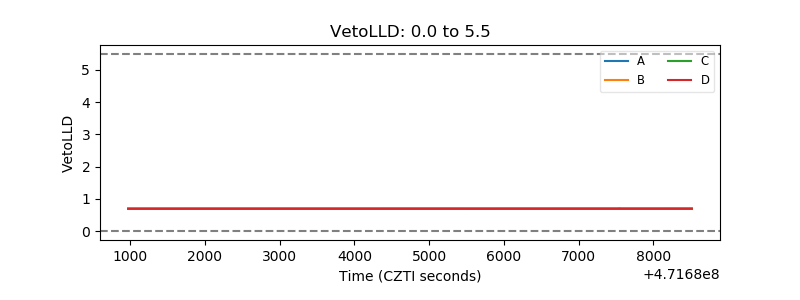 |
| Alpha Counter | 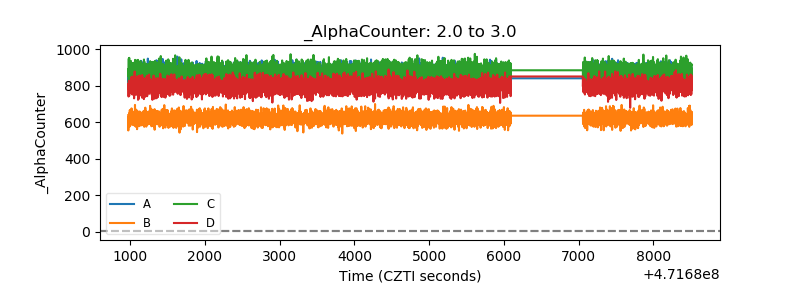 |
| _CPM_Rate | 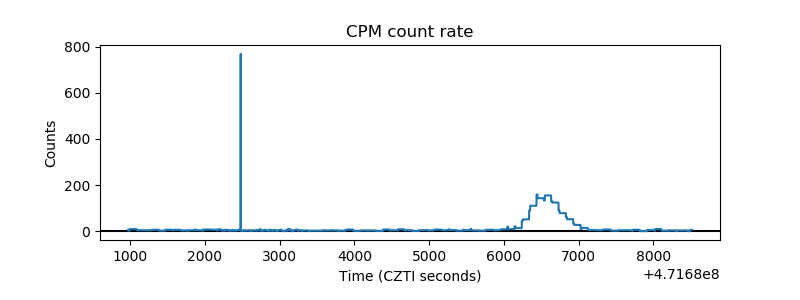 |
| CZT Counter | 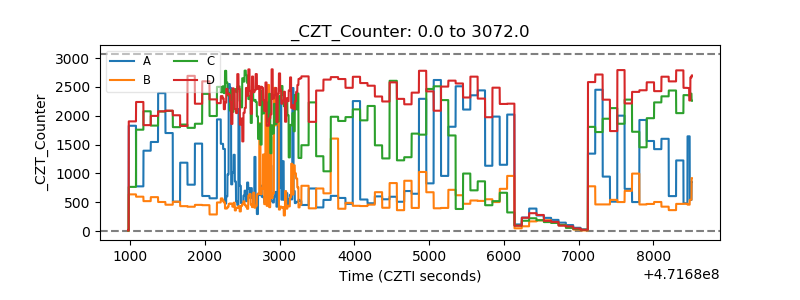 |
| +2.5 Volts monitor | 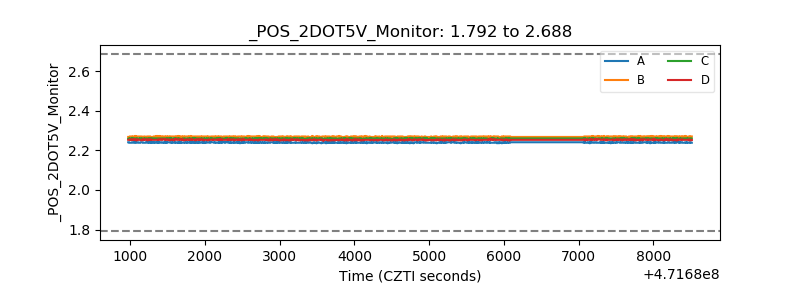 |
| +5 Volts monitor |  |
| _ROLL_ROT | 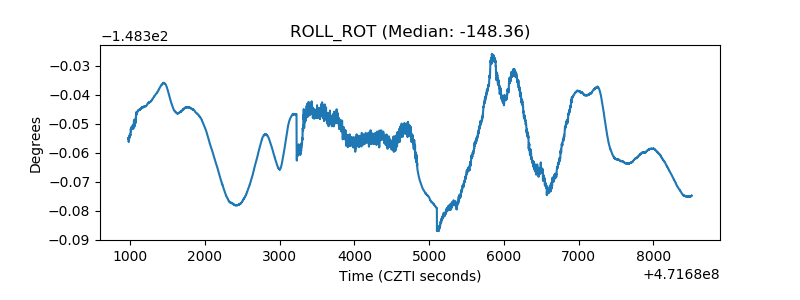 |
| _Roll_DEC | 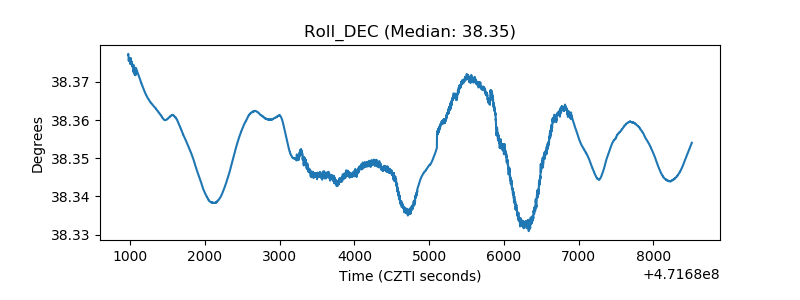 |
| _Roll_RA | 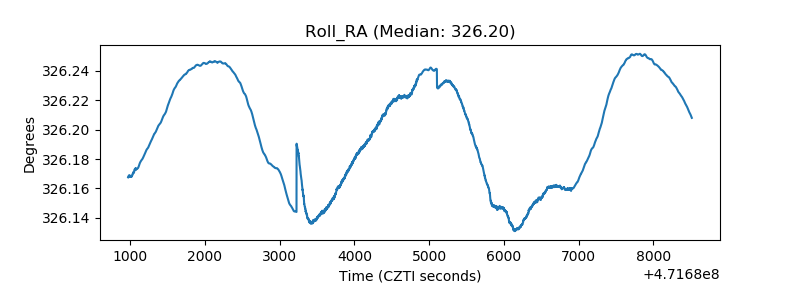 |
| Veto Counter | 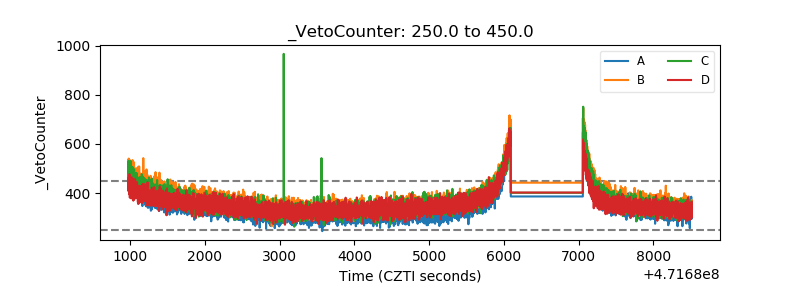 |