| Param | Original file | Final file |
|---|---|---|
| Filename | modeM0/AS1A13_037T01_9000006440_49799cztM0_level2.fits | modeM0/AS1A13_037T01_9000006440_49799cztM0_level2_quad_clean.evt |
| Size (bytes) | 1,010,880,000 | 53,847,360 |
| Size | 964.1 MB | 51.4 MB |
| Events in quadrant A | 7,959,597 | 477,969 |
| Events in quadrant B | 3,660,046 | 644,224 |
| Events in quadrant C | 9,942,109 | 48,028 |
| Events in quadrant D | 15,367,774 | 19,259 |
| Mode M9 | |||
|---|---|---|---|
| Quadrant | BADHDUFLAG | Total packets | Discarded packets |
| A | 0 | 7 | 0 |
| B | 0 | 7 | 0 |
| C | 0 | 7 | 0 |
| D | 0 | 7 | 0 |
| Mode SS | |||
|---|---|---|---|
| Quadrant | BADHDUFLAG | Total packets | Discarded packets |
| A | 0 | 128 | 0 |
| B | 0 | 128 | 0 |
| C | 0 | 128 | 0 |
| D | 0 | 128 | 0 |
| Mode M0 | |||
|---|---|---|---|
| Quadrant | BADHDUFLAG | Total packets | Discarded packets |
| A | 0 | 28046 | 3 |
| B | 0 | 15341 | 1 |
| C | 0 | 33908 | 1 |
| D | 0 | 49949 | 1 |
| Quadrant | Total seconds | Saturated seconds | Saturation percentage |
|---|---|---|---|
| A | 6314 | 1415 | 22.410516% |
| B | 6315 | 191 | 3.024545% |
| C | 6315 | 5895 | 93.349169% |
| D | 6315 | 6146 | 97.323832% |
Noise dominated data is calculated using 1-second bins in cleaned event files. If a bin has >2000 counts, and if more than 50% of those come from <1% of pixels, then it is considered to be noise-dominated and hence unusable.
| Quadrant | # 1 sec bins | Bins with >0 counts | Bins with >2000 counts | High rate bins dominated by noise | Noise dominated (total time) | Noise dominated (detector-on time) | Marked lightcurve |
|---|---|---|---|---|---|---|---|
| A | 6964 | 6314 | 1144 | 1144 | 16.43% | 18.12% | 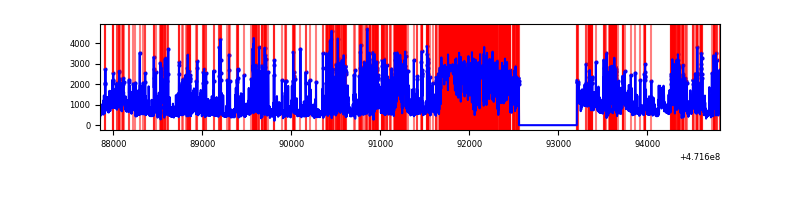 |
| B | 6965 | 6316 | 81 | 81 | 1.16% | 1.28% | 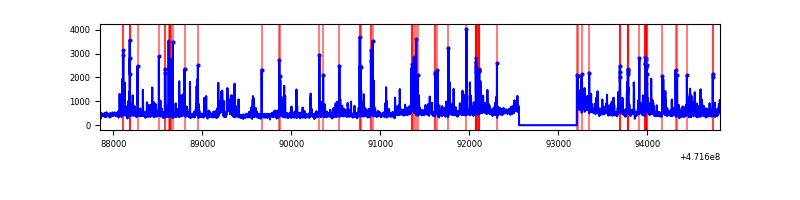 |
| C | 6964 | 6314 | 2207 | 2207 | 31.69% | 34.95% | 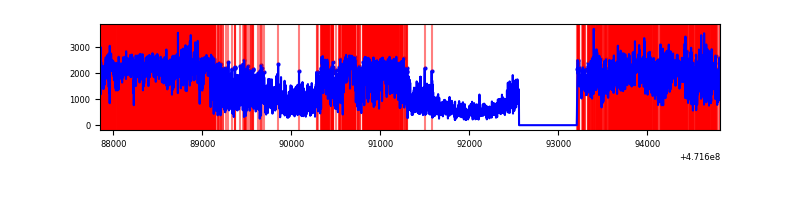 |
| D | 6964 | 6314 | 5649 | 5649 | 81.12% | 89.47% | 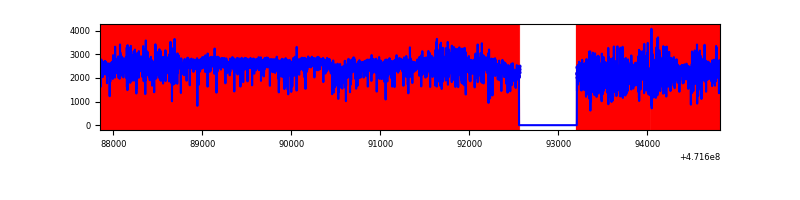 |
Top three noisy pixels from each quadrant. If the there are fewer than three noisy pixels in the level2.evt file, extra rows are filled as -1
| Pixel properties | Quadrant properties | ||||||
|---|---|---|---|---|---|---|---|
| Quadrant | DetID | PixID | Counts | Sigma | Mean | Median | Sigma |
| A | 0 | 98 | 1017744 | 6611.04 | 621 | 606 | 153.9 |
| A | 4 | 205 | 588056 | 3818.22 | 621 | 606 | 153.9 |
| A | 15 | 63 | 549788 | 3569.49 | 621 | 606 | 153.9 |
| B | 10 | 28 | 273346 | 1894.96 | 673 | 652 | 143.9 |
| B | 4 | 206 | 163109 | 1128.92 | 673 | 652 | 143.9 |
| B | 10 | 247 | 113820 | 786.41 | 673 | 652 | 143.9 |
| C | 15 | 147 | 3744445 | 65003.61 | 180 | 177 | 57.6 |
| C | 15 | 230 | 1120846 | 19455.75 | 180 | 177 | 57.6 |
| C | 15 | 197 | 1096494 | 19032.97 | 180 | 177 | 57.6 |
| D | 15 | 106 | 2082875 | 25450.71 | 253 | 242 | 81.8 |
| D | 8 | 176 | 2035048 | 24866.24 | 253 | 242 | 81.8 |
| D | 7 | 61 | 1790354 | 21875.97 | 253 | 242 | 81.8 |
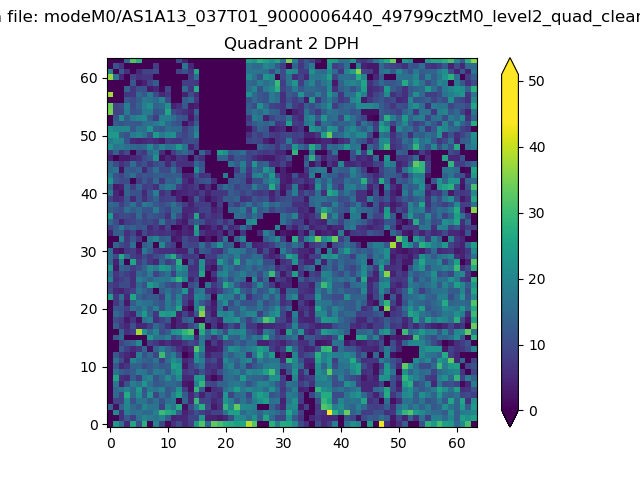
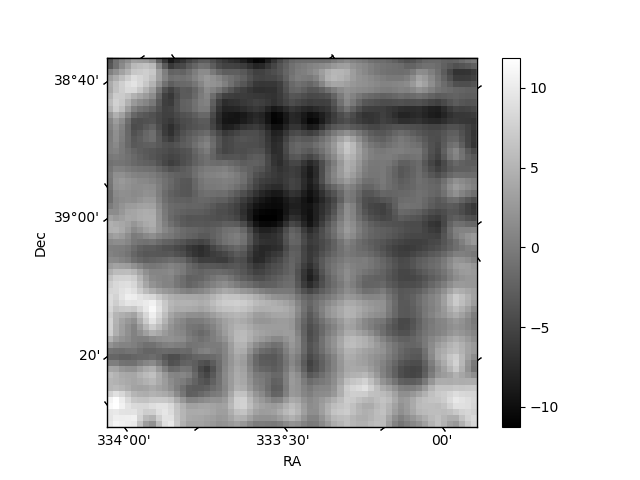
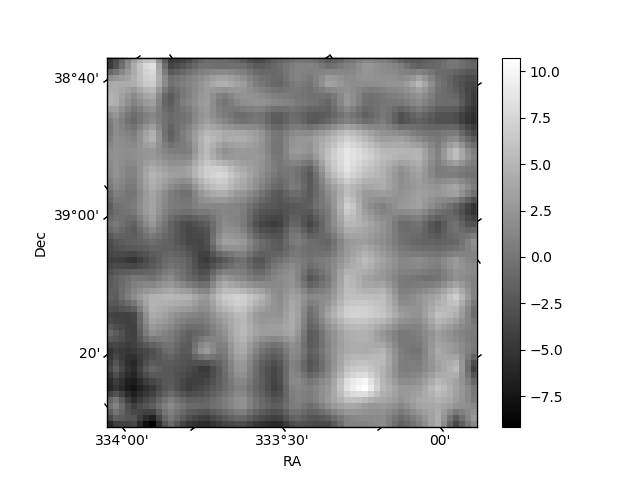
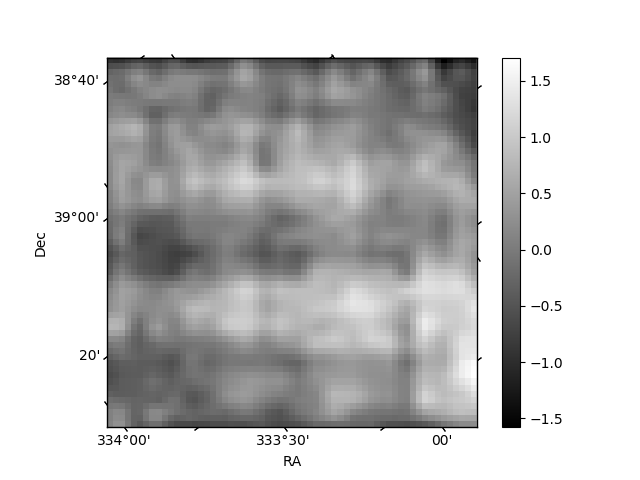
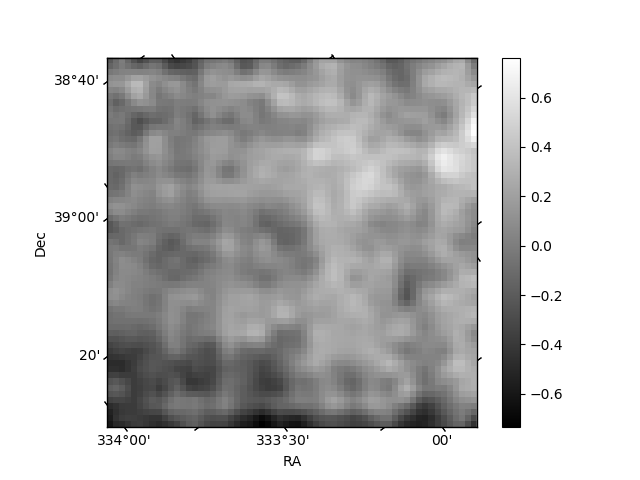
Histogram calculated using DETX and DETY for each event in the final _common_clean file
| Quadrant A | 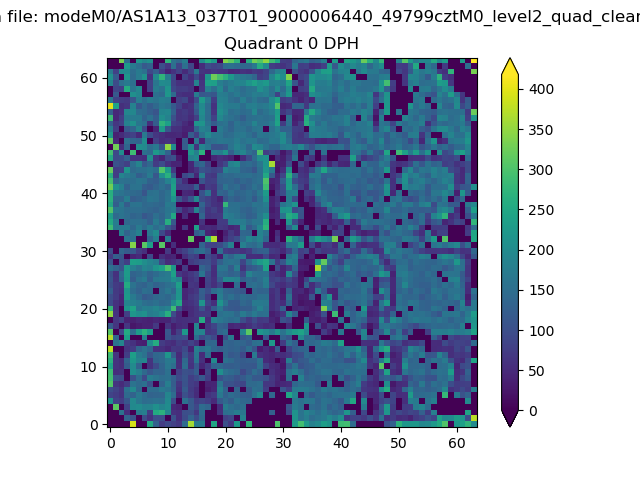 |
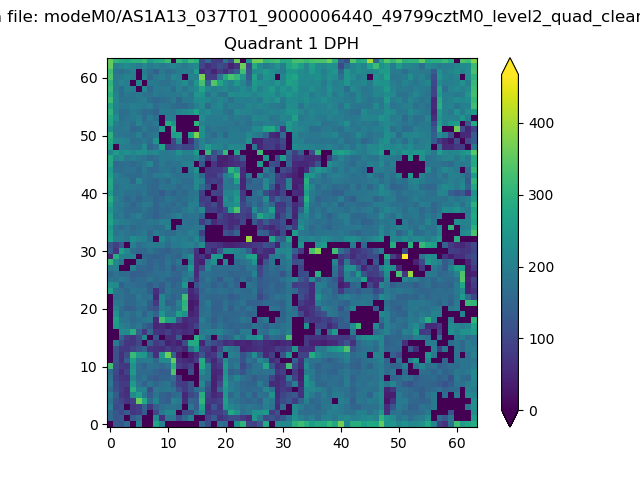 |
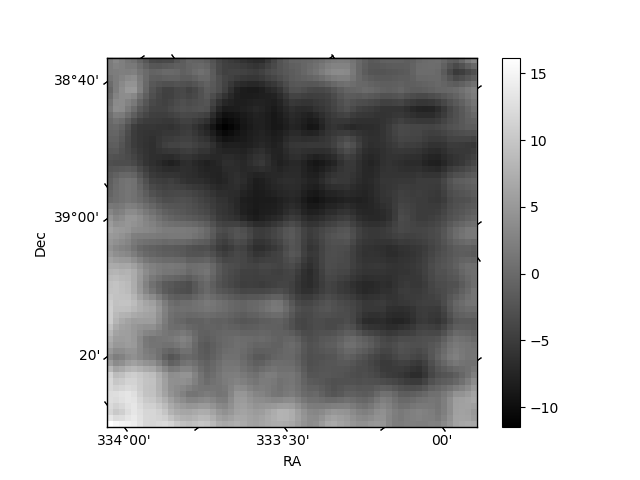
Quadrant B |
|---|---|---|---|
| Quadrant D | 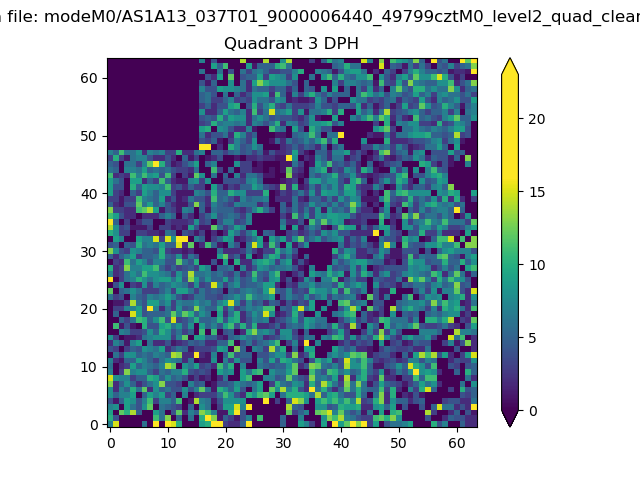 |
 |
Quadrant C |
| Plot type | Count rate plots | Images |
|---|---|---|
| Comparison with Poisson distribution Blue bars denote a histogram of data divided into 1 sec bins. Red curve is a Poisson curve with rate = median count rate of data. |
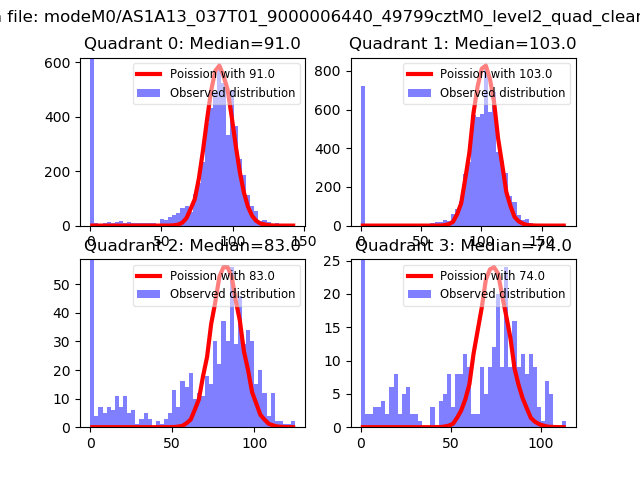 |
 |
| Quadrant-wise count rates Data is divided into 100 sec bins |
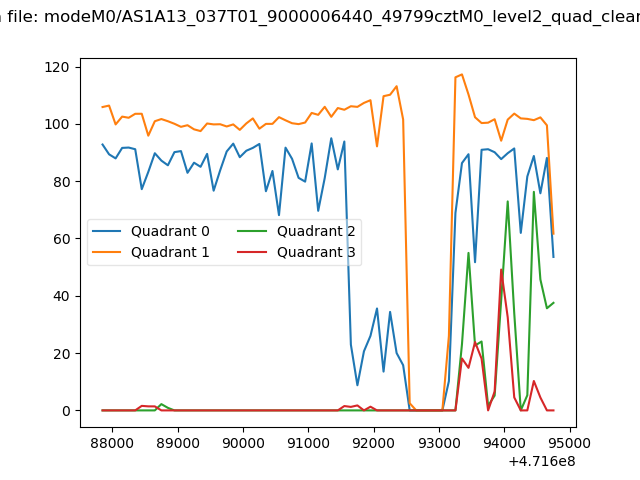 |
|
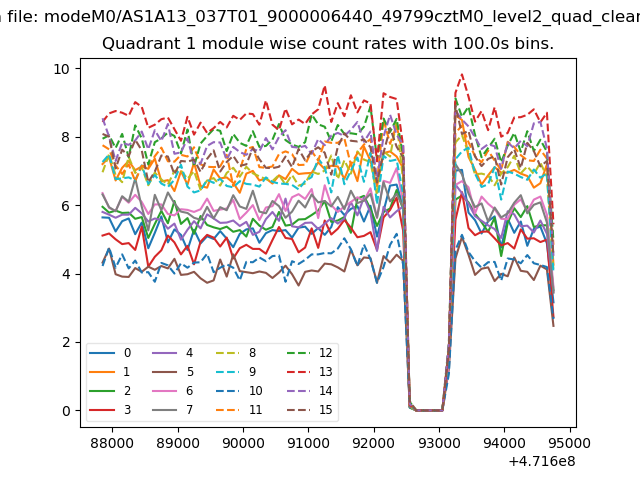
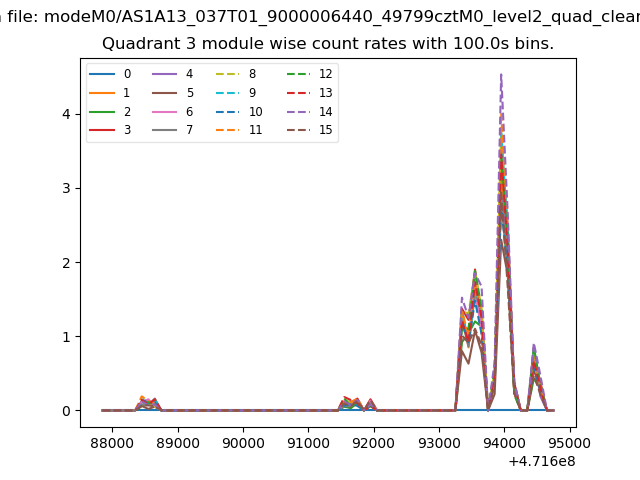
| Module-wise count rates for Quadrant A Data is divided into 100 sec bins |
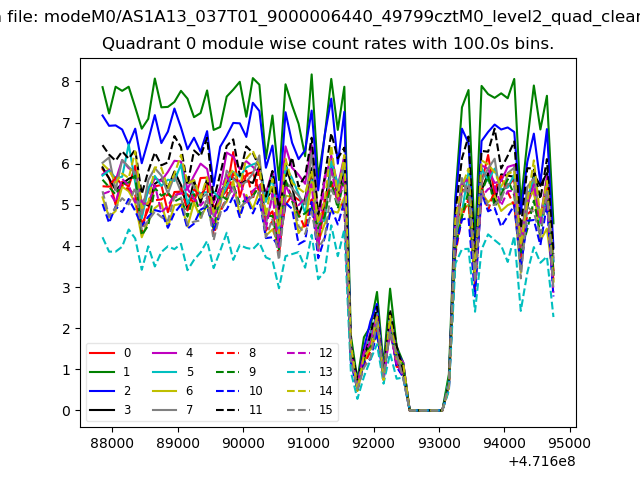 |
 |
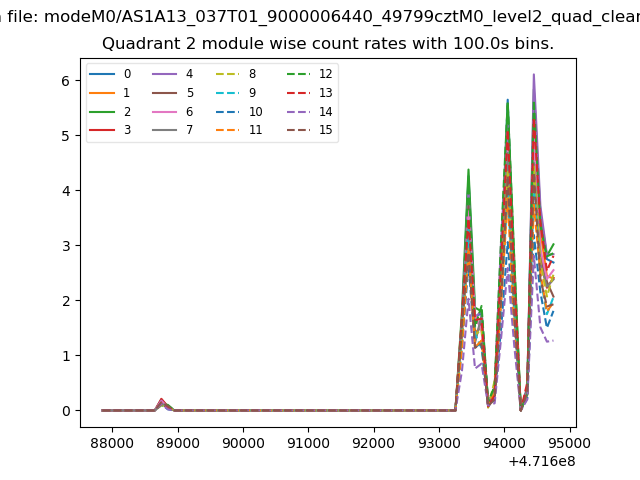
| Module-wise count rates for Quadrant B Data is divided into 100 sec bins |
 |
 |
| Module-wise count rates for Quadrant C Data is divided into 100 sec bins |
 |
 |
| Module-wise count rates for Quadrant D Data is divided into 100 sec bins |
 |
 |
| Parameter | Plot |
|---|---|
| CZT HV Monitor |  |
| D_VDD | 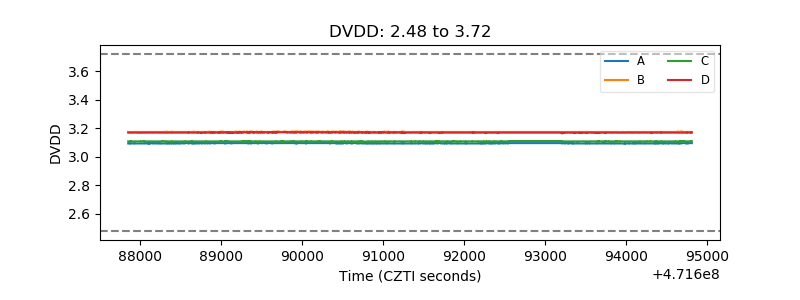 |
| Temperature 1 | 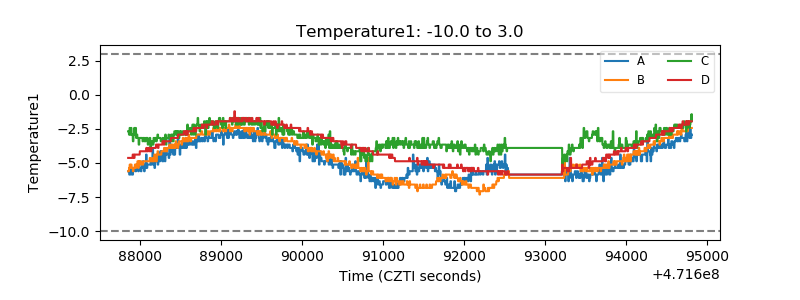 |
| Veto HV Monitor | 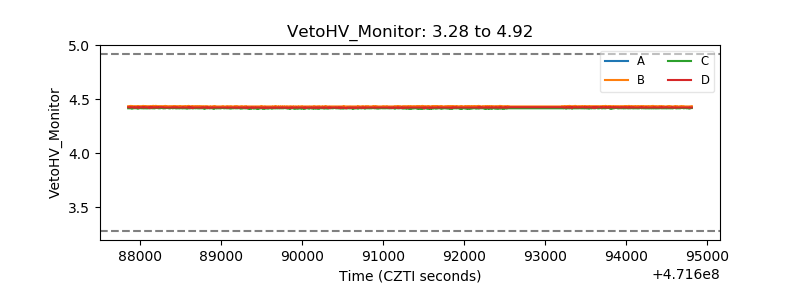 |
| Veto LLD | 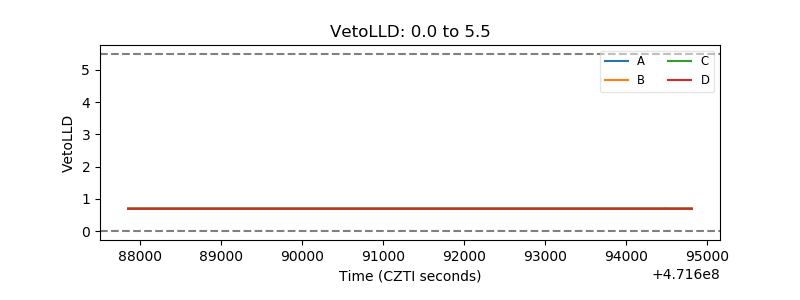 |
| Alpha Counter | 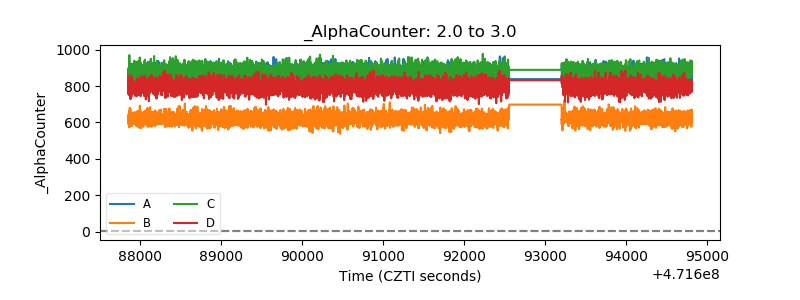 |
| _CPM_Rate | 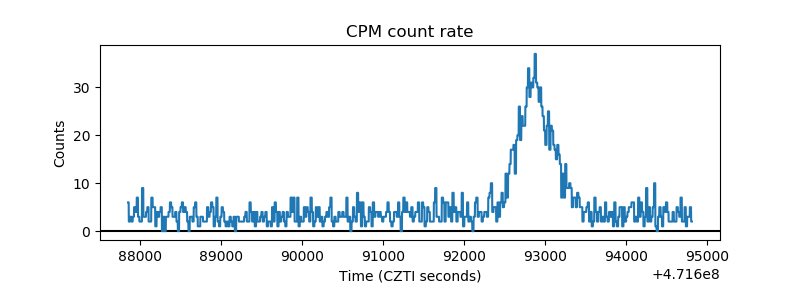 |
| CZT Counter | 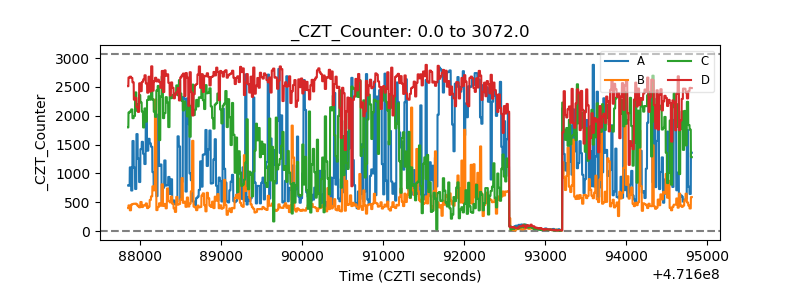 |
| +2.5 Volts monitor | 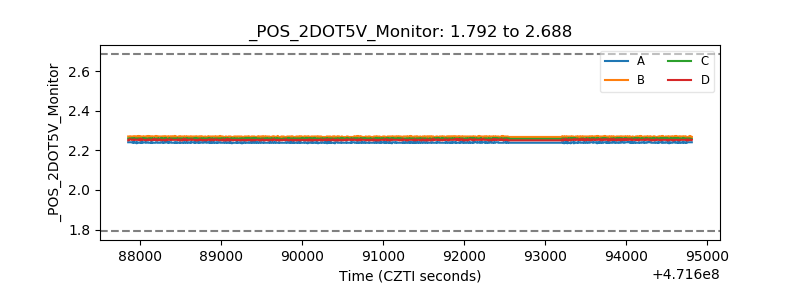 |
| +5 Volts monitor | 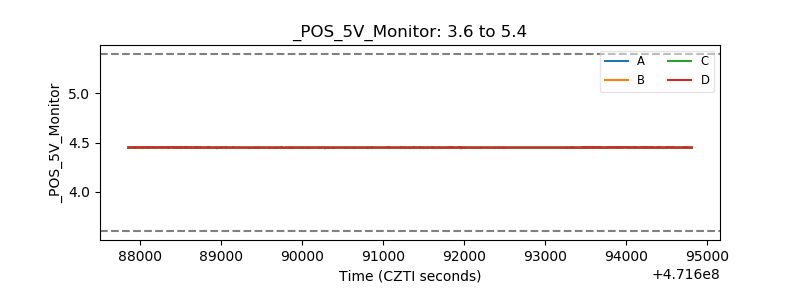 |
| _ROLL_ROT | 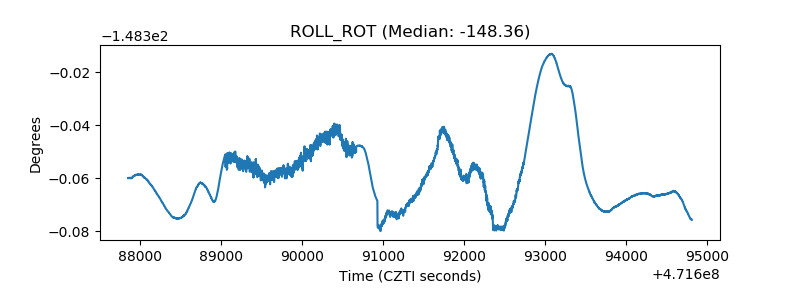 |
| _Roll_DEC | 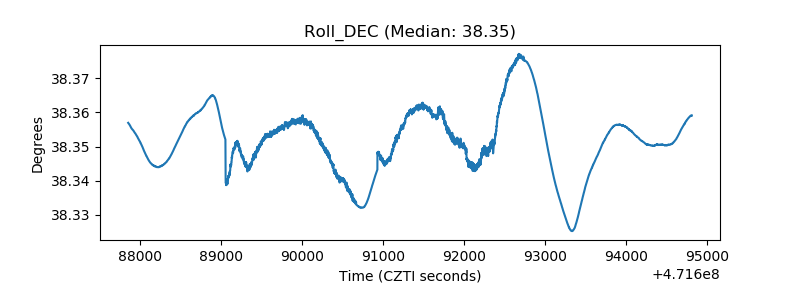 |
| _Roll_RA | 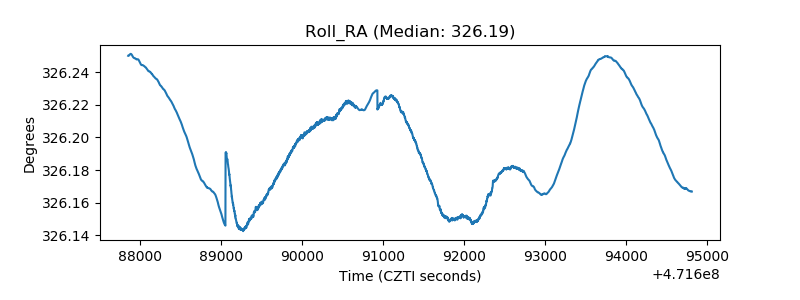 |
| Veto Counter | 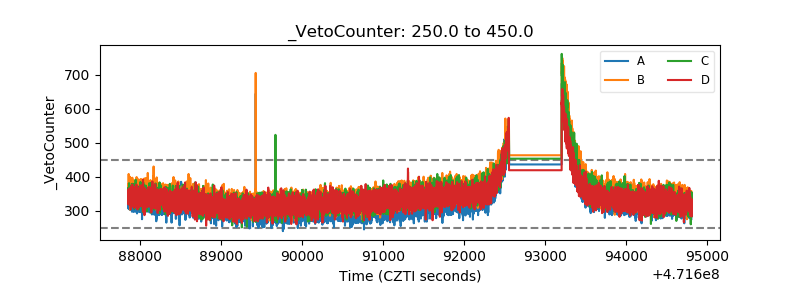 |