| Param | Original file | Final file |
|---|---|---|
| Filename | modeM0/AS1A13_037T01_9000006440_49800cztM0_level2.fits | modeM0/AS1A13_037T01_9000006440_49800cztM0_level2_quad_clean.evt |
| Size (bytes) | 1,157,964,480 | 55,103,040 |
| Size | 1.1 GB | 52.6 MB |
| Events in quadrant A | 11,511,118 | 389,439 |
| Events in quadrant B | 4,904,961 | 711,824 |
| Events in quadrant C | 8,345,041 | 36,745 |
| Events in quadrant D | 17,544,365 | 29,091 |
| Mode SS | |||
|---|---|---|---|
| Quadrant | BADHDUFLAG | Total packets | Discarded packets |
| A | 0 | 144 | 0 |
| B | 0 | 144 | 0 |
| C | 0 | 144 | 0 |
| D | 0 | 144 | 0 |
| Mode M0 | |||
|---|---|---|---|
| Quadrant | BADHDUFLAG | Total packets | Discarded packets |
| A | 0 | 39127 | 0 |
| B | 0 | 19542 | 7 |
| C | 0 | 29913 | 0 |
| D | 0 | 56987 | 0 |
| Quadrant | Total seconds | Saturated seconds | Saturation percentage |
|---|---|---|---|
| A | 7195 | 3206 | 44.558721% |
| B | 7194 | 429 | 5.963303% |
| C | 7194 | 6860 | 95.357242% |
| D | 7194 | 6939 | 96.455379% |
Noise dominated data is calculated using 1-second bins in cleaned event files. If a bin has >2000 counts, and if more than 50% of those come from <1% of pixels, then it is considered to be noise-dominated and hence unusable.
| Quadrant | # 1 sec bins | Bins with >0 counts | Bins with >2000 counts | High rate bins dominated by noise | Noise dominated (total time) | Noise dominated (detector-on time) | Marked lightcurve |
|---|---|---|---|---|---|---|---|
| A | 7194 | 7194 | 2875 | 2875 | 39.96% | 39.96% | 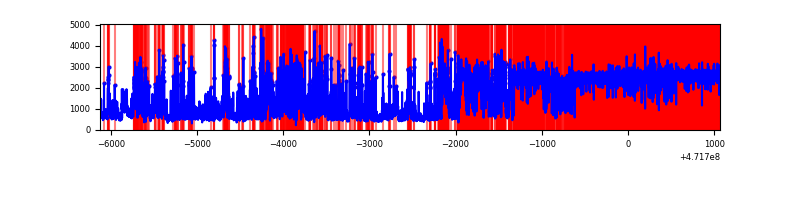 |
| B | 7193 | 7193 | 233 | 233 | 3.24% | 3.24% | 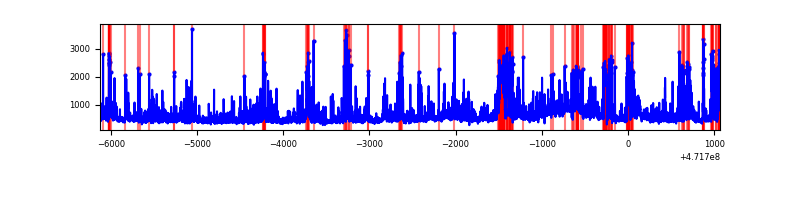 |
| C | 7193 | 7193 | 1307 | 1307 | 18.17% | 18.17% | 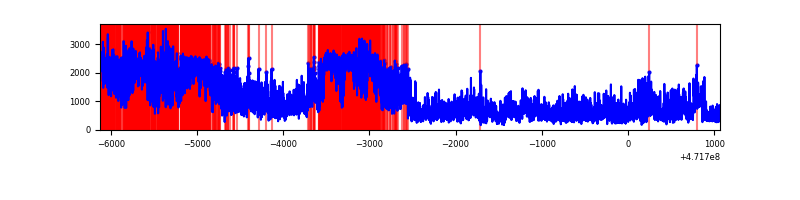 |
| D | 7193 | 7193 | 6517 | 6517 | 90.60% | 90.60% | 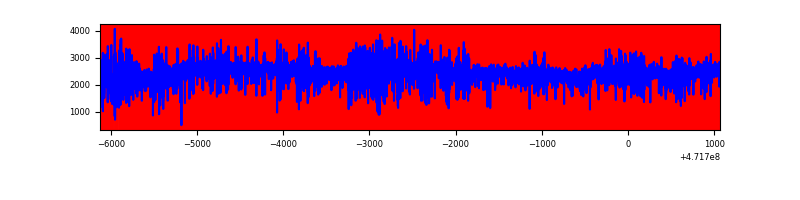 |
Top three noisy pixels from each quadrant. If the there are fewer than three noisy pixels in the level2.evt file, extra rows are filled as -1
| Pixel properties | Quadrant properties | ||||||
|---|---|---|---|---|---|---|---|
| Quadrant | DetID | PixID | Counts | Sigma | Mean | Median | Sigma |
| A | 0 | 98 | 4954363 | 31276.72 | 617 | 601 | 158.4 |
| A | 15 | 63 | 944400 | 5958.89 | 617 | 601 | 158.4 |
| A | 3 | 1 | 306504 | 1931.39 | 617 | 601 | 158.4 |
| B | 10 | 44 | 389054 | 2371.33 | 771 | 748 | 163.8 |
| B | 10 | 28 | 295426 | 1799.56 | 771 | 748 | 163.8 |
| B | 12 | 18 | 291597 | 1776.17 | 771 | 748 | 163.8 |
| C | 15 | 147 | 3300010 | 89671.9 | 105 | 104 | 36.8 |
| C | 15 | 230 | 981021 | 26655.51 | 105 | 104 | 36.8 |
| C | 15 | 197 | 737541 | 20039.17 | 105 | 104 | 36.8 |
| D | 7 | 61 | 4060945 | 32525.22 | 347 | 330 | 124.8 |
| D | 15 | 168 | 3500568 | 28036.64 | 347 | 330 | 124.8 |
| D | 8 | 176 | 1526527 | 12224.72 | 347 | 330 | 124.8 |
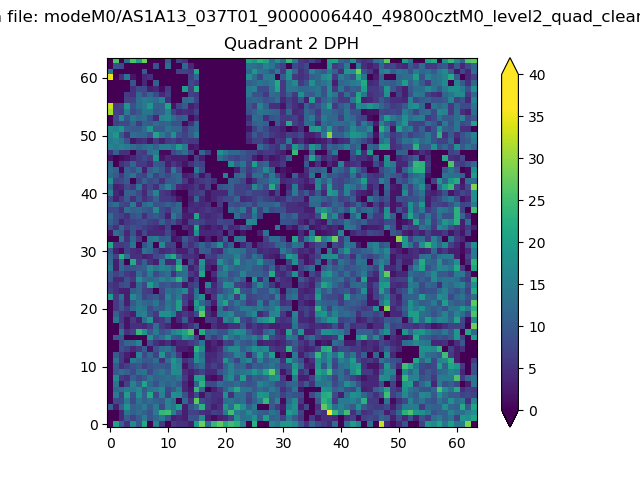
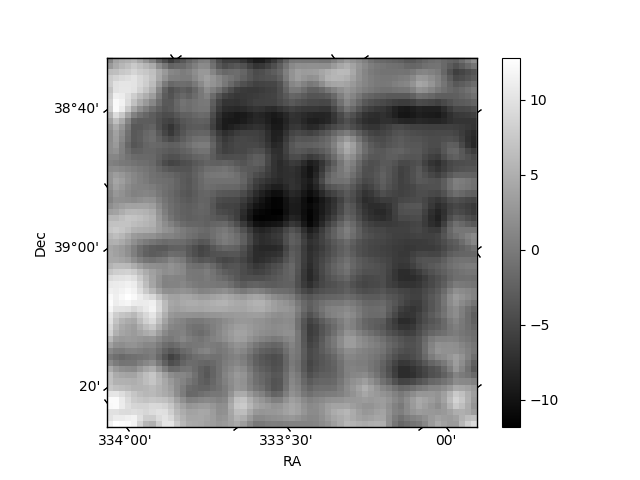
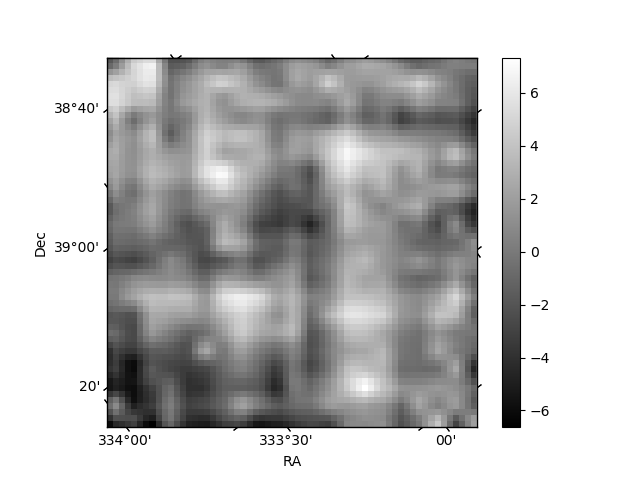
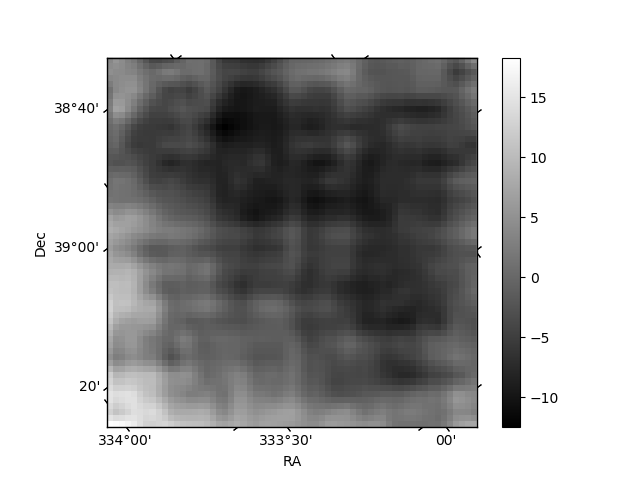
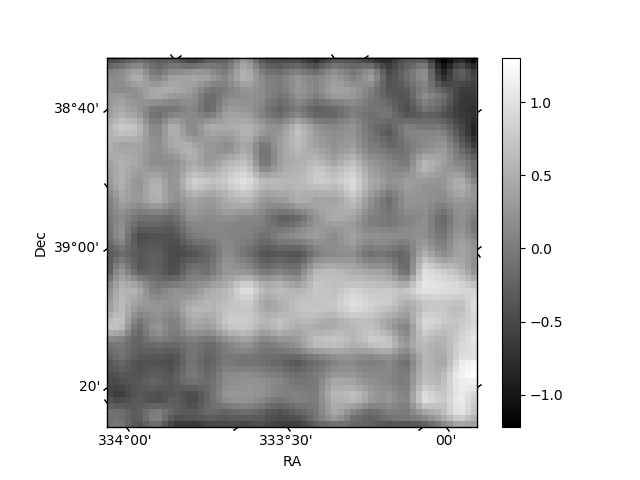
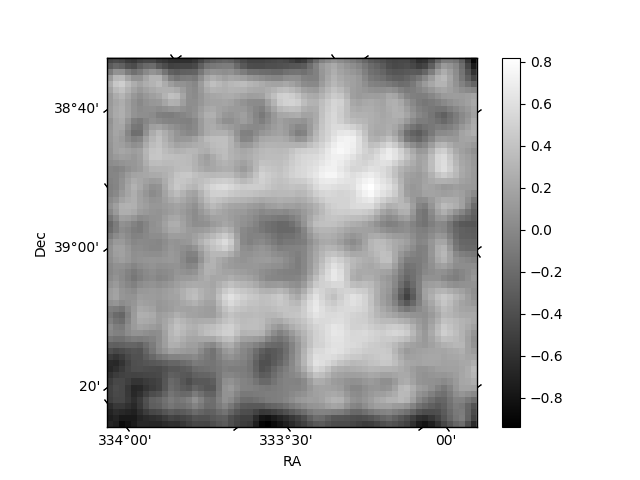
Histogram calculated using DETX and DETY for each event in the final _common_clean file
| Quadrant A | 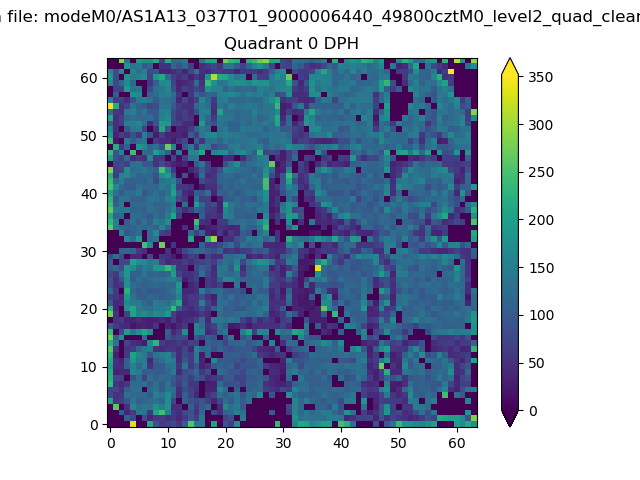 |
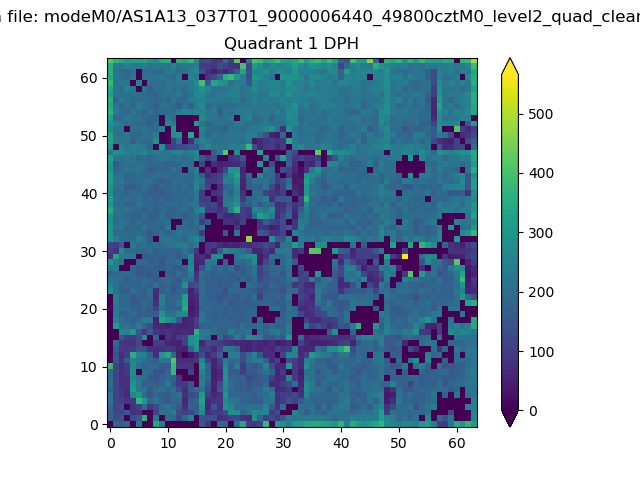 |
Quadrant B |
|---|---|---|---|
| Quadrant D | 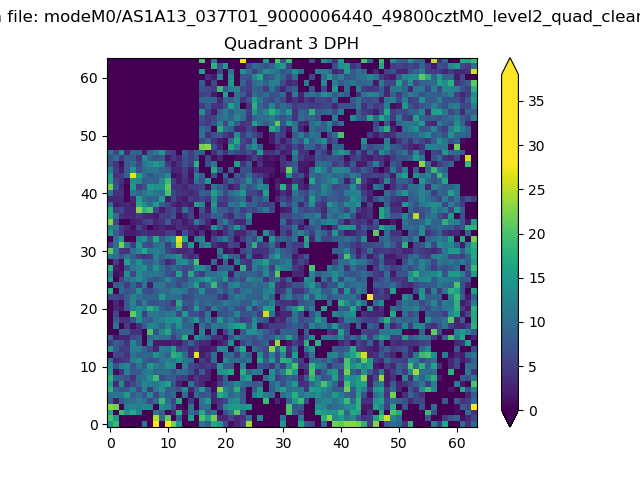 |
 |
Quadrant C |
| Plot type | Count rate plots | Images |
|---|---|---|
| Comparison with Poisson distribution Blue bars denote a histogram of data divided into 1 sec bins. Red curve is a Poisson curve with rate = median count rate of data. |
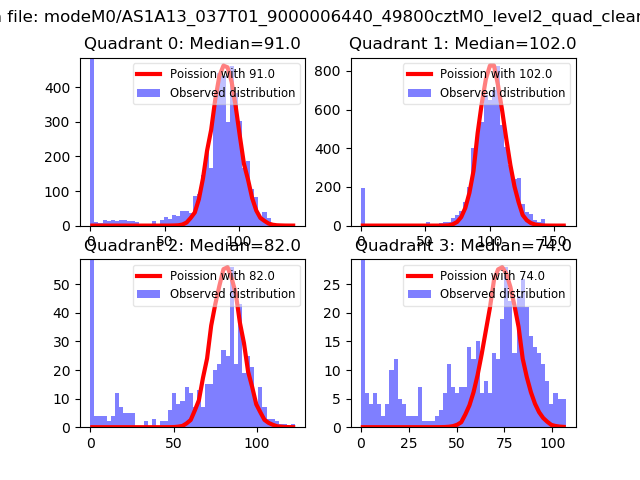 |
 |
| Quadrant-wise count rates Data is divided into 100 sec bins |
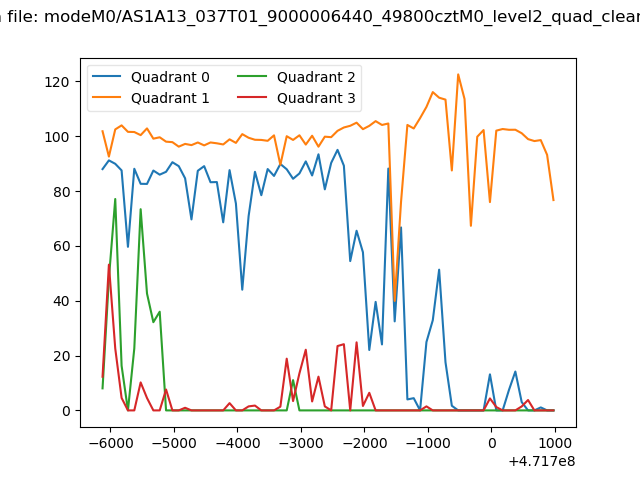 |
|
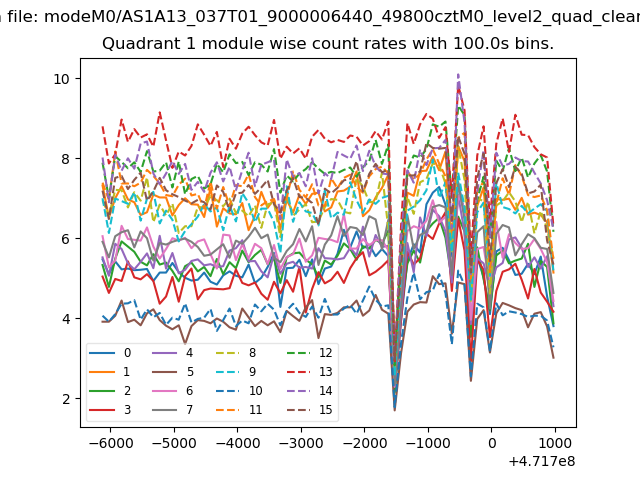
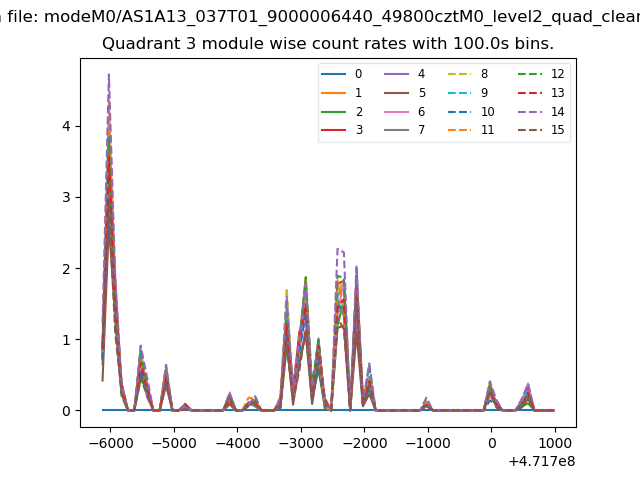
| Module-wise count rates for Quadrant A Data is divided into 100 sec bins |
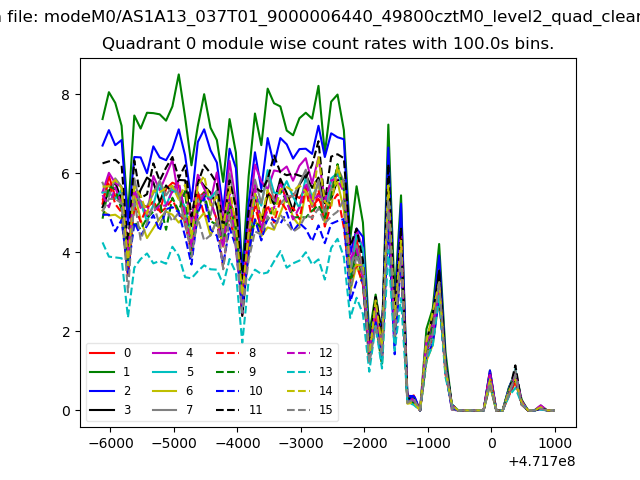 |
 |
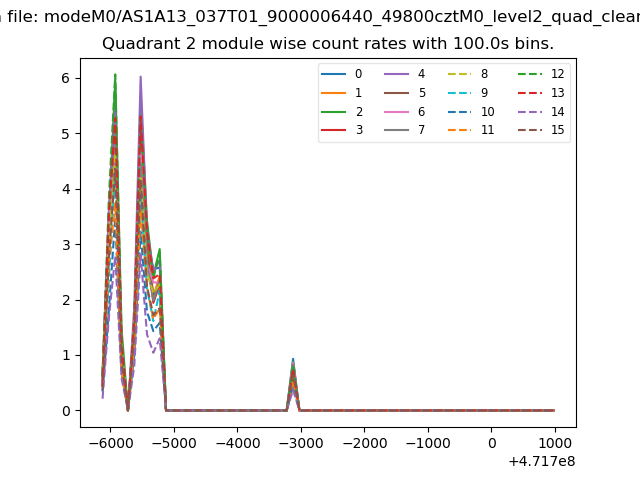
| Module-wise count rates for Quadrant B Data is divided into 100 sec bins |
 |
 |
| Module-wise count rates for Quadrant C Data is divided into 100 sec bins |
 |
 |
| Module-wise count rates for Quadrant D Data is divided into 100 sec bins |
 |
 |
| Parameter | Plot |
|---|---|
| CZT HV Monitor | 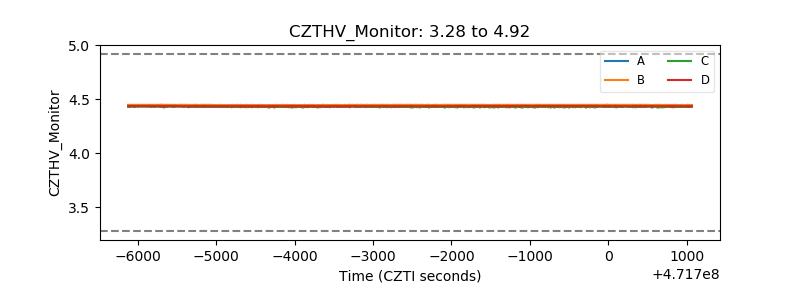 |
| D_VDD | 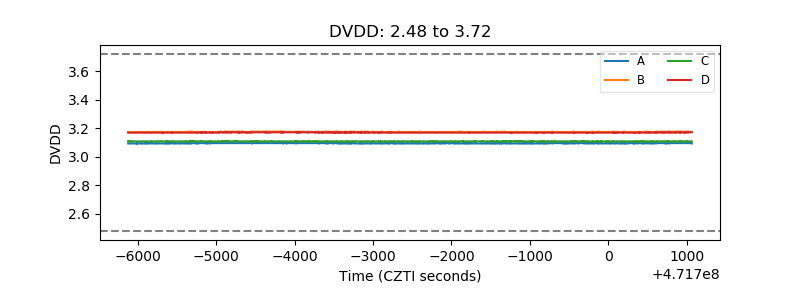 |
| Temperature 1 | 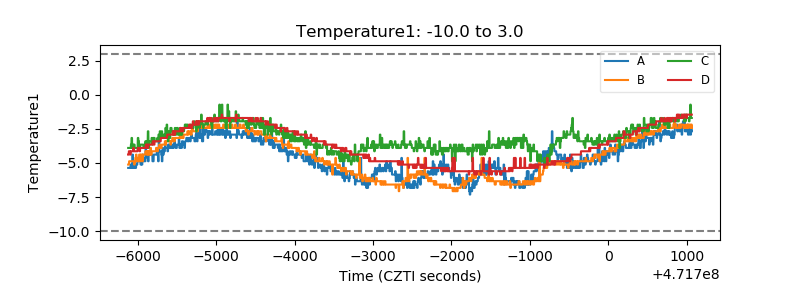 |
| Veto HV Monitor | 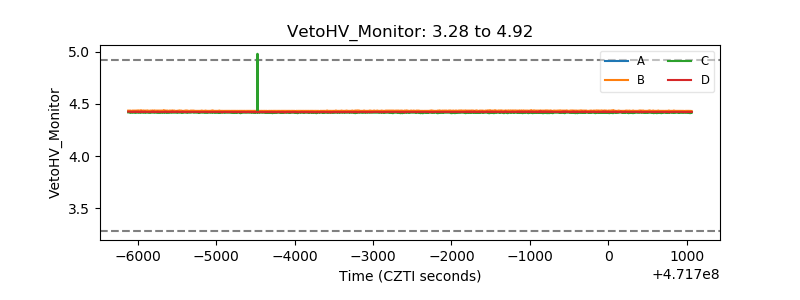 |
| Veto LLD | 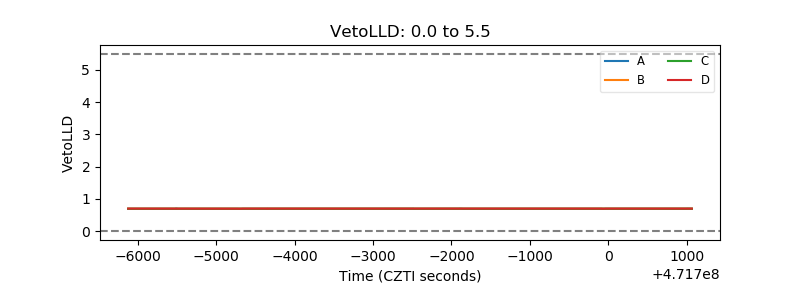 |
| Alpha Counter | 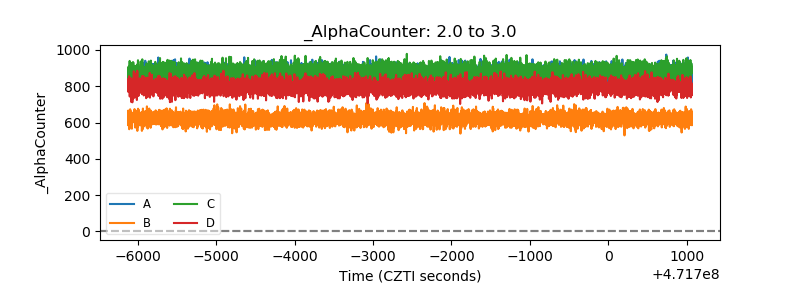 |
| _CPM_Rate | 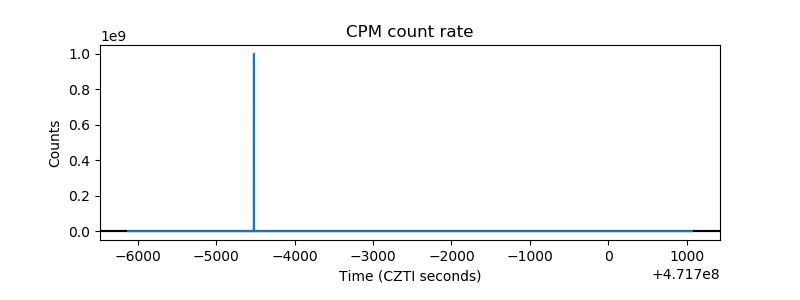 |
| CZT Counter | 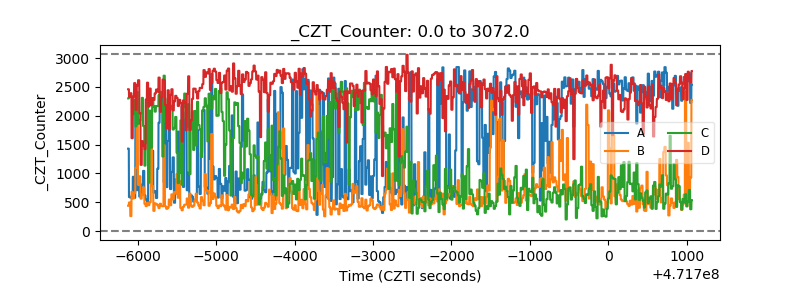 |
| +2.5 Volts monitor | 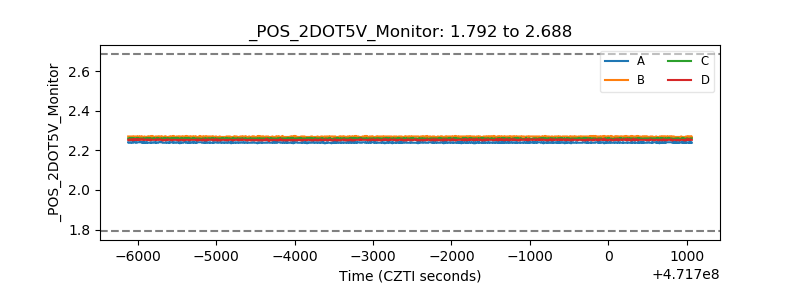 |
| +5 Volts monitor | 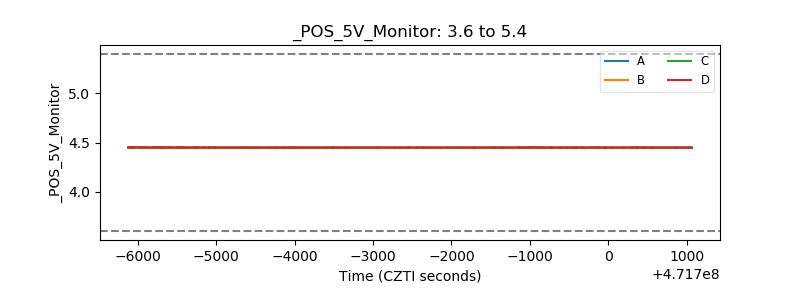 |
| _ROLL_ROT | 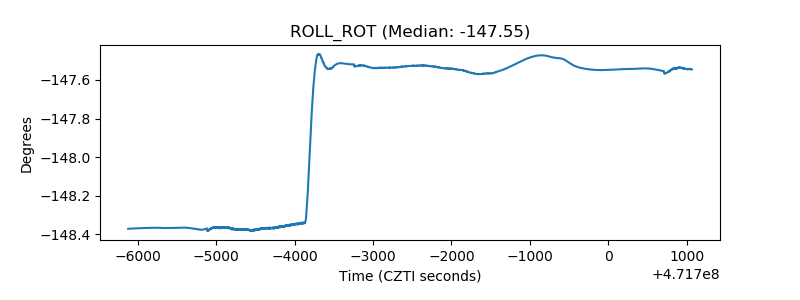 |
| _Roll_DEC | 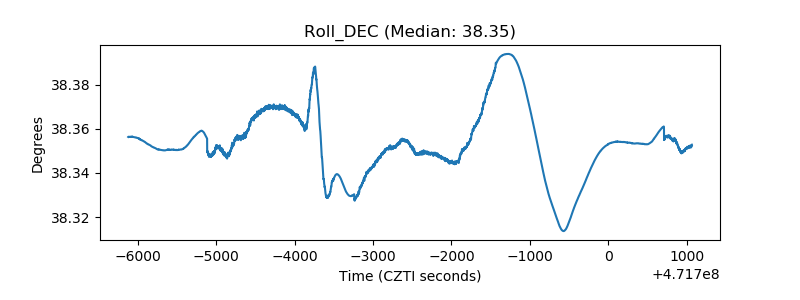 |
| _Roll_RA | 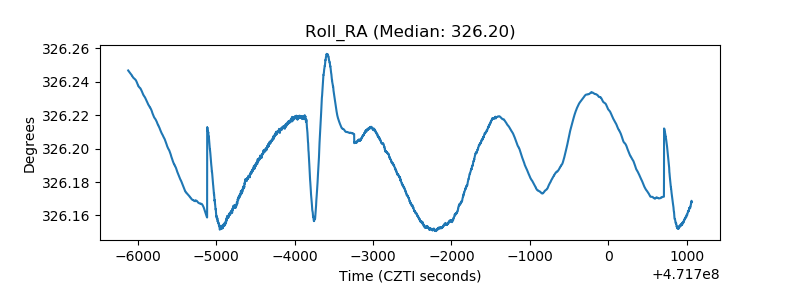 |
| Veto Counter | 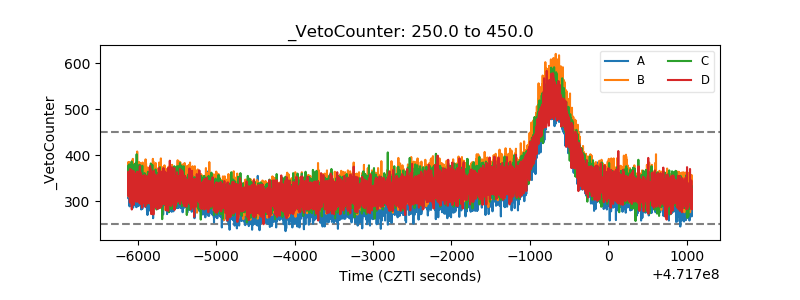 |