| Param | Original file | Final file |
|---|---|---|
| Filename | modeM0/AS1A13_037T01_9000006440_49801cztM0_level2.fits | modeM0/AS1A13_037T01_9000006440_49801cztM0_level2_quad_clean.evt |
| Size (bytes) | 1,226,632,320 | 56,021,760 |
| Size | 1.1 GB | 53.4 MB |
| Events in quadrant A | 16,067,435 | 336,982 |
| Events in quadrant B | 5,917,058 | 696,982 |
| Events in quadrant C | 5,154,182 | 1,762 |
| Events in quadrant D | 17,718,217 | 158,269 |
| Mode SS | |||
|---|---|---|---|
| Quadrant | BADHDUFLAG | Total packets | Discarded packets |
| A | 0 | 142 | 0 |
| B | 0 | 142 | 0 |
| C | 0 | 142 | 0 |
| D | 0 | 142 | 0 |
| Mode M0 | |||
|---|---|---|---|
| Quadrant | BADHDUFLAG | Total packets | Discarded packets |
| A | 0 | 52629 | 0 |
| B | 0 | 22467 | 0 |
| C | 0 | 20519 | 0 |
| D | 0 | 57412 | 0 |
| Quadrant | Total seconds | Saturated seconds | Saturation percentage |
|---|---|---|---|
| A | 7069 | 5467 | 77.337672% |
| B | 7070 | 614 | 8.684583% |
| C | 7070 | 7070 | 100.000000% |
| D | 7069 | 7057 | 99.830245% |
Noise dominated data is calculated using 1-second bins in cleaned event files. If a bin has >2000 counts, and if more than 50% of those come from <1% of pixels, then it is considered to be noise-dominated and hence unusable.
| Quadrant | # 1 sec bins | Bins with >0 counts | Bins with >2000 counts | High rate bins dominated by noise | Noise dominated (total time) | Noise dominated (detector-on time) | Marked lightcurve |
|---|---|---|---|---|---|---|---|
| A | 7068 | 7068 | 5252 | 5252 | 74.31% | 74.31% | 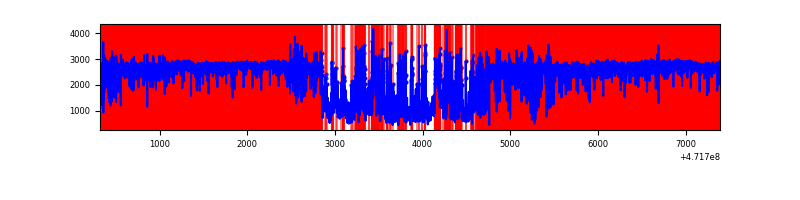 |
| B | 7070 | 7070 | 450 | 450 | 6.36% | 6.36% | 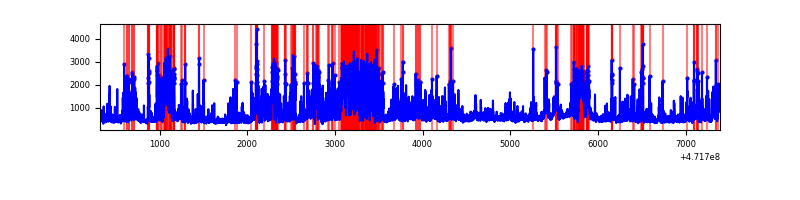 |
| C | 7069 | 7069 | 8 | 8 | 0.11% | 0.11% | 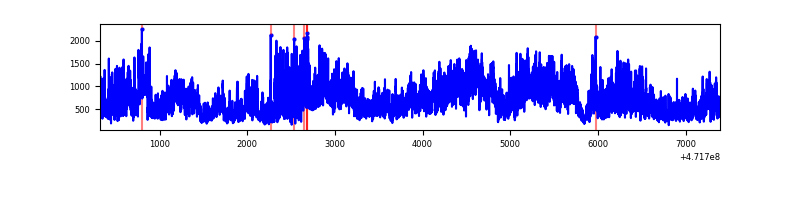 |
| D | 7068 | 7068 | 6846 | 6846 | 96.86% | 96.86% | 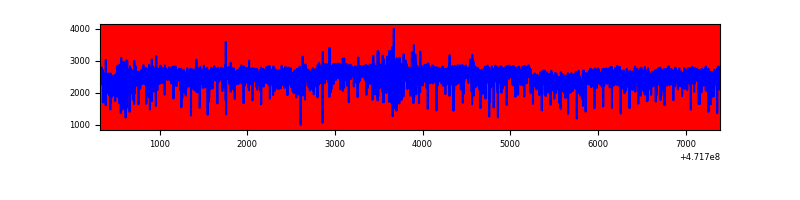 |
Top three noisy pixels from each quadrant. If the there are fewer than three noisy pixels in the level2.evt file, extra rows are filled as -1
| Pixel properties | Quadrant properties | ||||||
|---|---|---|---|---|---|---|---|
| Quadrant | DetID | PixID | Counts | Sigma | Mean | Median | Sigma |
| A | 0 | 98 | 9329878 | 81350.57 | 398 | 385 | 114.7 |
| A | 15 | 63 | 748054 | 6519.46 | 398 | 385 | 114.7 |
| A | 3 | 130 | 574731 | 5008.14 | 398 | 385 | 114.7 |
| B | 2 | 176 | 1335730 | 8575.74 | 726 | 704 | 155.7 |
| B | 10 | 28 | 396810 | 2544.45 | 726 | 704 | 155.7 |
| B | 10 | 44 | 281988 | 1806.87 | 726 | 704 | 155.7 |
| C | 15 | 147 | 3852996 | 431420.92 | 9 | 9 | 8.9 |
| C | 15 | 197 | 230228 | 25777.74 | 9 | 9 | 8.9 |
| C | 15 | 174 | 195199 | 21855.52 | 9 | 9 | 8.9 |
| D | 15 | 168 | 4595061 | 61602.35 | 214 | 204 | 74.6 |
| D | 7 | 61 | 2186802 | 29315.29 | 214 | 204 | 74.6 |
| D | 7 | 126 | 1149537 | 15408.88 | 214 | 204 | 74.6 |
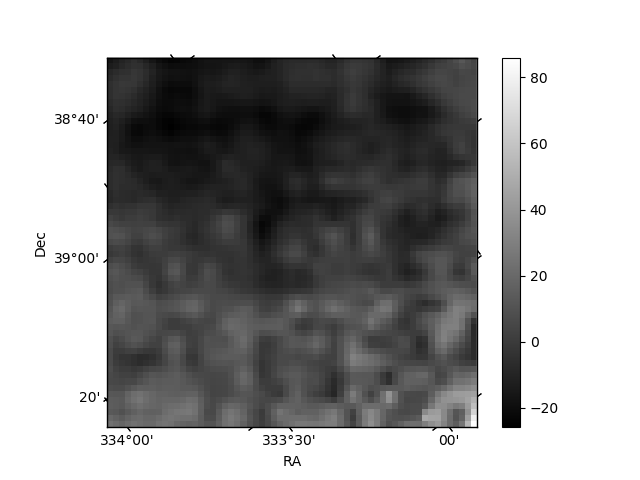
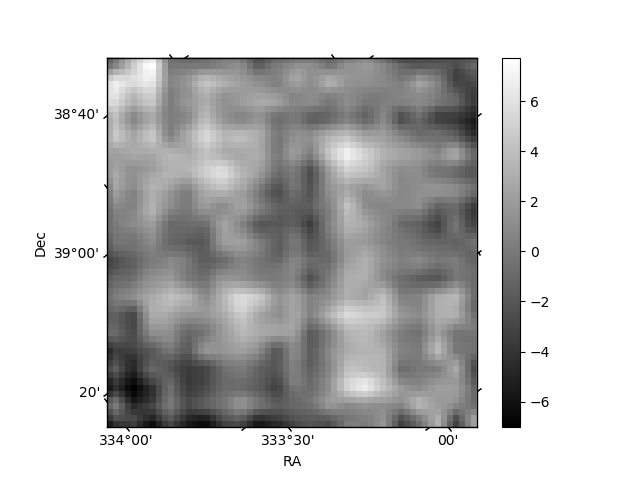
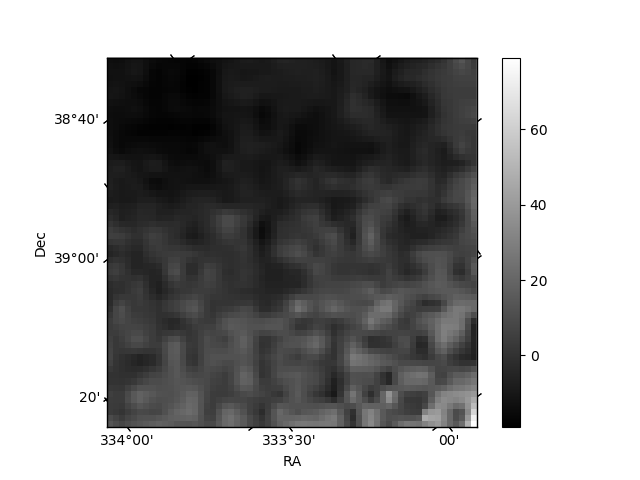
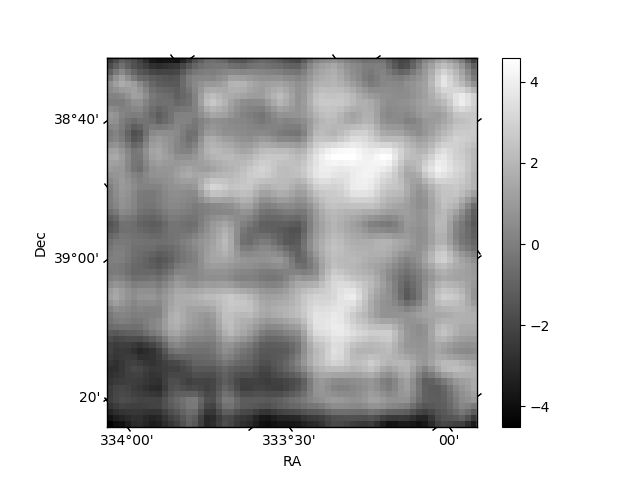
Histogram calculated using DETX and DETY for each event in the final _common_clean file
| Quadrant A | 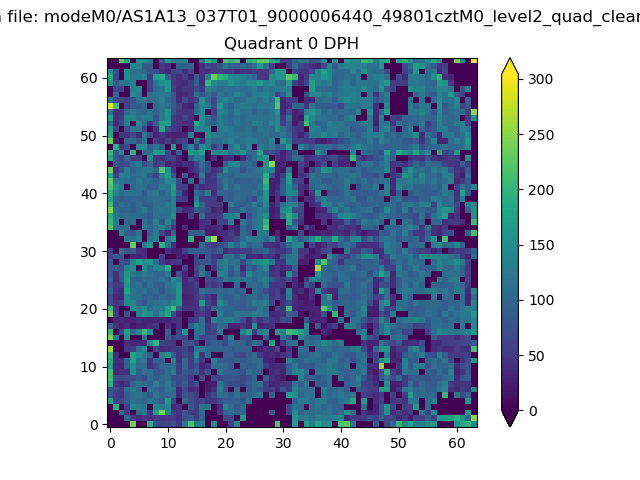 |
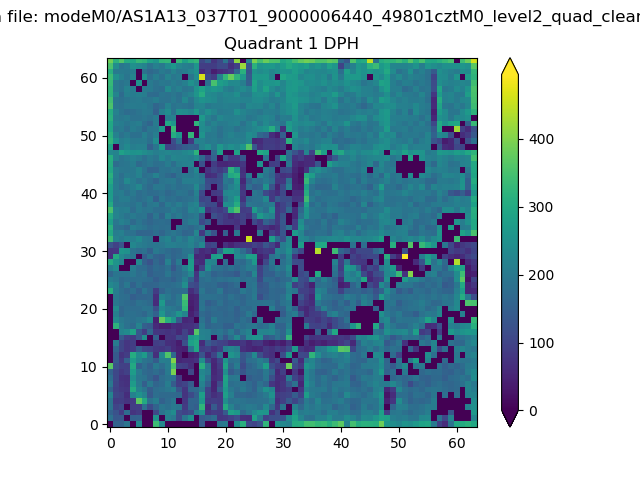 |
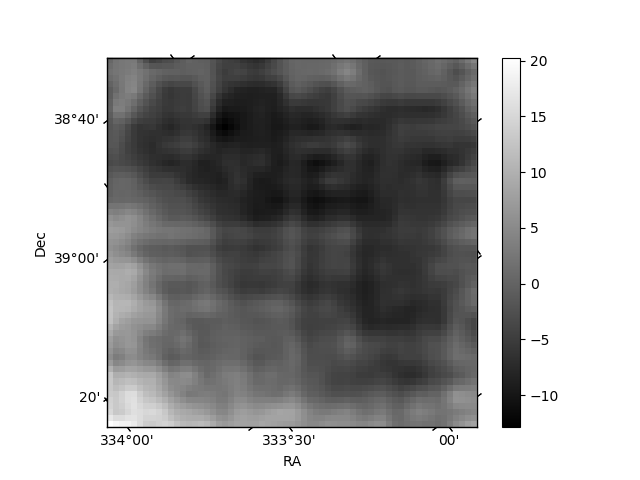
Quadrant B |
|---|---|---|---|
| Quadrant D | 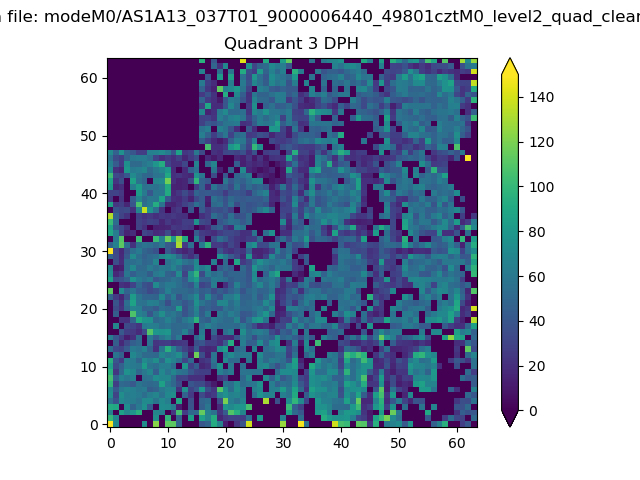 |
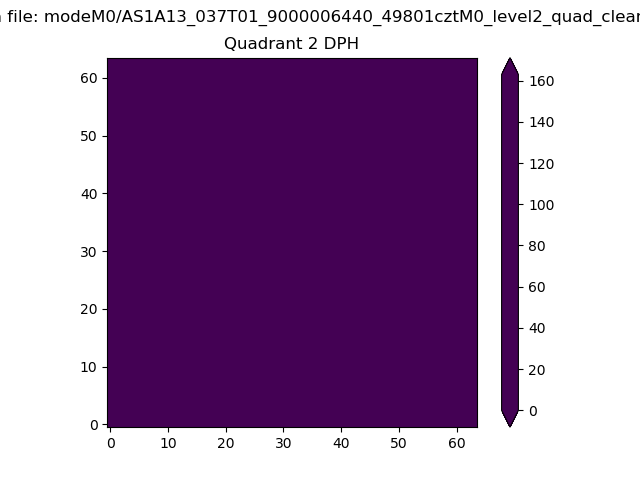 |
Quadrant C |
| Plot type | Count rate plots | Images |
|---|---|---|
| Comparison with Poisson distribution Blue bars denote a histogram of data divided into 1 sec bins. Red curve is a Poisson curve with rate = median count rate of data. |
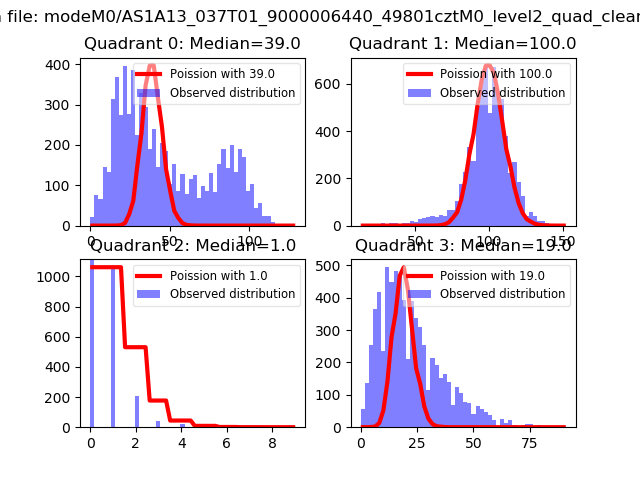 |
 |
| Quadrant-wise count rates Data is divided into 100 sec bins |
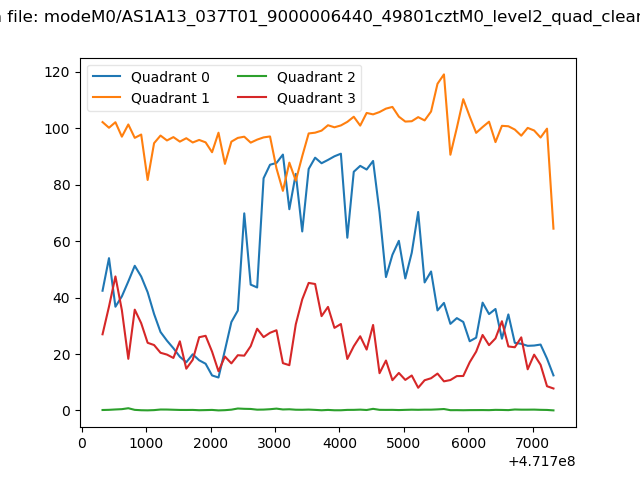 |
|
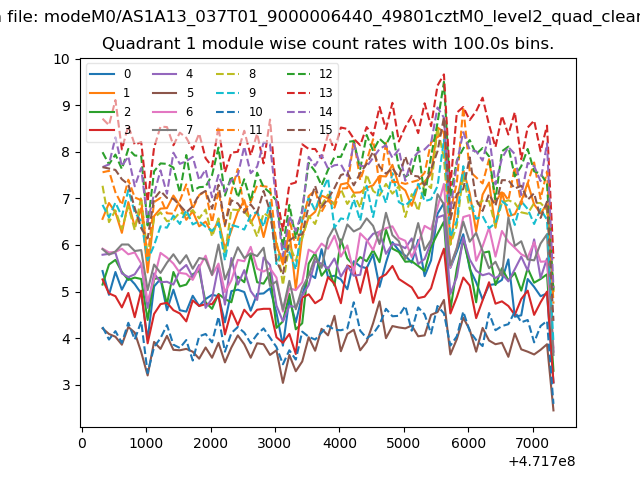
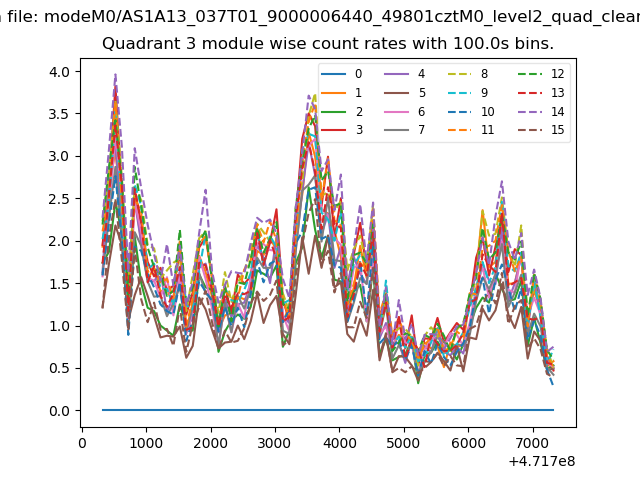
| Module-wise count rates for Quadrant A Data is divided into 100 sec bins |
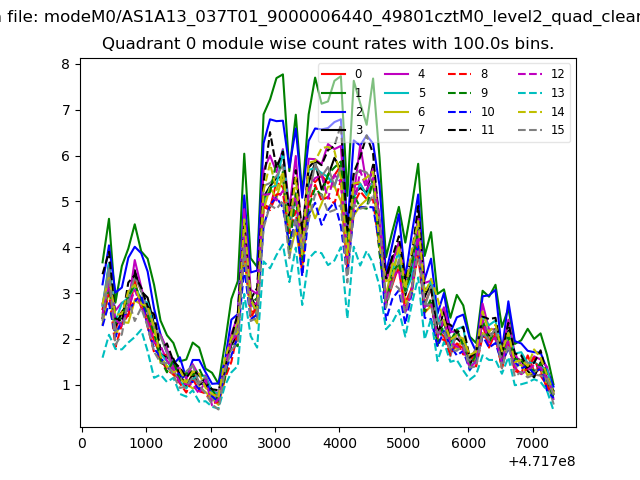 |
 |
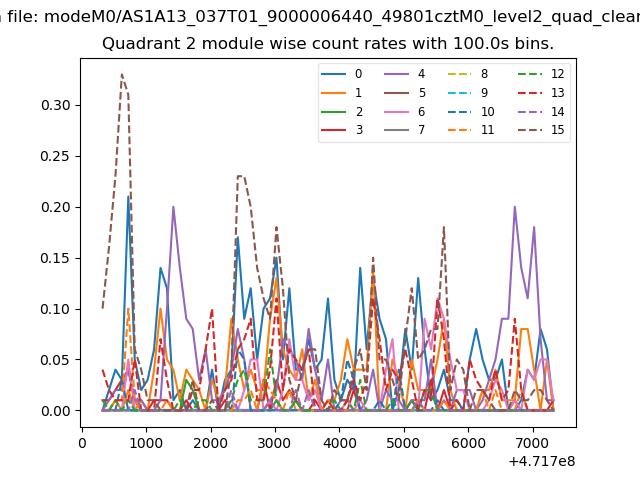
| Module-wise count rates for Quadrant B Data is divided into 100 sec bins |
 |
 |
| Module-wise count rates for Quadrant C Data is divided into 100 sec bins |
 |
 |
| Module-wise count rates for Quadrant D Data is divided into 100 sec bins |
 |
 |
| Parameter | Plot |
|---|---|
| CZT HV Monitor | 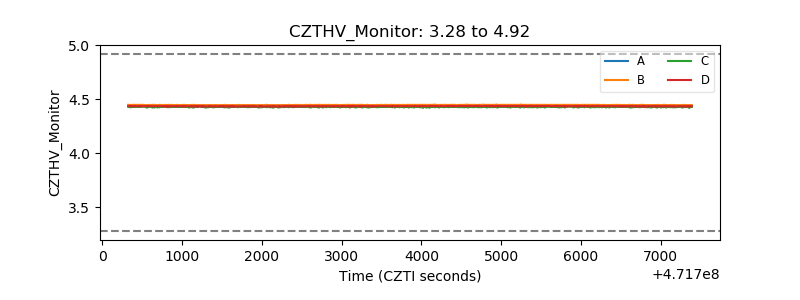 |
| D_VDD | 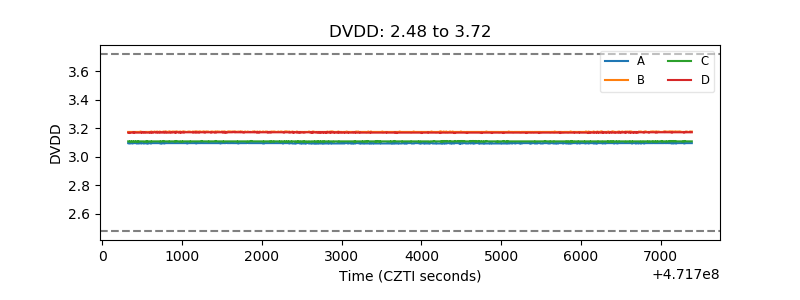 |
| Temperature 1 | 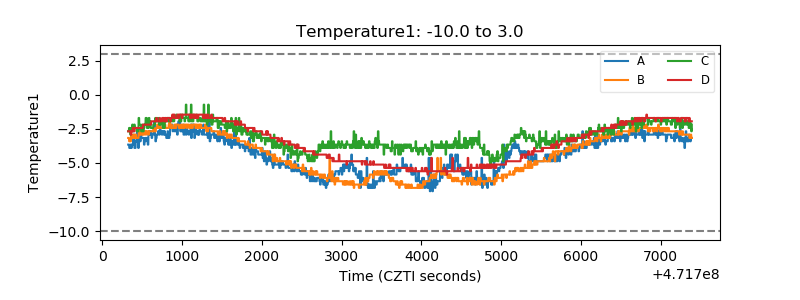 |
| Veto HV Monitor | 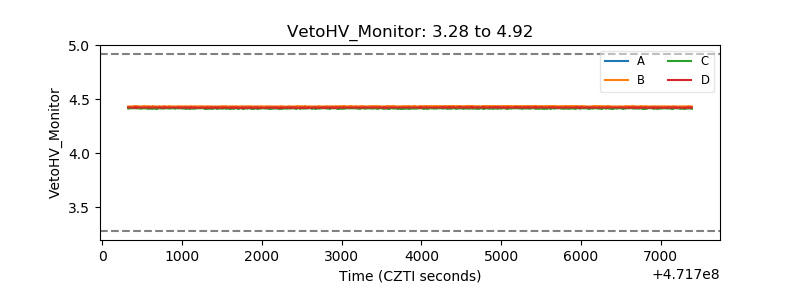 |
| Veto LLD | 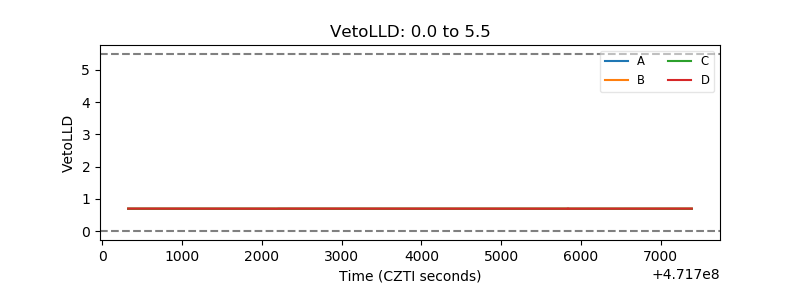 |
| Alpha Counter | 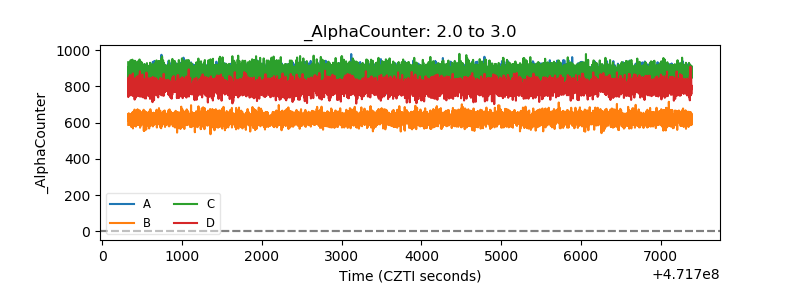 |
| _CPM_Rate | 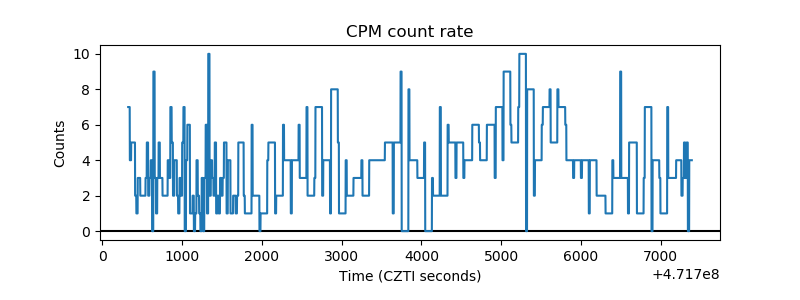 |
| CZT Counter | 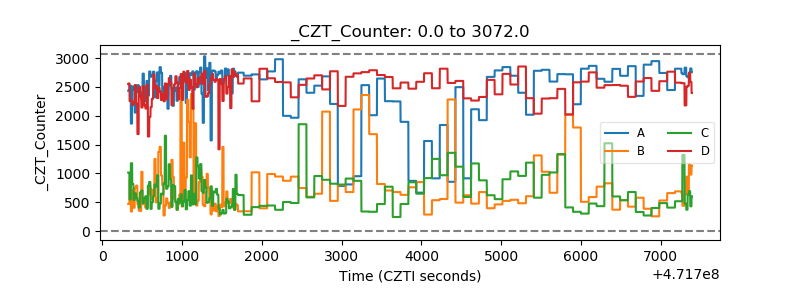 |
| +2.5 Volts monitor |  |
| +5 Volts monitor | 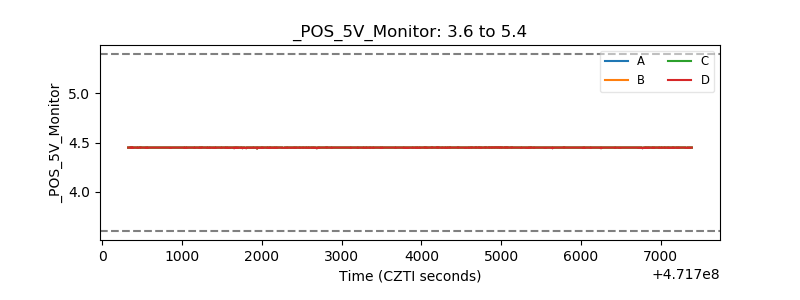 |
| _ROLL_ROT | 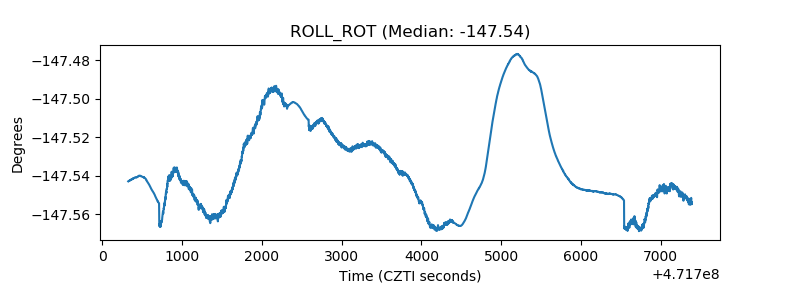 |
| _Roll_DEC | 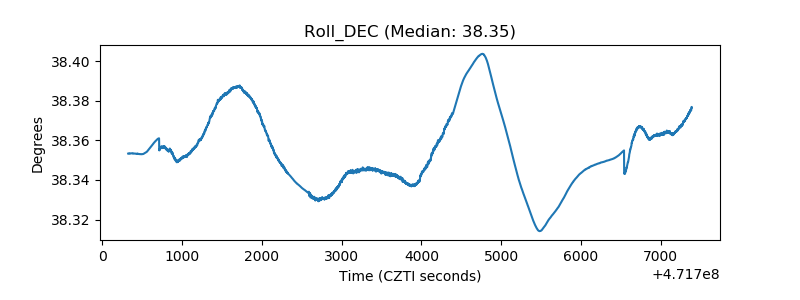 |
| _Roll_RA | 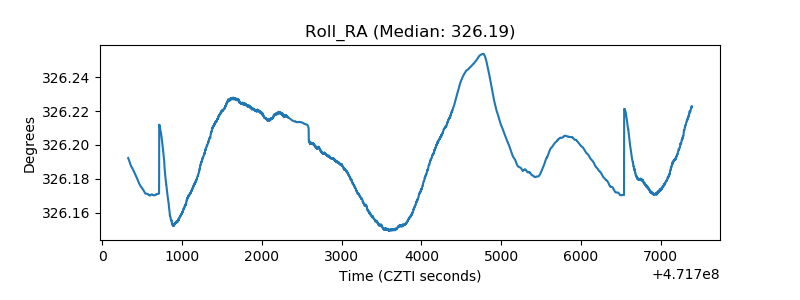 |
| Veto Counter | 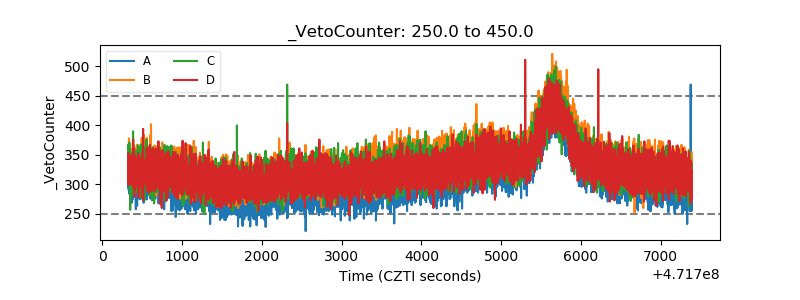 |