| Param | Original file | Final file |
|---|---|---|
| Filename | modeM0/AS1A13_037T01_9000006440_49802cztM0_level2.fits | modeM0/AS1A13_037T01_9000006440_49802cztM0_level2_quad_clean.evt |
| Size (bytes) | 1,271,082,240 | 53,507,520 |
| Size | 1.2 GB | 51.0 MB |
| Events in quadrant A | 18,242,173 | 256,693 |
| Events in quadrant B | 5,084,625 | 712,538 |
| Events in quadrant C | 5,586,210 | 2,187 |
| Events in quadrant D | 17,582,224 | 139,935 |
| Mode SS | |||
|---|---|---|---|
| Quadrant | BADHDUFLAG | Total packets | Discarded packets |
| A | 0 | 142 | 0 |
| B | 0 | 142 | 0 |
| C | 0 | 142 | 0 |
| D | 0 | 142 | 0 |
| Mode M0 | |||
|---|---|---|---|
| Quadrant | BADHDUFLAG | Total packets | Discarded packets |
| A | 0 | 59149 | 0 |
| B | 0 | 20016 | 0 |
| C | 0 | 21811 | 0 |
| D | 0 | 56997 | 0 |
| Quadrant | Total seconds | Saturated seconds | Saturation percentage |
|---|---|---|---|
| A | 7161 | 6702 | 93.590281% |
| B | 7161 | 347 | 4.845692% |
| C | 7161 | 7161 | 100.000000% |
| D | 7161 | 7136 | 99.650887% |
Noise dominated data is calculated using 1-second bins in cleaned event files. If a bin has >2000 counts, and if more than 50% of those come from <1% of pixels, then it is considered to be noise-dominated and hence unusable.
| Quadrant | # 1 sec bins | Bins with >0 counts | Bins with >2000 counts | High rate bins dominated by noise | Noise dominated (total time) | Noise dominated (detector-on time) | Marked lightcurve |
|---|---|---|---|---|---|---|---|
| A | 7160 | 7160 | 6549 | 6549 | 91.47% | 91.47% | 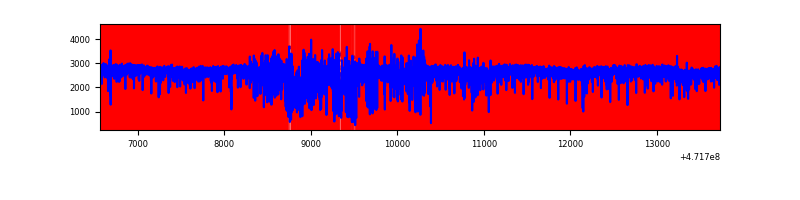 |
| B | 7161 | 7161 | 275 | 275 | 3.84% | 3.84% | 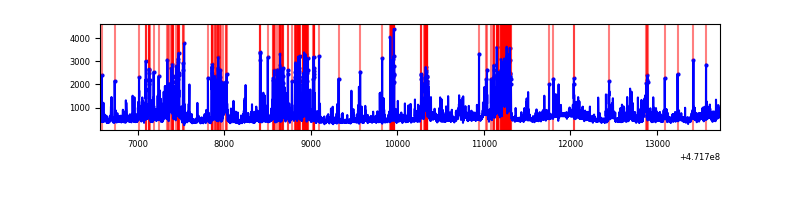 |
| C | 7160 | 7160 | 11 | 11 | 0.15% | 0.15% | 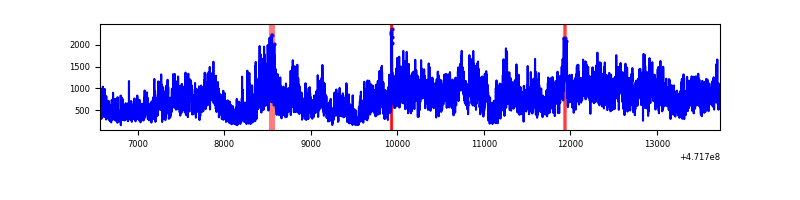 |
| D | 7160 | 7160 | 6775 | 6775 | 94.62% | 94.62% | 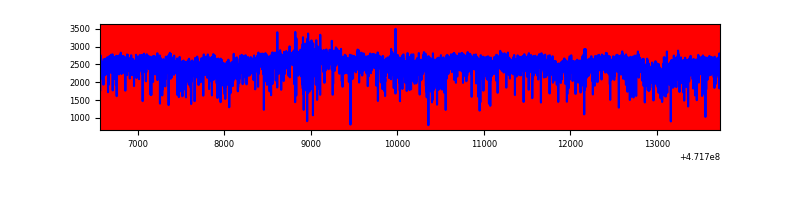 |
Top three noisy pixels from each quadrant. If the there are fewer than three noisy pixels in the level2.evt file, extra rows are filled as -1
| Pixel properties | Quadrant properties | ||||||
|---|---|---|---|---|---|---|---|
| Quadrant | DetID | PixID | Counts | Sigma | Mean | Median | Sigma |
| A | 0 | 98 | 10930025 | 99379.07 | 311 | 297 | 110.0 |
| A | 4 | 204 | 1008600 | 9168.04 | 311 | 297 | 110.0 |
| A | 12 | 50 | 974002 | 8853.46 | 311 | 297 | 110.0 |
| B | 1 | 255 | 409830 | 2586.98 | 743 | 720 | 158.1 |
| B | 1 | 239 | 351778 | 2219.89 | 743 | 720 | 158.1 |
| B | 2 | 176 | 326865 | 2062.35 | 743 | 720 | 158.1 |
| C | 15 | 147 | 4562611 | 602583.73 | 8 | 7 | 7.6 |
| C | 15 | 174 | 178264 | 23542.43 | 8 | 7 | 7.6 |
| C | 15 | 197 | 175291 | 23149.78 | 8 | 7 | 7.6 |
| D | 15 | 168 | 4951184 | 60365.3 | 197 | 186 | 82.0 |
| D | 7 | 61 | 2441751 | 29768.91 | 197 | 186 | 82.0 |
| D | 7 | 126 | 1669726 | 20355.95 | 197 | 186 | 82.0 |
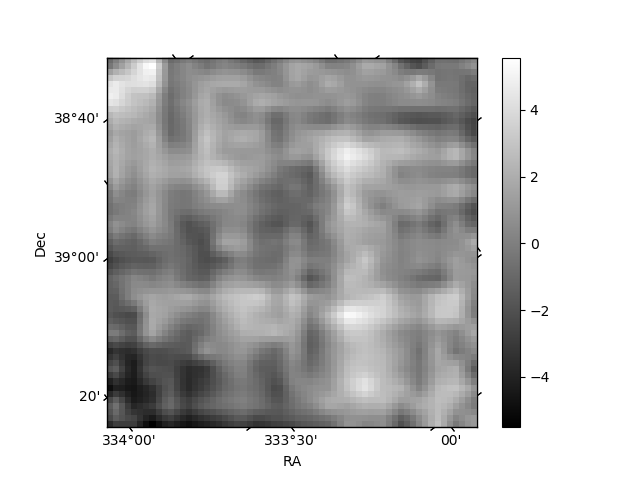
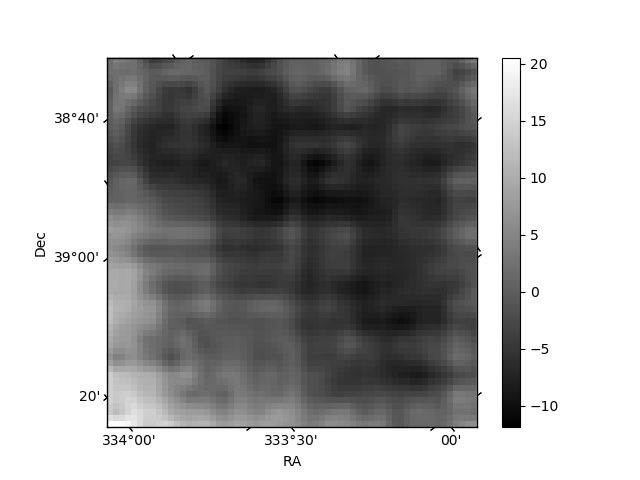
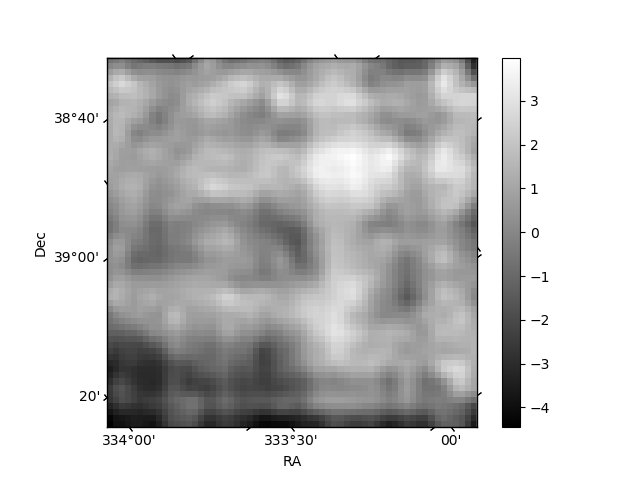
Histogram calculated using DETX and DETY for each event in the final _common_clean file
| Quadrant A | 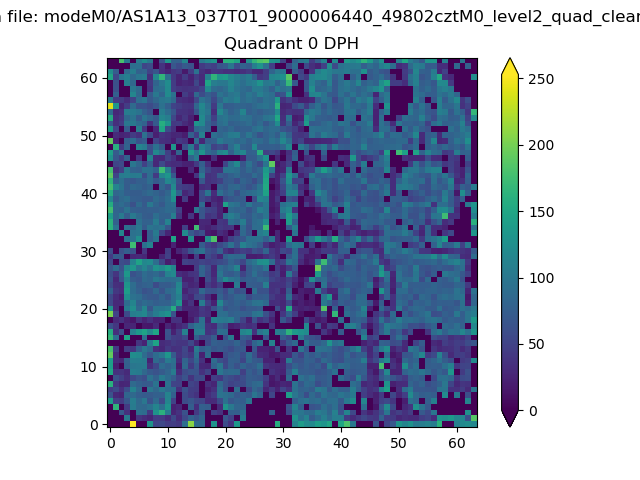 |
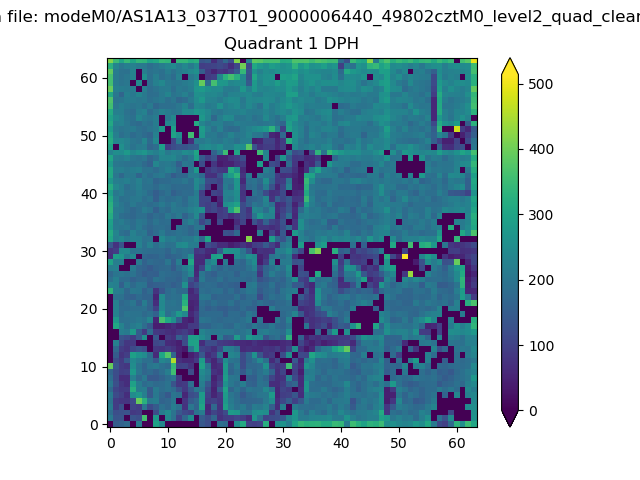 |
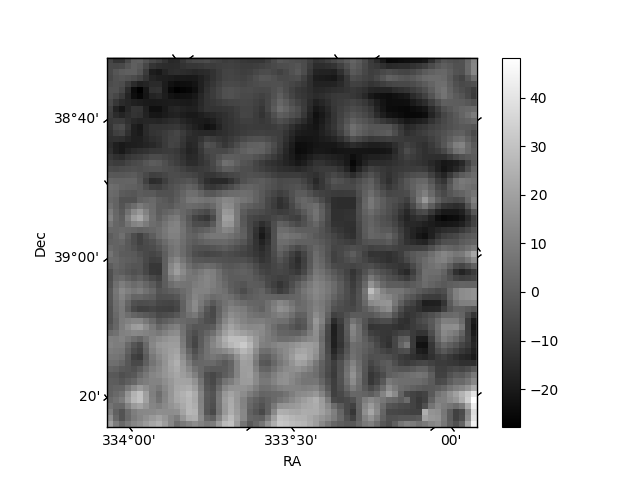
Quadrant B |
|---|---|---|---|
| Quadrant D | 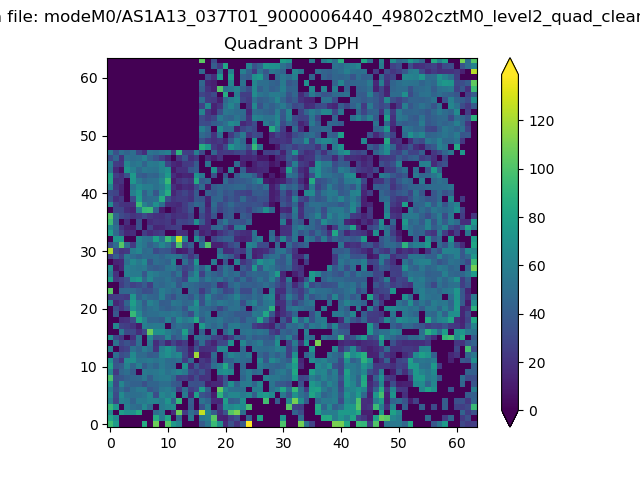 |
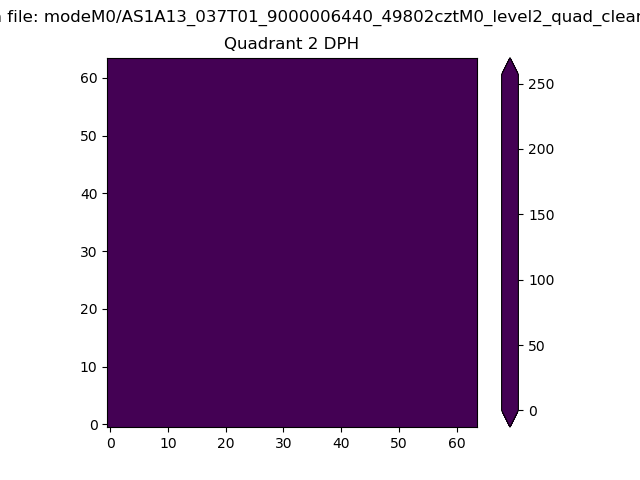 |
Quadrant C |
| Plot type | Count rate plots | Images |
|---|---|---|
| Comparison with Poisson distribution Blue bars denote a histogram of data divided into 1 sec bins. Red curve is a Poisson curve with rate = median count rate of data. |
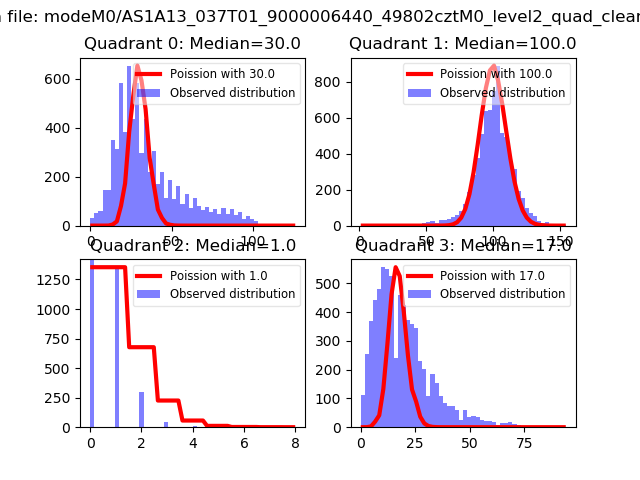 |
 |
| Quadrant-wise count rates Data is divided into 100 sec bins |
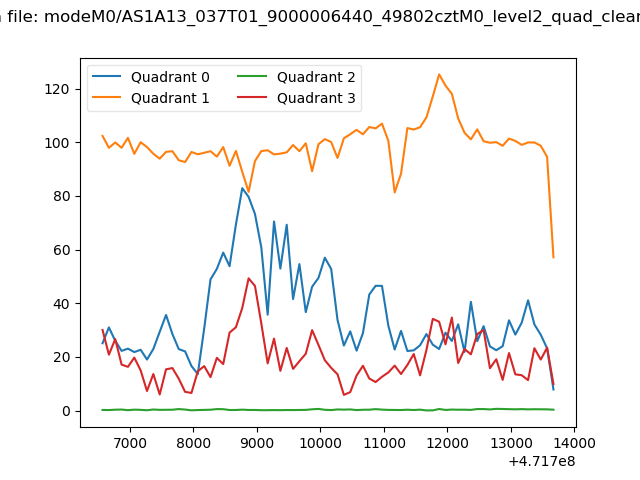 |
|
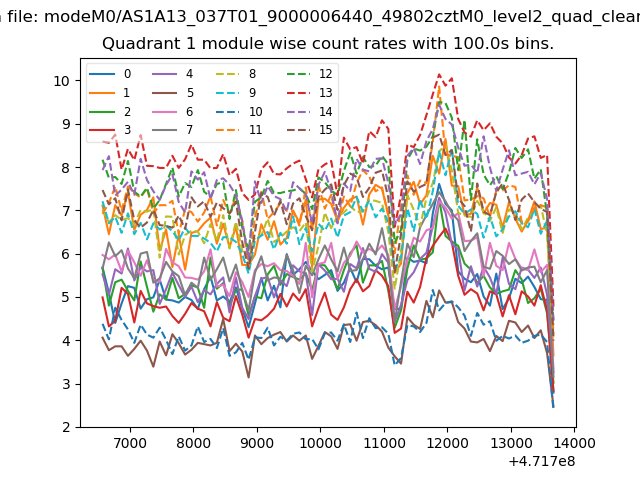
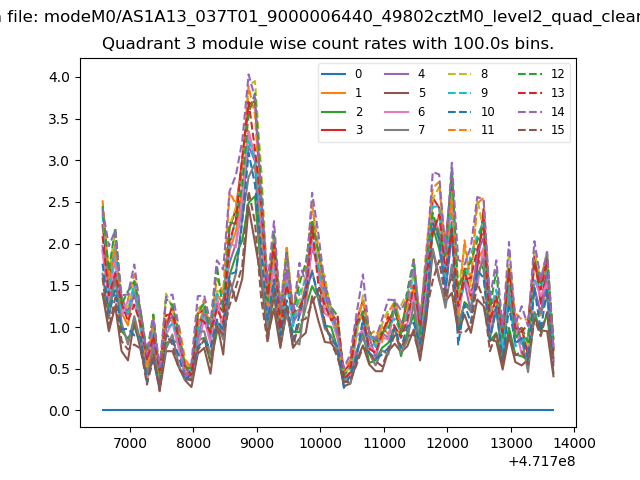
| Module-wise count rates for Quadrant A Data is divided into 100 sec bins |
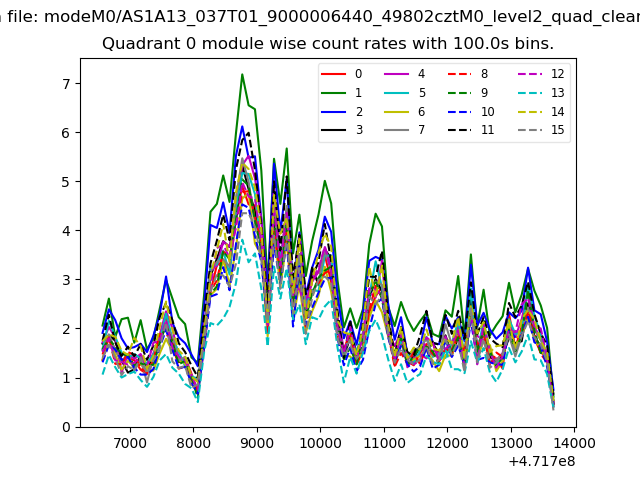 |
 |
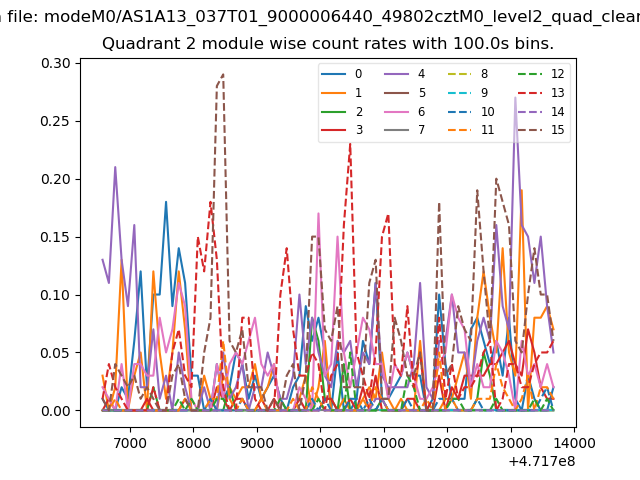
| Module-wise count rates for Quadrant B Data is divided into 100 sec bins |
 |
 |
| Module-wise count rates for Quadrant C Data is divided into 100 sec bins |
 |
 |
| Module-wise count rates for Quadrant D Data is divided into 100 sec bins |
 |
 |
| Parameter | Plot |
|---|---|
| CZT HV Monitor | 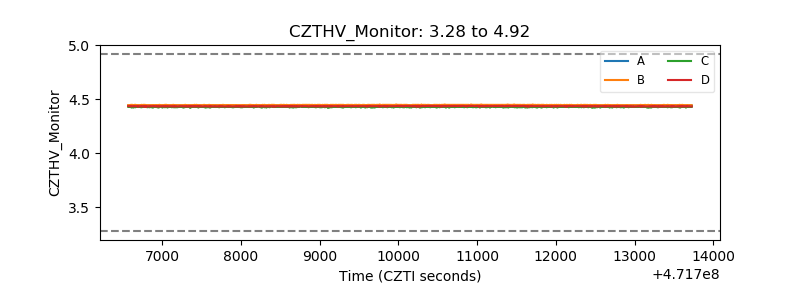 |
| D_VDD | 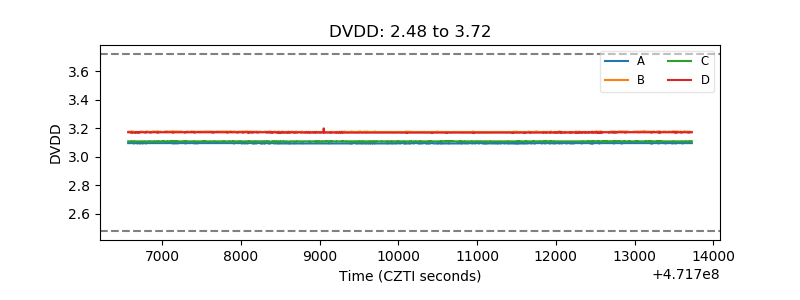 |
| Temperature 1 | 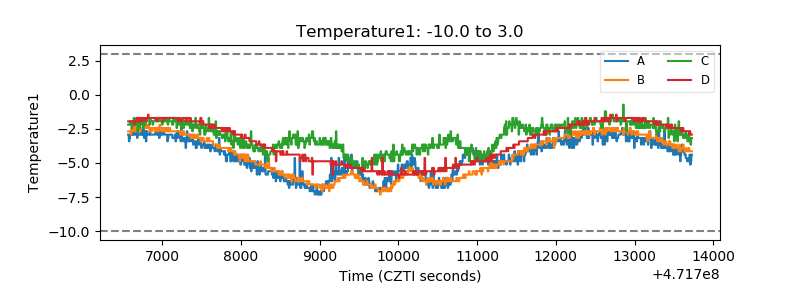 |
| Veto HV Monitor | 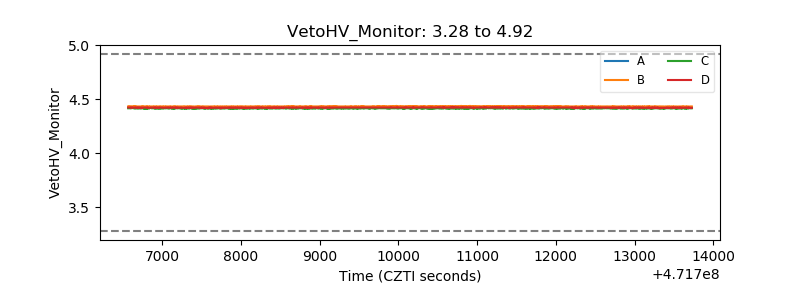 |
| Veto LLD | 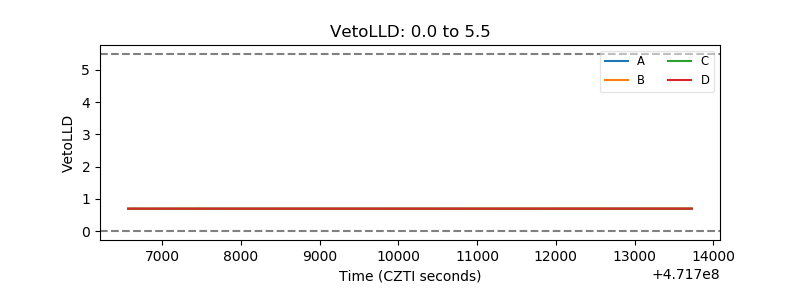 |
| Alpha Counter | 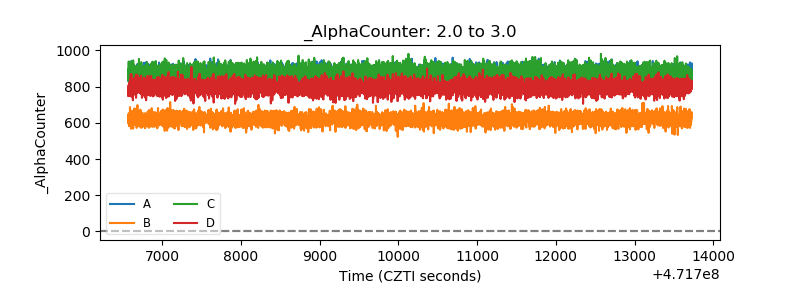 |
| _CPM_Rate | 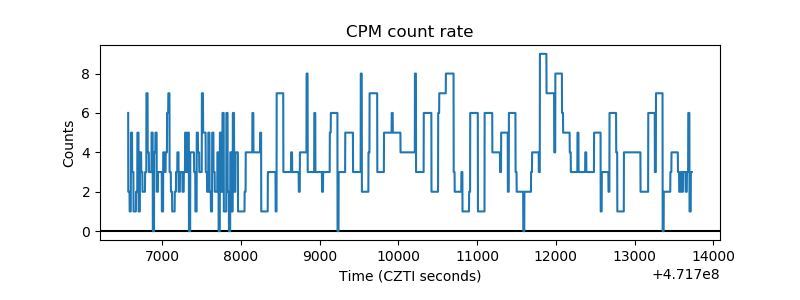 |
| CZT Counter | 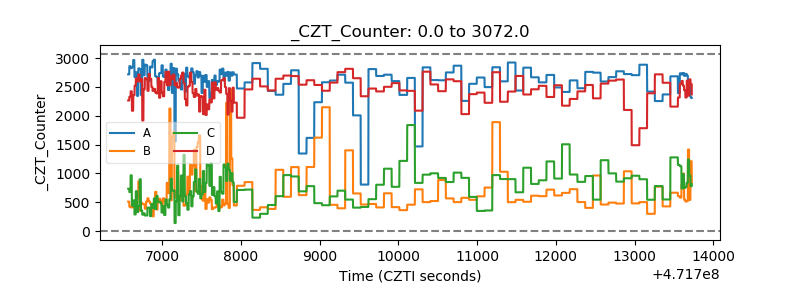 |
| +2.5 Volts monitor | 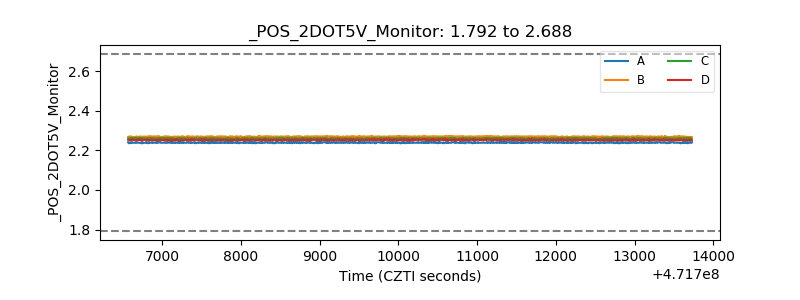 |
| +5 Volts monitor |  |
| _ROLL_ROT | 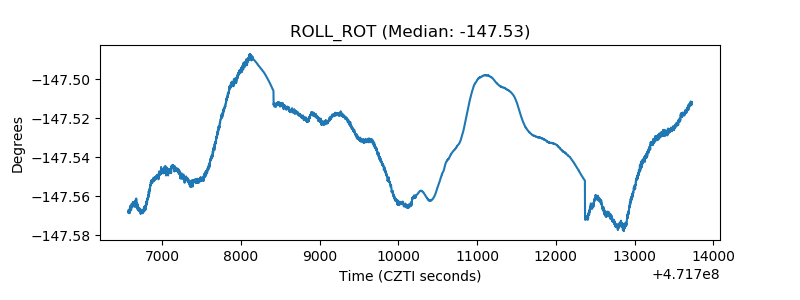 |
| _Roll_DEC | 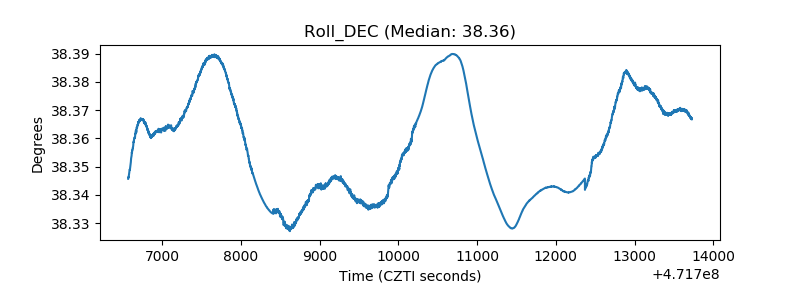 |
| _Roll_RA | 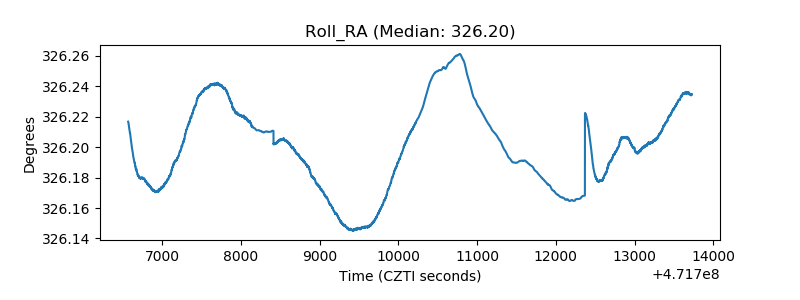 |
| Veto Counter | 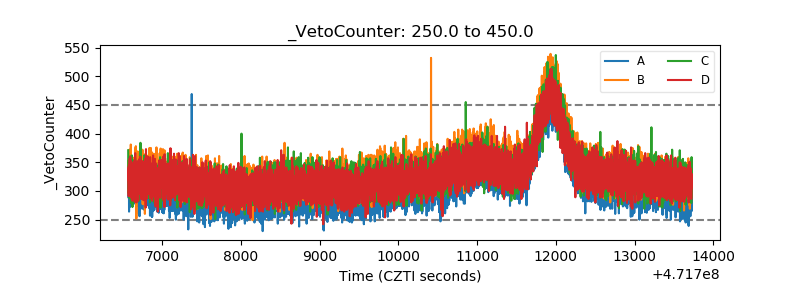 |