| Param | Original file | Final file |
|---|---|---|
| Filename | modeM0/AS1A13_037T01_9000006440_49805cztM0_level2.fits | modeM0/AS1A13_037T01_9000006440_49805cztM0_level2_quad_clean.evt |
| Size (bytes) | 3,010,343,040 | 148,605,120 |
| Size | 2.8 GB | 141.7 MB |
| Events in quadrant A | 24,946,625 | 1,219,905 |
| Events in quadrant B | 12,542,650 | 1,798,703 |
| Events in quadrant C | 28,877,166 | 64,934 |
| Events in quadrant D | 43,637,389 | 138,425 |
| Mode M9 | |||
|---|---|---|---|
| Quadrant | BADHDUFLAG | Total packets | Discarded packets |
| A | 0 | 13 | 0 |
| B | 0 | 13 | 0 |
| C | 0 | 13 | 0 |
| D | 0 | 13 | 0 |
| Mode SS | |||
|---|---|---|---|
| Quadrant | BADHDUFLAG | Total packets | Discarded packets |
| A | 0 | 376 | 0 |
| B | 0 | 376 | 0 |
| C | 0 | 376 | 0 |
| D | 0 | 376 | 0 |
| Mode M0 | |||
|---|---|---|---|
| Quadrant | BADHDUFLAG | Total packets | Discarded packets |
| A | 0 | 86936 | 3 |
| B | 0 | 49710 | 3 |
| C | 0 | 98832 | 3 |
| D | 0 | 142156 | 3 |
| Quadrant | Total seconds | Saturated seconds | Saturation percentage |
|---|---|---|---|
| A | 18517 | 5343 | 28.854566% |
| B | 18517 | 715 | 3.861317% |
| C | 18518 | 17943 | 96.894913% |
| D | 18518 | 17218 | 92.979803% |
Noise dominated data is calculated using 1-second bins in cleaned event files. If a bin has >2000 counts, and if more than 50% of those come from <1% of pixels, then it is considered to be noise-dominated and hence unusable.
| Quadrant | # 1 sec bins | Bins with >0 counts | Bins with >2000 counts | High rate bins dominated by noise | Noise dominated (total time) | Noise dominated (detector-on time) | Marked lightcurve |
|---|---|---|---|---|---|---|---|
| A | 19777 | 18519 | 4871 | 4871 | 24.63% | 26.30% | 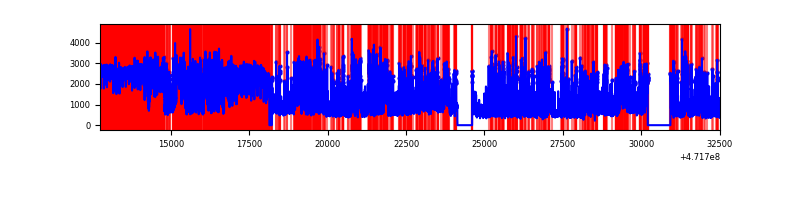 |
| B | 19777 | 18521 | 387 | 387 | 1.96% | 2.09% | 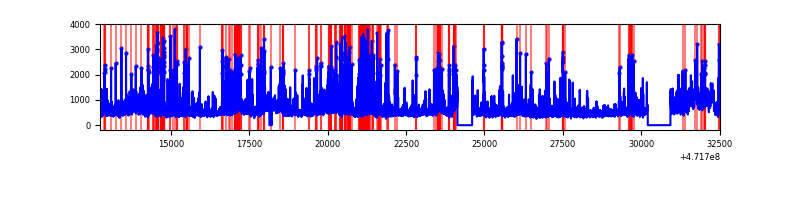 |
| C | 19777 | 18517 | 6341 | 6341 | 32.06% | 34.24% | 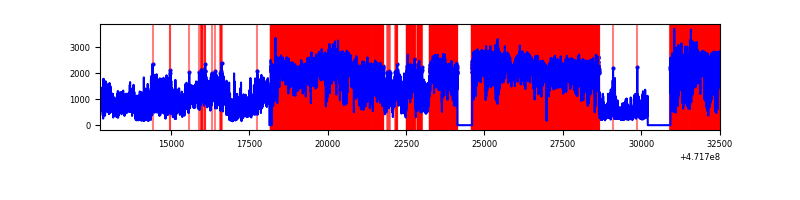 |
| D | 19777 | 18517 | 15777 | 15777 | 79.77% | 85.20% | 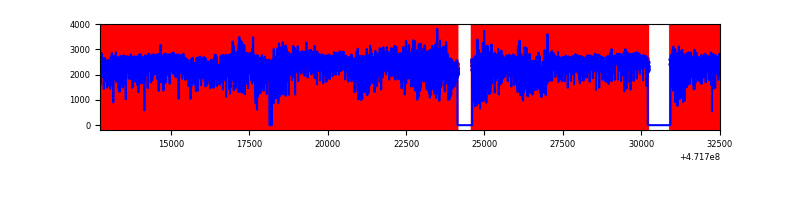 |
Top three noisy pixels from each quadrant. If the there are fewer than three noisy pixels in the level2.evt file, extra rows are filled as -1
| Pixel properties | Quadrant properties | ||||||
|---|---|---|---|---|---|---|---|
| Quadrant | DetID | PixID | Counts | Sigma | Mean | Median | Sigma |
| A | 0 | 98 | 4337571 | 9917.16 | 1723 | 1677 | 437.2 |
| A | 4 | 204 | 3135010 | 7166.63 | 1723 | 1677 | 437.2 |
| A | 15 | 63 | 2417147 | 5524.72 | 1723 | 1677 | 437.2 |
| B | 2 | 176 | 677876 | 1644.55 | 1952 | 1889 | 411.0 |
| B | 5 | 172 | 660364 | 1601.95 | 1952 | 1889 | 411.0 |
| B | 5 | 185 | 647883 | 1571.58 | 1952 | 1889 | 411.0 |
| C | 15 | 147 | 13302745 | 89629.93 | 321 | 306 | 148.4 |
| C | 15 | 197 | 3539449 | 23846.24 | 321 | 306 | 148.4 |
| C | 15 | 230 | 2645304 | 17821.62 | 321 | 306 | 148.4 |
| D | 7 | 61 | 8077692 | 28318.25 | 865 | 830 | 285.2 |
| D | 15 | 168 | 5262184 | 18446.81 | 865 | 830 | 285.2 |
| D | 15 | 106 | 3392232 | 11890.58 | 865 | 830 | 285.2 |
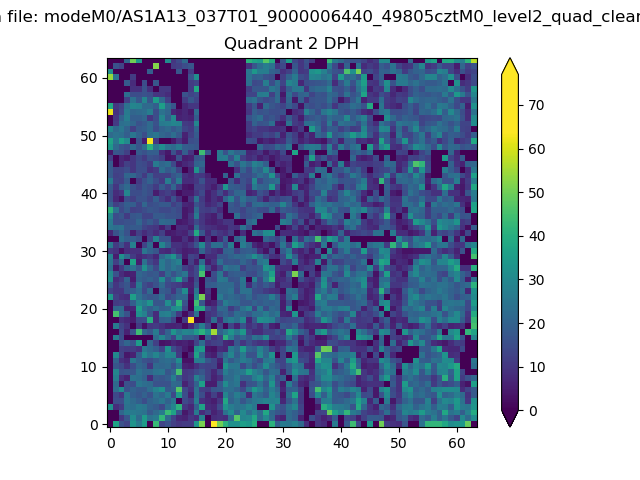
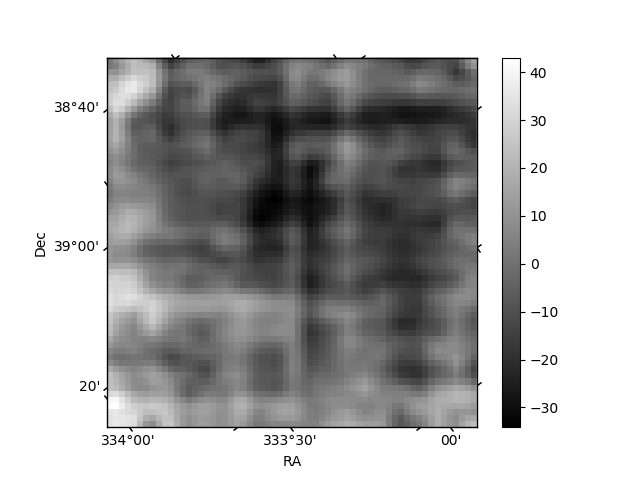
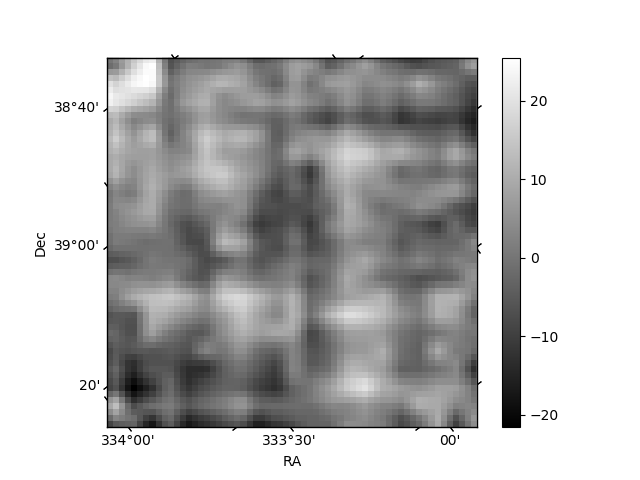
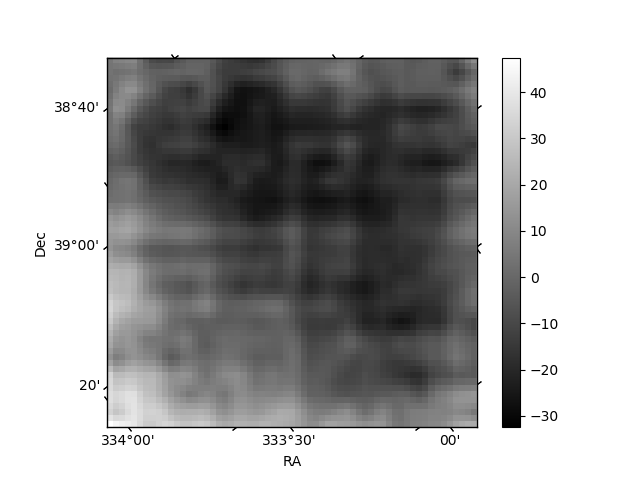
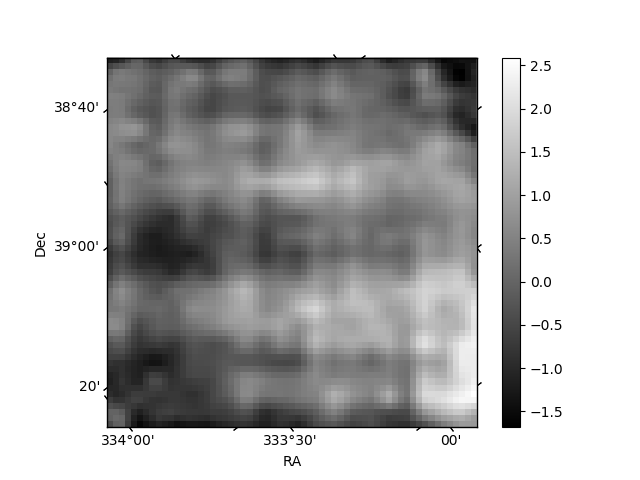
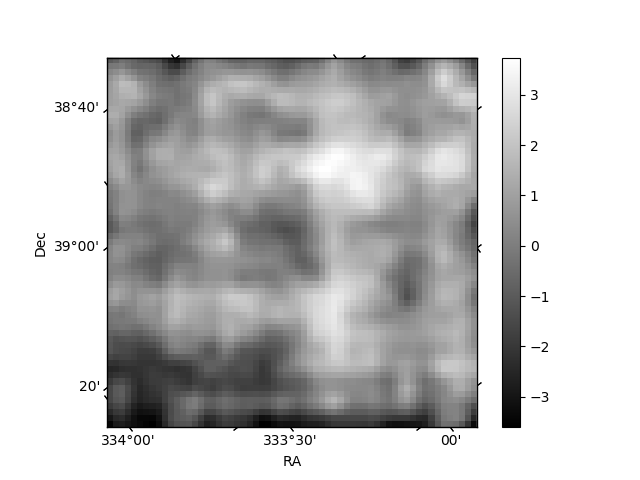
Histogram calculated using DETX and DETY for each event in the final _common_clean file
| Quadrant A | 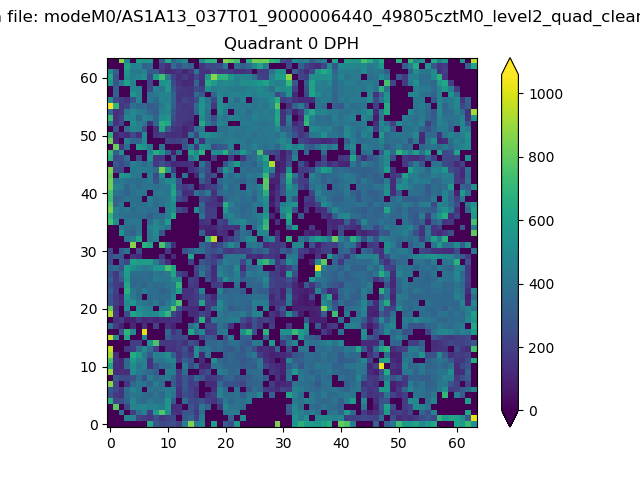 |
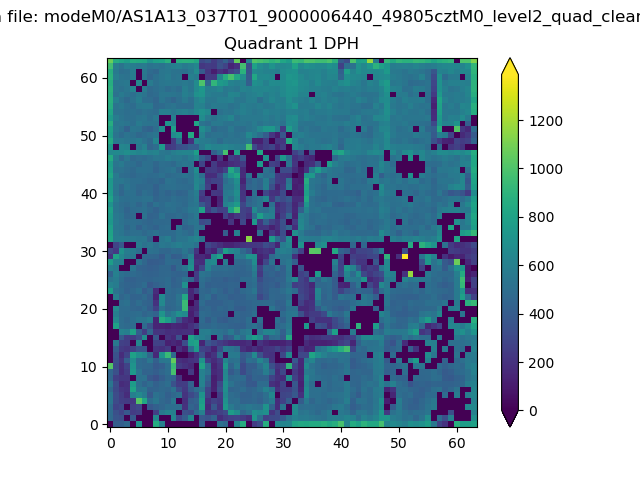 |
Quadrant B |
|---|---|---|---|
| Quadrant D | 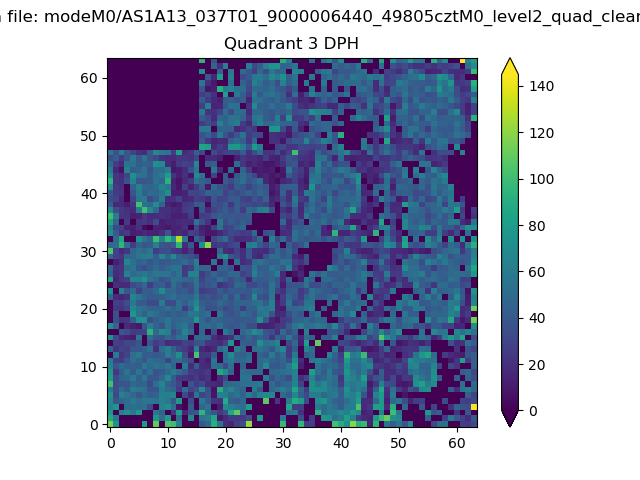 |
 |
Quadrant C |
| Plot type | Count rate plots | Images |
|---|---|---|
| Comparison with Poisson distribution Blue bars denote a histogram of data divided into 1 sec bins. Red curve is a Poisson curve with rate = median count rate of data. |
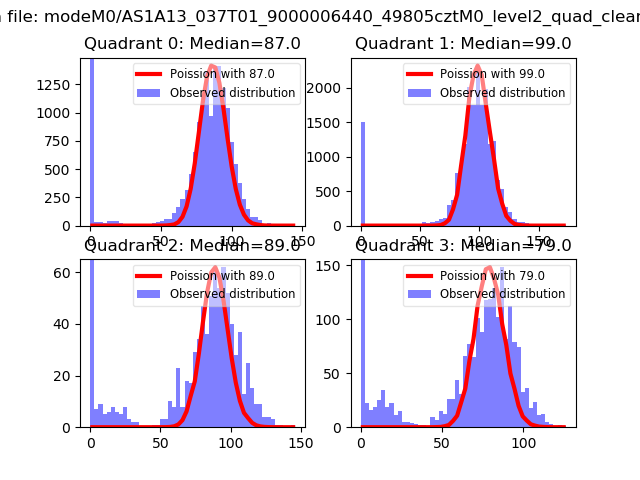 |
 |
| Quadrant-wise count rates Data is divided into 100 sec bins |
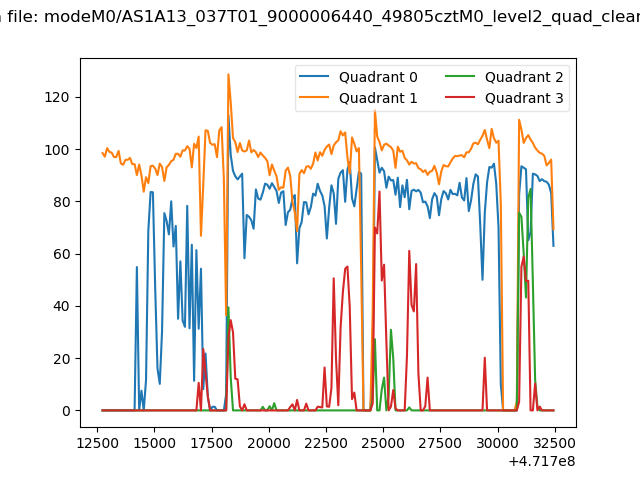 |
|
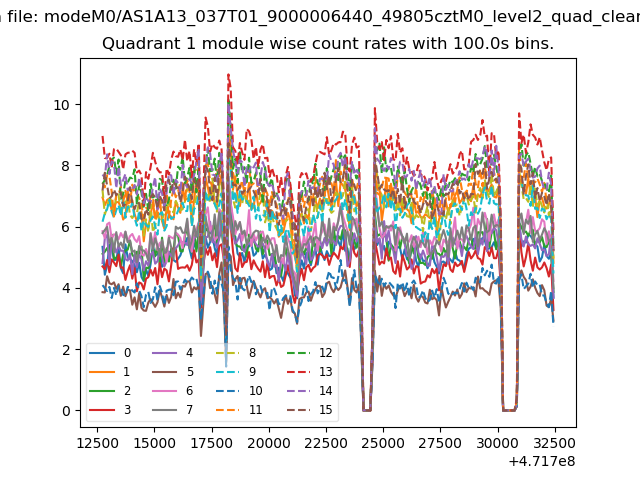
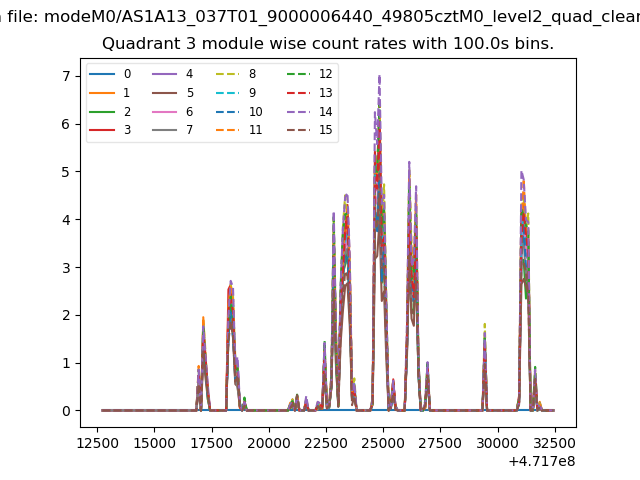
| Module-wise count rates for Quadrant A Data is divided into 100 sec bins |
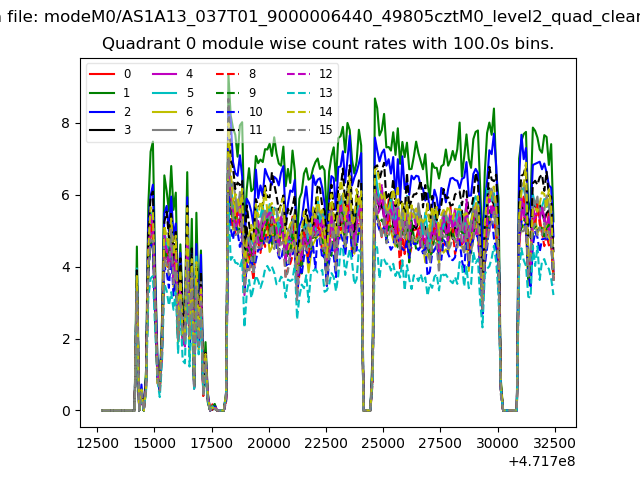 |
 |
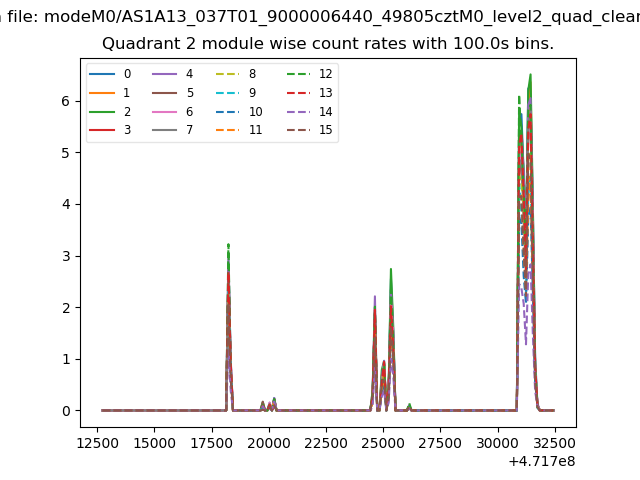
| Module-wise count rates for Quadrant B Data is divided into 100 sec bins |
 |
 |
| Module-wise count rates for Quadrant C Data is divided into 100 sec bins |
 |
 |
| Module-wise count rates for Quadrant D Data is divided into 100 sec bins |
 |
 |
| Parameter | Plot |
|---|---|
| CZT HV Monitor | 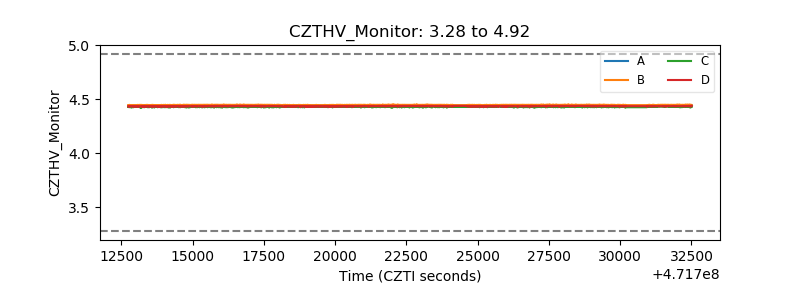 |
| D_VDD | 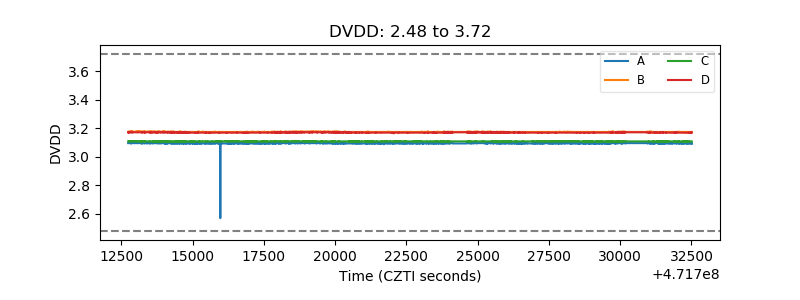 |
| Temperature 1 | 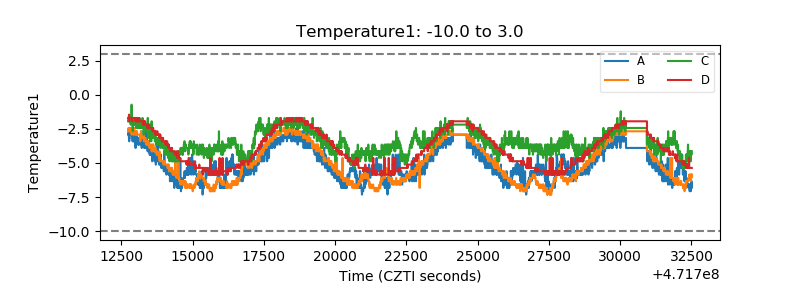 |
| Veto HV Monitor | 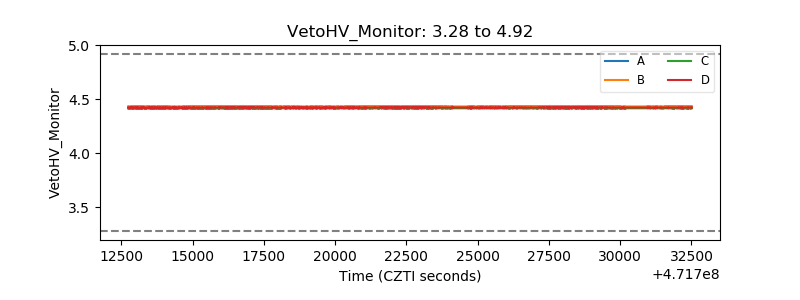 |
| Veto LLD | 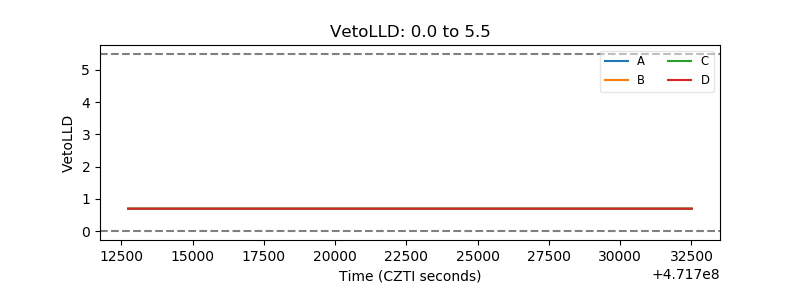 |
| Alpha Counter | 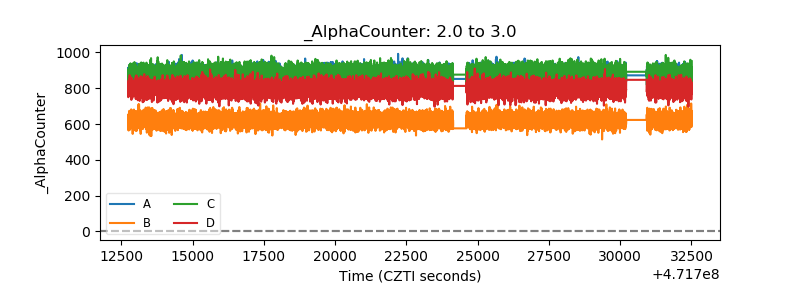 |
| _CPM_Rate | 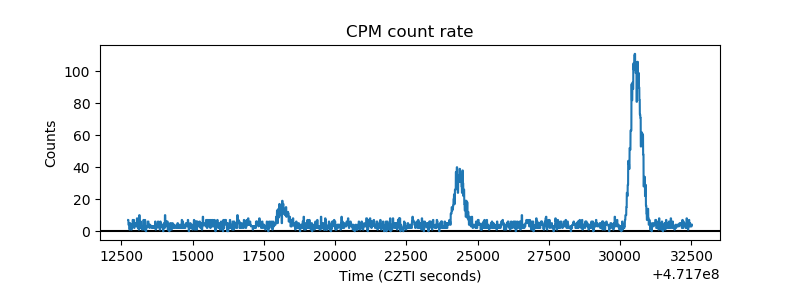 |
| CZT Counter | 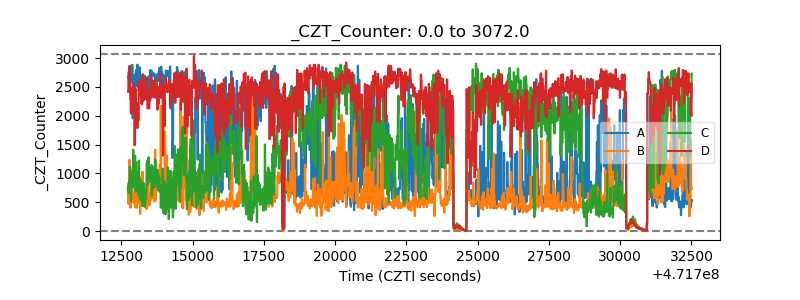 |
| +2.5 Volts monitor | 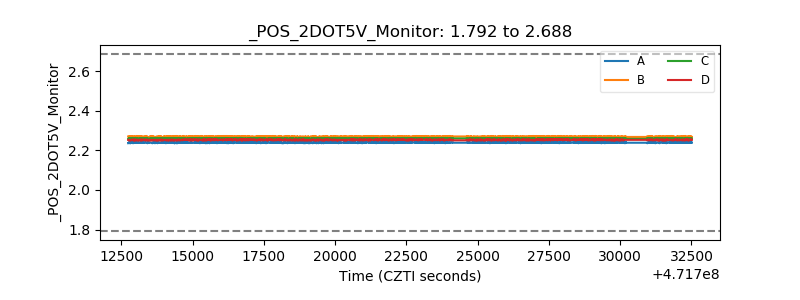 |
| +5 Volts monitor | 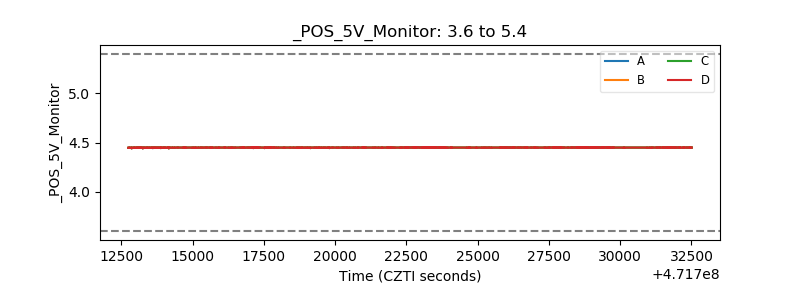 |
| _ROLL_ROT | 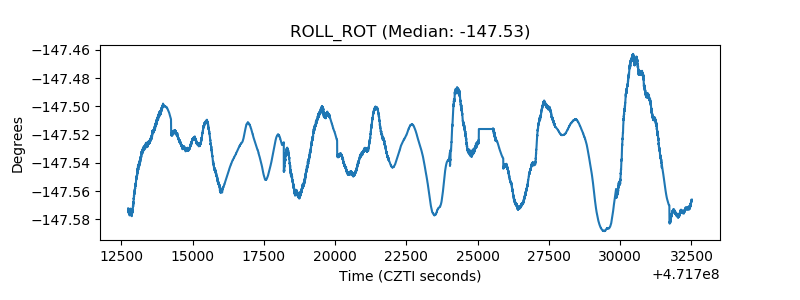 |
| _Roll_DEC | 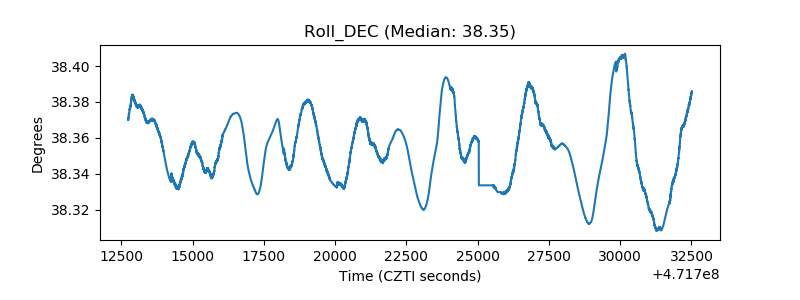 |
| _Roll_RA | 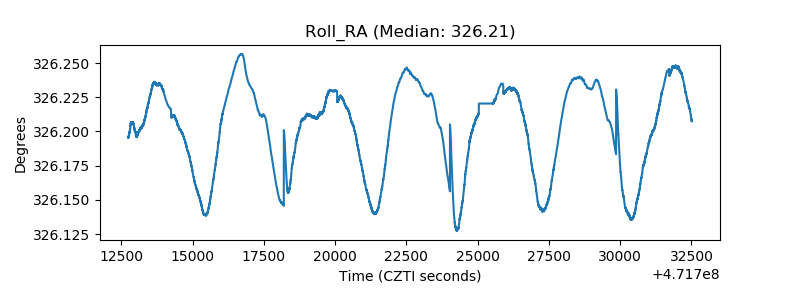 |
| Veto Counter | 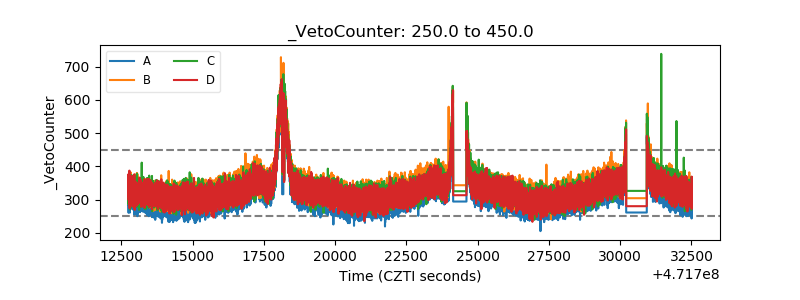 |