| Param | Original file | Final file |
|---|---|---|
| Filename | modeM0/AS1A13_037T01_9000006440_49806cztM0_level2.fits | modeM0/AS1A13_037T01_9000006440_49806cztM0_level2_quad_clean.evt |
| Size (bytes) | 1,073,721,600 | 57,553,920 |
| Size | 1024.0 MB | 54.9 MB |
| Events in quadrant A | 6,653,803 | 549,020 |
| Events in quadrant B | 4,626,662 | 664,264 |
| Events in quadrant C | 12,165,477 | 37,574 |
| Events in quadrant D | 15,784,545 | 28,014 |
| Mode M9 | |||
|---|---|---|---|
| Quadrant | BADHDUFLAG | Total packets | Discarded packets |
| A | 0 | 9 | 0 |
| B | 0 | 9 | 0 |
| C | 0 | 9 | 0 |
| D | 0 | 9 | 0 |
| Mode SS | |||
|---|---|---|---|
| Quadrant | BADHDUFLAG | Total packets | Discarded packets |
| A | 0 | 134 | 0 |
| B | 0 | 134 | 0 |
| C | 0 | 134 | 0 |
| D | 0 | 134 | 0 |
| Mode M0 | |||
|---|---|---|---|
| Quadrant | BADHDUFLAG | Total packets | Discarded packets |
| A | 0 | 24325 | 1 |
| B | 0 | 18357 | 1 |
| C | 0 | 40774 | 1 |
| D | 0 | 51350 | 6 |
| Quadrant | Total seconds | Saturated seconds | Saturation percentage |
|---|---|---|---|
| A | 6651 | 826 | 12.419185% |
| B | 6651 | 149 | 2.240265% |
| C | 6651 | 6315 | 94.948128% |
| D | 6651 | 6403 | 96.271237% |
Noise dominated data is calculated using 1-second bins in cleaned event files. If a bin has >2000 counts, and if more than 50% of those come from <1% of pixels, then it is considered to be noise-dominated and hence unusable.
| Quadrant | # 1 sec bins | Bins with >0 counts | Bins with >2000 counts | High rate bins dominated by noise | Noise dominated (total time) | Noise dominated (detector-on time) | Marked lightcurve |
|---|---|---|---|---|---|---|---|
| A | 7541 | 6651 | 718 | 718 | 9.52% | 10.80% | 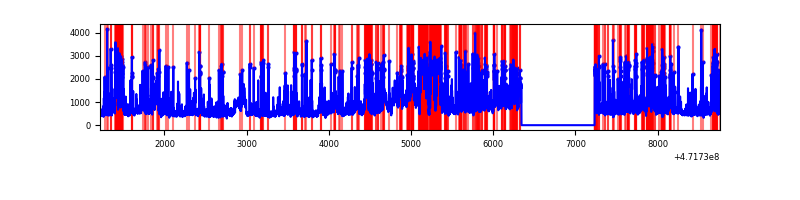 |
| B | 7541 | 6651 | 104 | 104 | 1.38% | 1.56% | 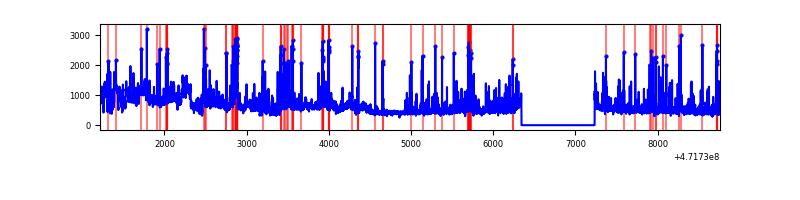 |
| C | 7540 | 6650 | 2929 | 2929 | 38.85% | 44.05% | 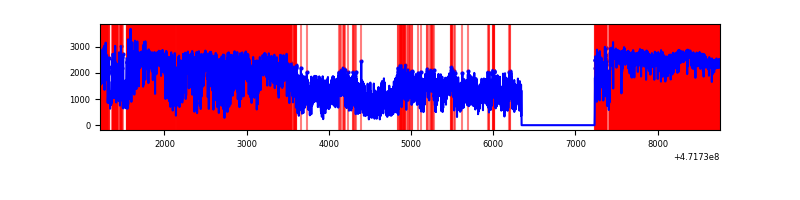 |
| D | 7540 | 6650 | 5906 | 5906 | 78.33% | 88.81% | 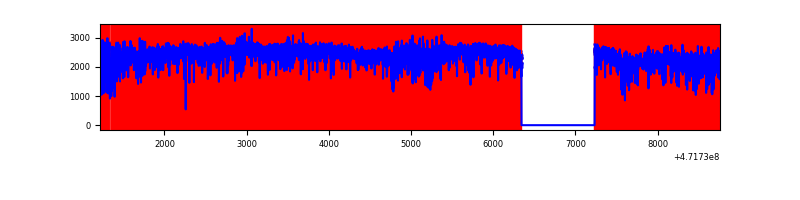 |
Top three noisy pixels from each quadrant. If the there are fewer than three noisy pixels in the level2.evt file, extra rows are filled as -1
| Pixel properties | Quadrant properties | ||||||
|---|---|---|---|---|---|---|---|
| Quadrant | DetID | PixID | Counts | Sigma | Mean | Median | Sigma |
| A | 0 | 98 | 847454 | 5075.04 | 669 | 654 | 166.9 |
| A | 15 | 63 | 736647 | 4410.95 | 669 | 654 | 166.9 |
| A | 4 | 204 | 292161 | 1747.06 | 669 | 654 | 166.9 |
| B | 5 | 172 | 914244 | 6151.14 | 699 | 675 | 148.5 |
| B | 5 | 185 | 271546 | 1823.79 | 699 | 675 | 148.5 |
| B | 10 | 28 | 150865 | 1011.24 | 699 | 675 | 148.5 |
| C | 15 | 147 | 6508006 | 136844.3 | 129 | 126 | 47.6 |
| C | 1 | 44 | 2211904 | 46508.11 | 129 | 126 | 47.6 |
| C | 15 | 197 | 919775 | 19337.9 | 129 | 126 | 47.6 |
| D | 7 | 61 | 5672726 | 49477.63 | 323 | 308 | 114.6 |
| D | 15 | 168 | 1931230 | 16842.46 | 323 | 308 | 114.6 |
| D | 8 | 176 | 1408550 | 12283.38 | 323 | 308 | 114.6 |
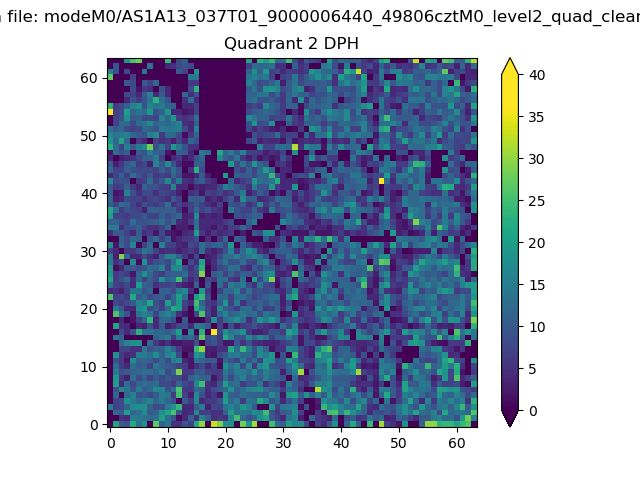
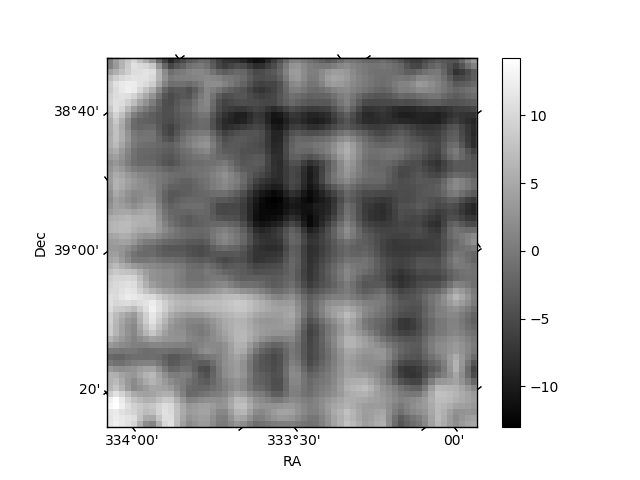
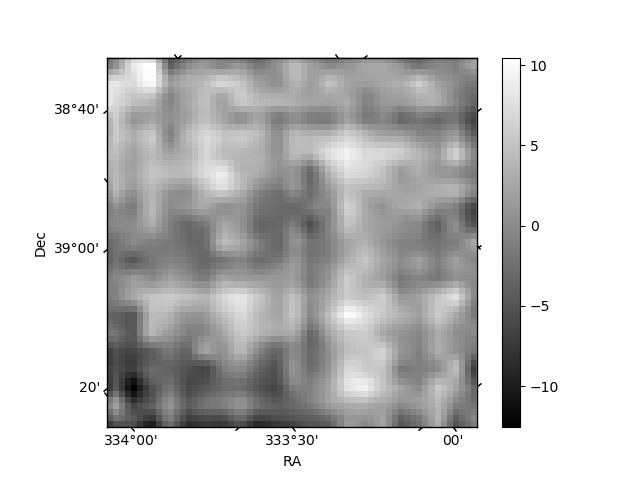
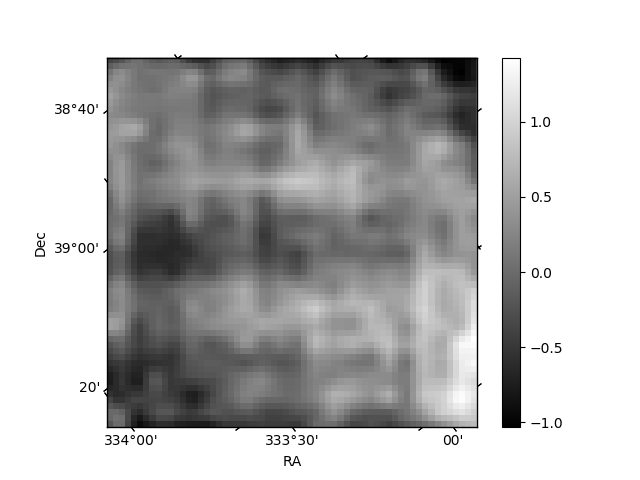
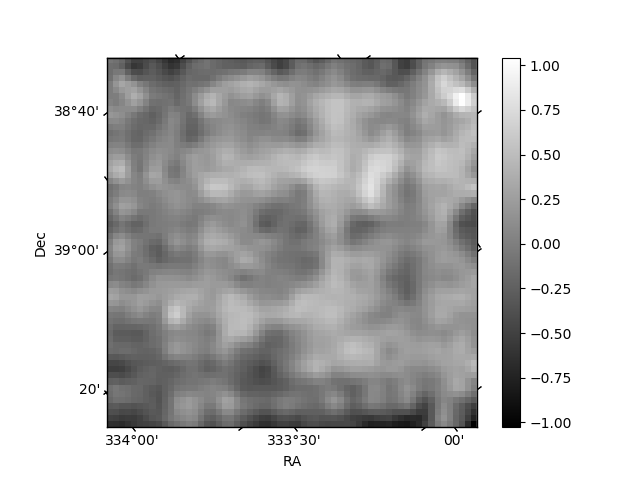
Histogram calculated using DETX and DETY for each event in the final _common_clean file
| Quadrant A | 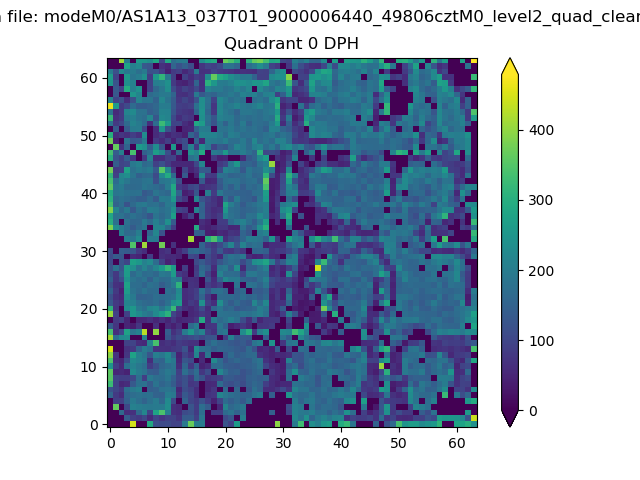 |
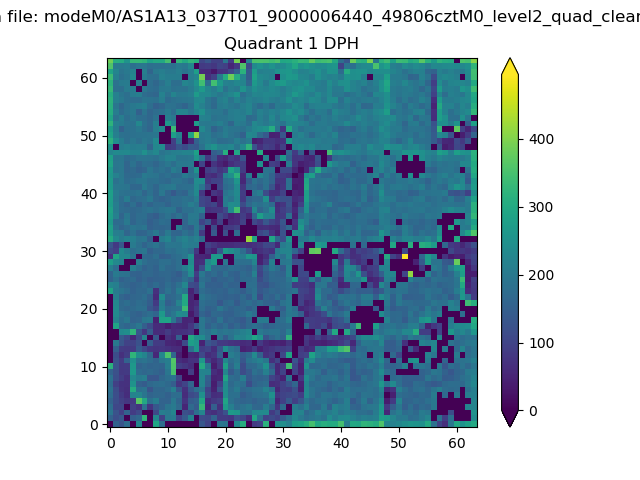 |
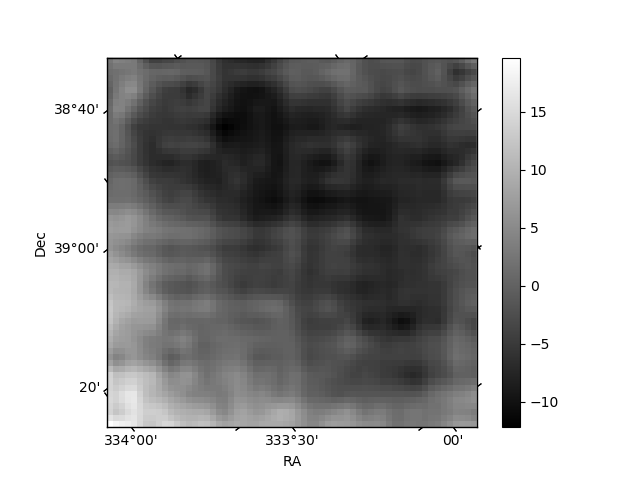
Quadrant B |
|---|---|---|---|
| Quadrant D | 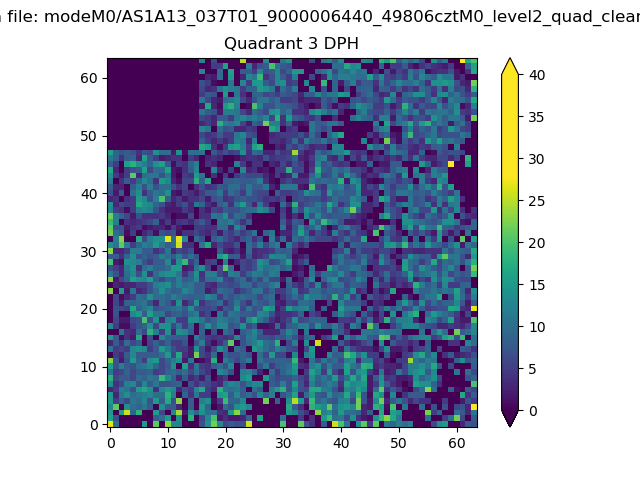 |
 |
Quadrant C |
| Plot type | Count rate plots | Images |
|---|---|---|
| Comparison with Poisson distribution Blue bars denote a histogram of data divided into 1 sec bins. Red curve is a Poisson curve with rate = median count rate of data. |
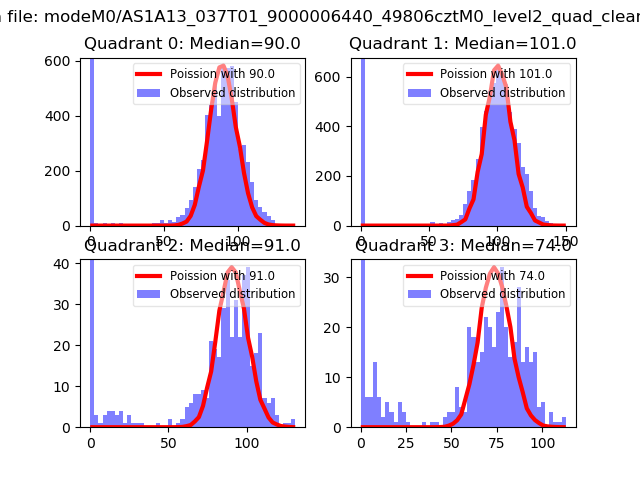 |
 |
| Quadrant-wise count rates Data is divided into 100 sec bins |
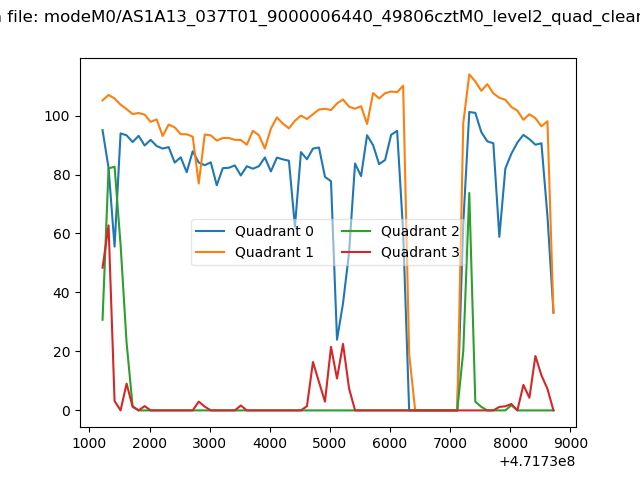 |
|
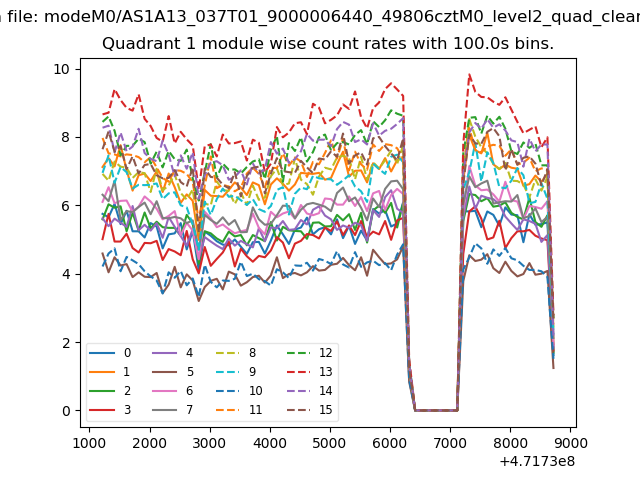
| Module-wise count rates for Quadrant A Data is divided into 100 sec bins |
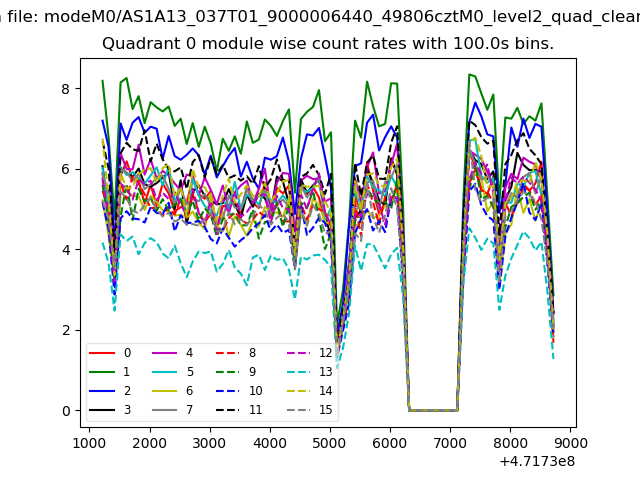 |
 |
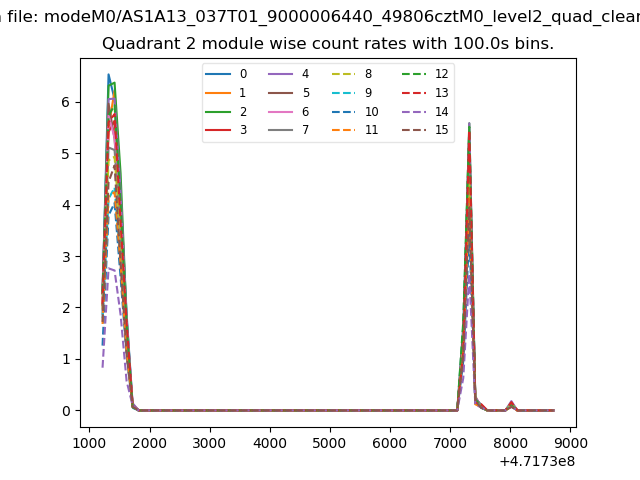
| Module-wise count rates for Quadrant B Data is divided into 100 sec bins |
 |
 |
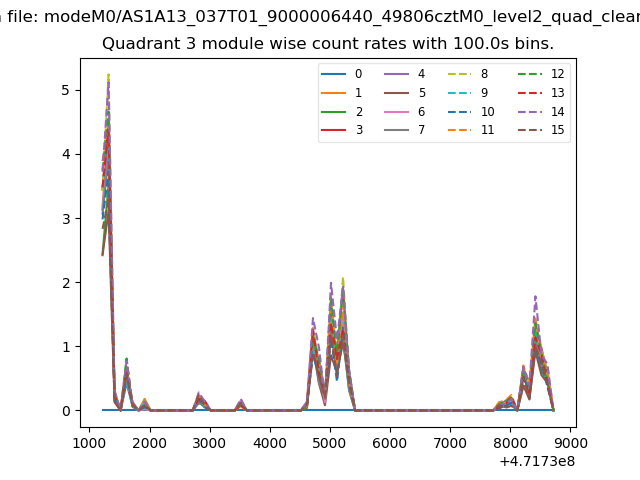
| Module-wise count rates for Quadrant C Data is divided into 100 sec bins |
 |
 |
| Module-wise count rates for Quadrant D Data is divided into 100 sec bins |
 |
 |
| Parameter | Plot |
|---|---|
| CZT HV Monitor | 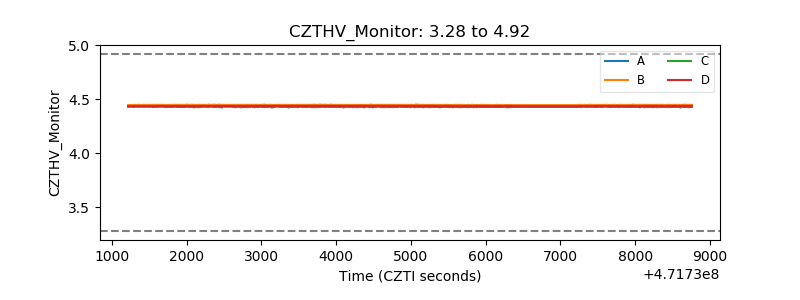 |
| D_VDD | 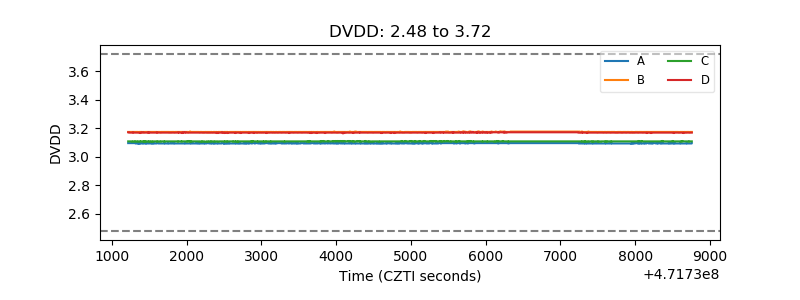 |
| Temperature 1 | 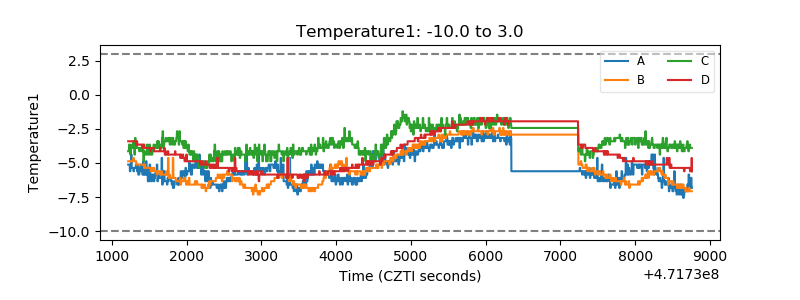 |
| Veto HV Monitor | 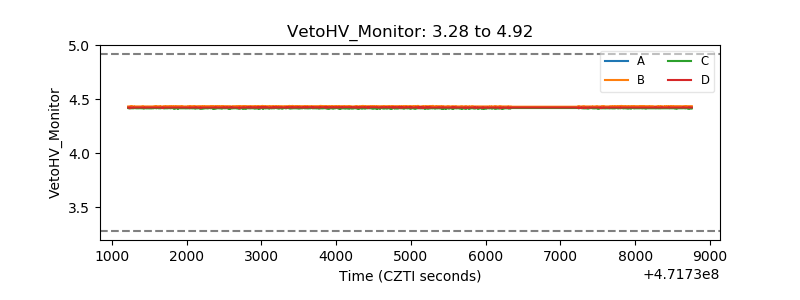 |
| Veto LLD | 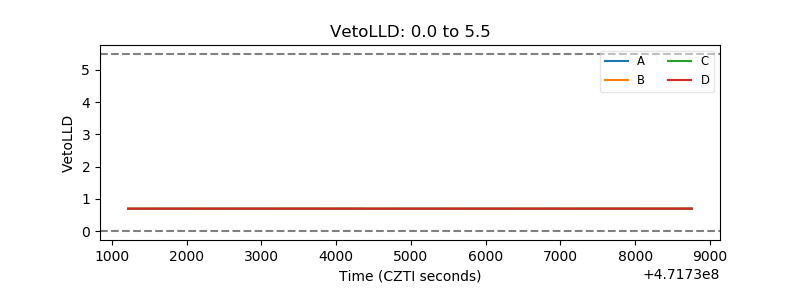 |
| Alpha Counter | 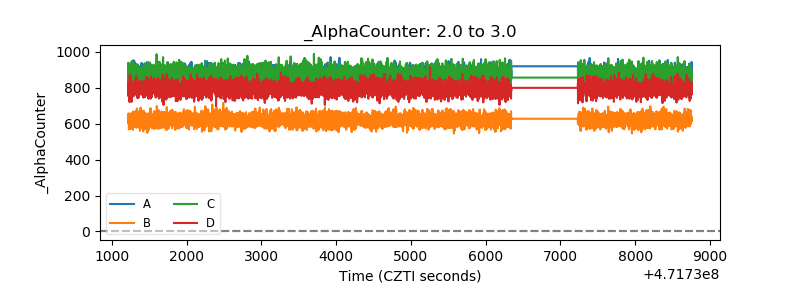 |
| _CPM_Rate |  |
| CZT Counter | 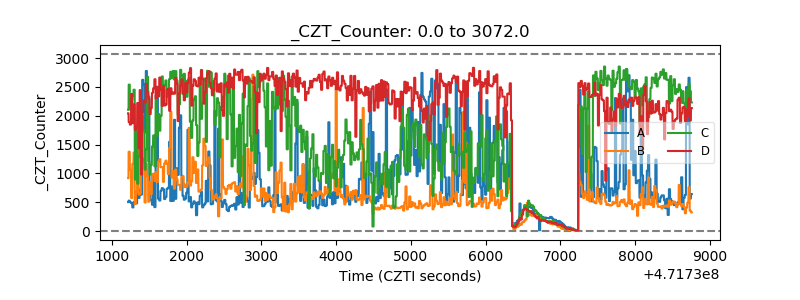 |
| +2.5 Volts monitor | 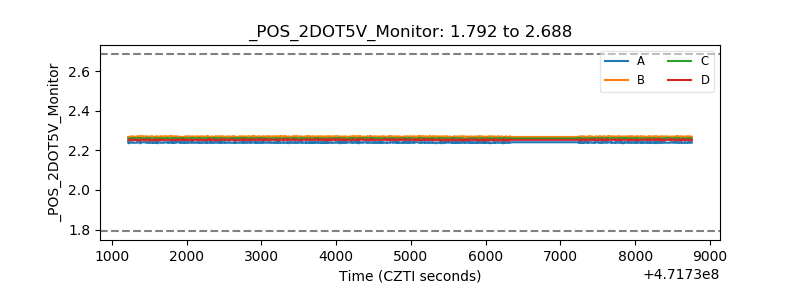 |
| +5 Volts monitor | 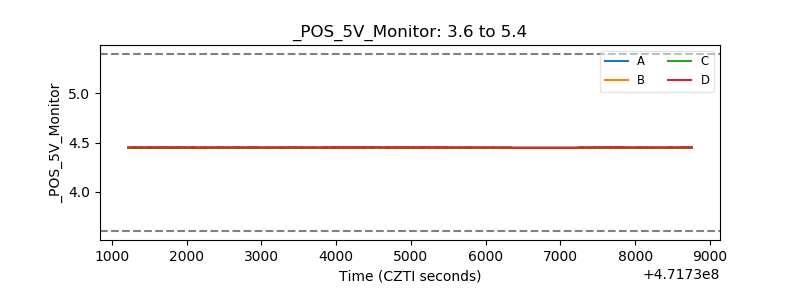 |
| _ROLL_ROT | 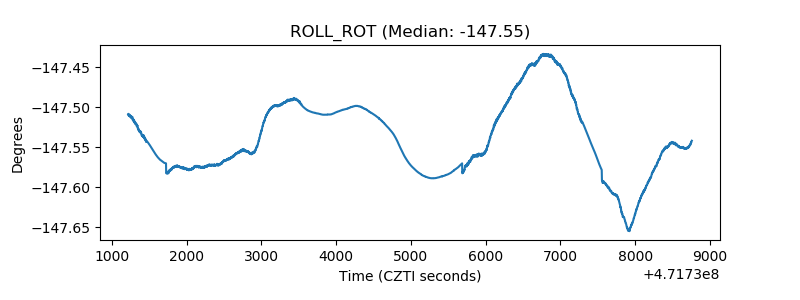 |
| _Roll_DEC | 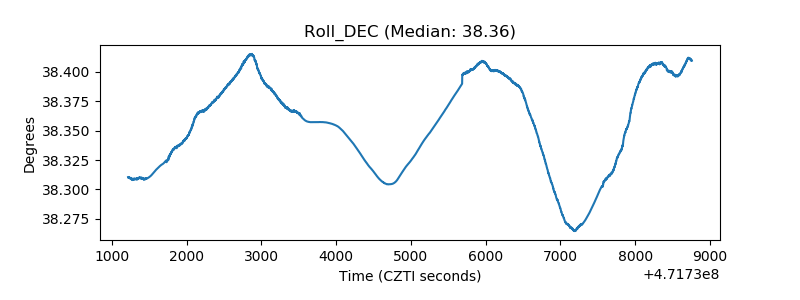 |
| _Roll_RA | 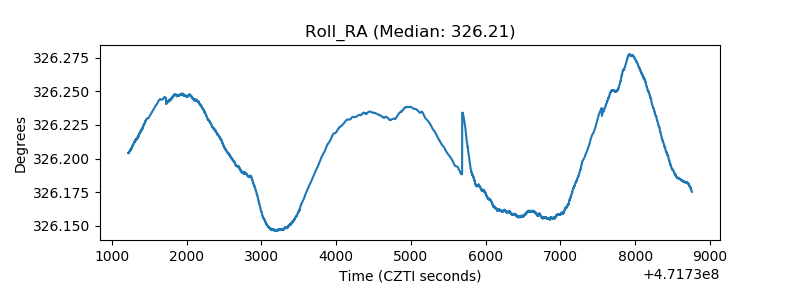 |
| Veto Counter | 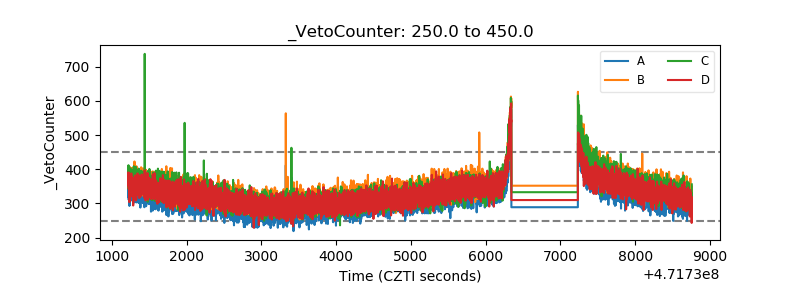 |