| Param | Original file | Final file |
|---|---|---|
| Filename | modeM0/AS1A13_037T01_9000006440_49808cztM0_level2.fits | modeM0/AS1A13_037T01_9000006440_49808cztM0_level2_quad_clean.evt |
| Size (bytes) | 1,076,463,360 | 56,986,560 |
| Size | 1.0 GB | 54.3 MB |
| Events in quadrant A | 7,256,369 | 530,722 |
| Events in quadrant B | 3,550,928 | 672,551 |
| Events in quadrant C | 13,417,349 | 44,370 |
| Events in quadrant D | 15,116,384 | 21,719 |
| Mode M9 | |||
|---|---|---|---|
| Quadrant | BADHDUFLAG | Total packets | Discarded packets |
| A | 0 | 11 | 0 |
| B | 0 | 11 | 0 |
| C | 0 | 11 | 0 |
| D | 0 | 11 | 0 |
| Mode SS | |||
|---|---|---|---|
| Quadrant | BADHDUFLAG | Total packets | Discarded packets |
| A | 0 | 132 | 0 |
| B | 0 | 132 | 0 |
| C | 0 | 132 | 0 |
| D | 0 | 132 | 0 |
| Mode M0 | |||
|---|---|---|---|
| Quadrant | BADHDUFLAG | Total packets | Discarded packets |
| A | 0 | 26027 | 1 |
| B | 0 | 15061 | 1 |
| C | 0 | 44395 | 1 |
| D | 0 | 49342 | 8 |
| Quadrant | Total seconds | Saturated seconds | Saturation percentage |
|---|---|---|---|
| A | 6538 | 1131 | 17.298868% |
| B | 6539 | 79 | 1.208136% |
| C | 6539 | 6141 | 93.913442% |
| D | 6538 | 6355 | 97.200979% |
Noise dominated data is calculated using 1-second bins in cleaned event files. If a bin has >2000 counts, and if more than 50% of those come from <1% of pixels, then it is considered to be noise-dominated and hence unusable.
| Quadrant | # 1 sec bins | Bins with >0 counts | Bins with >2000 counts | High rate bins dominated by noise | Noise dominated (total time) | Noise dominated (detector-on time) | Marked lightcurve |
|---|---|---|---|---|---|---|---|
| A | 7607 | 6537 | 1027 | 1027 | 13.50% | 15.71% | 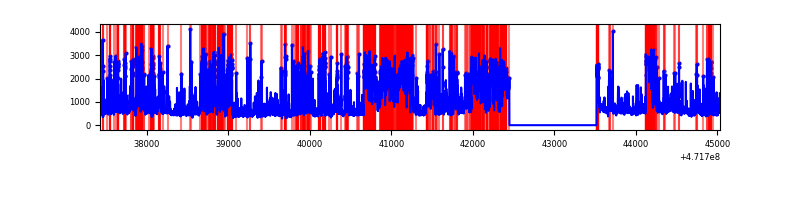 |
| B | 7609 | 6540 | 53 | 53 | 0.70% | 0.81% | 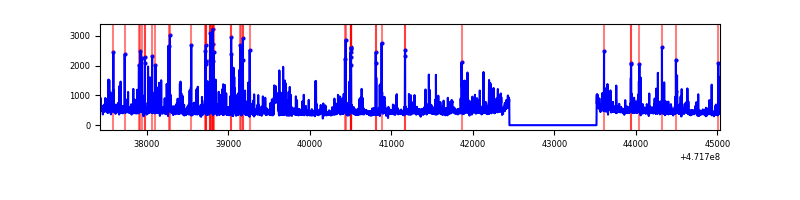 |
| C | 7608 | 6538 | 3925 | 3925 | 51.59% | 60.03% | 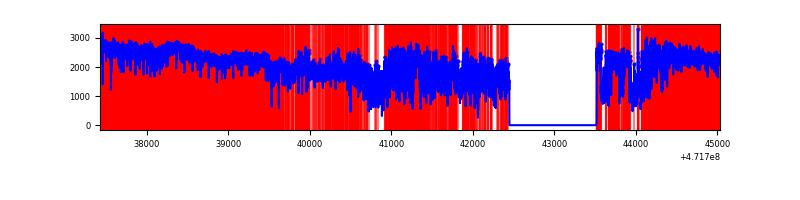 |
| D | 7607 | 6537 | 5758 | 5758 | 75.69% | 88.08% | 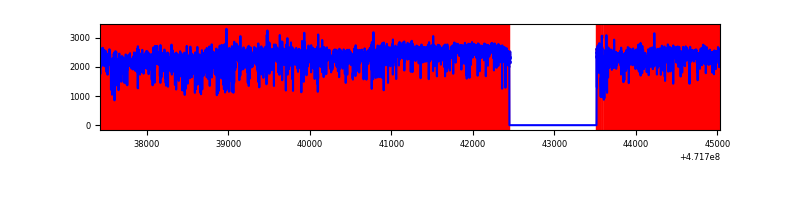 |
Top three noisy pixels from each quadrant. If the there are fewer than three noisy pixels in the level2.evt file, extra rows are filled as -1
| Pixel properties | Quadrant properties | ||||||
|---|---|---|---|---|---|---|---|
| Quadrant | DetID | PixID | Counts | Sigma | Mean | Median | Sigma |
| A | 0 | 98 | 1680656 | 10067.17 | 655 | 636 | 166.9 |
| A | 15 | 63 | 659235 | 3946.52 | 655 | 636 | 166.9 |
| A | 8 | 8 | 413399 | 2473.4 | 655 | 636 | 166.9 |
| B | 5 | 185 | 323781 | 2198.84 | 693 | 670 | 146.9 |
| B | 4 | 206 | 111956 | 757.33 | 693 | 670 | 146.9 |
| B | 5 | 172 | 50147 | 336.7 | 693 | 670 | 146.9 |
| C | 15 | 147 | 3779150 | 68128.05 | 169 | 166 | 55.5 |
| C | 1 | 44 | 3389279 | 61099.41 | 169 | 166 | 55.5 |
| C | 15 | 197 | 2867231 | 51687.85 | 169 | 166 | 55.5 |
| D | 7 | 61 | 7184636 | 69476.57 | 306 | 294 | 103.4 |
| D | 15 | 184 | 1037727 | 10032.55 | 306 | 294 | 103.4 |
| D | 15 | 168 | 855161 | 8267.04 | 306 | 294 | 103.4 |
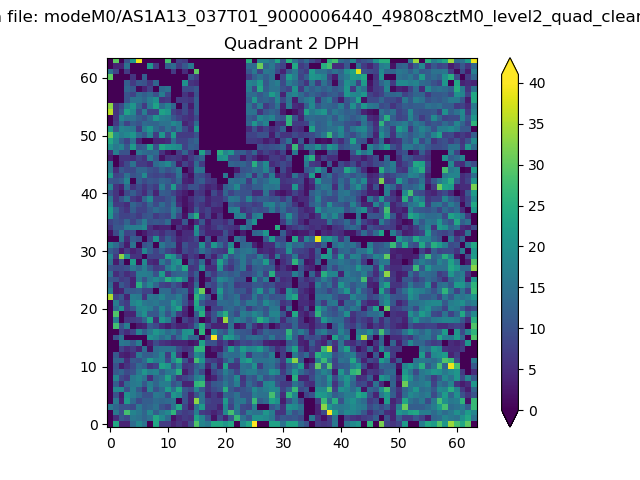
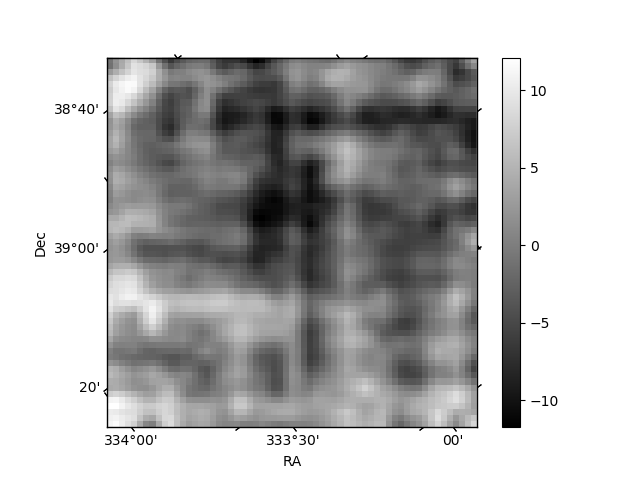
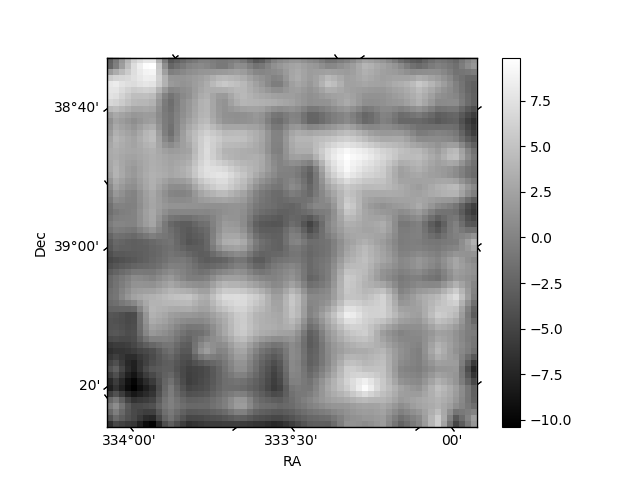
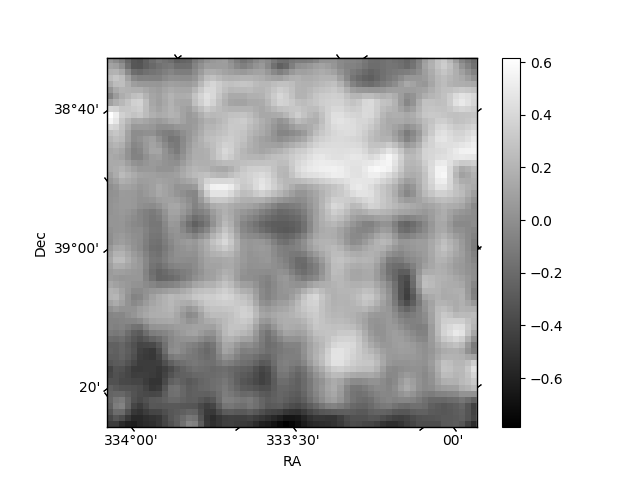
Histogram calculated using DETX and DETY for each event in the final _common_clean file
| Quadrant A | 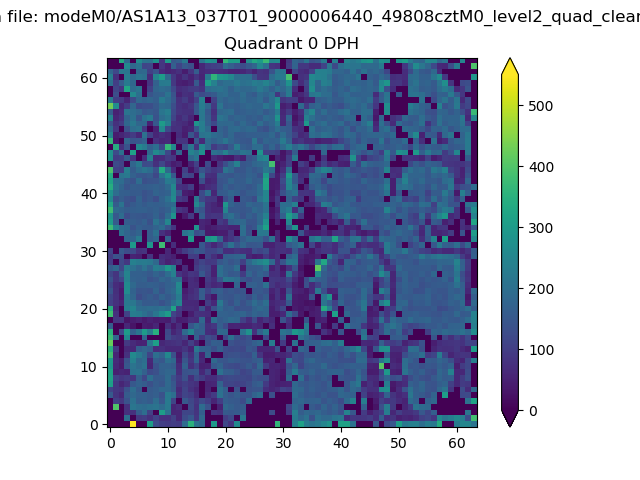 |
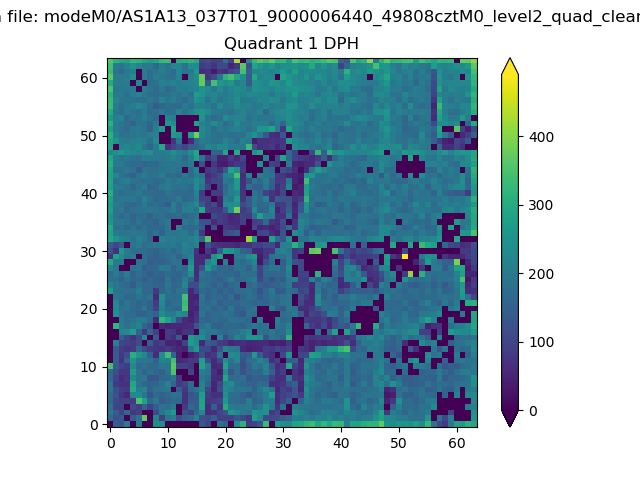 |
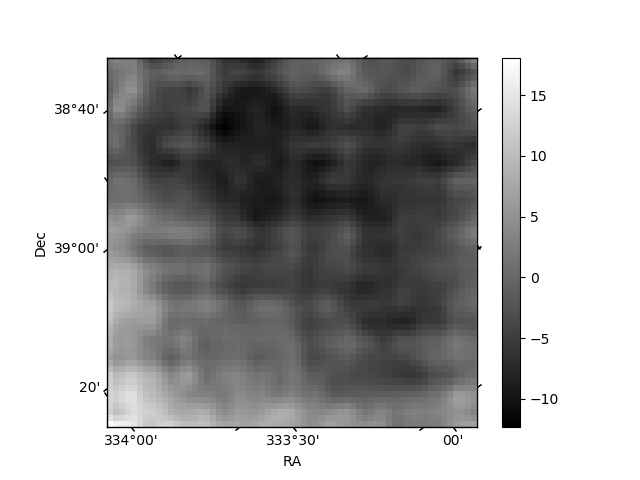
Quadrant B |
|---|---|---|---|
| Quadrant D | 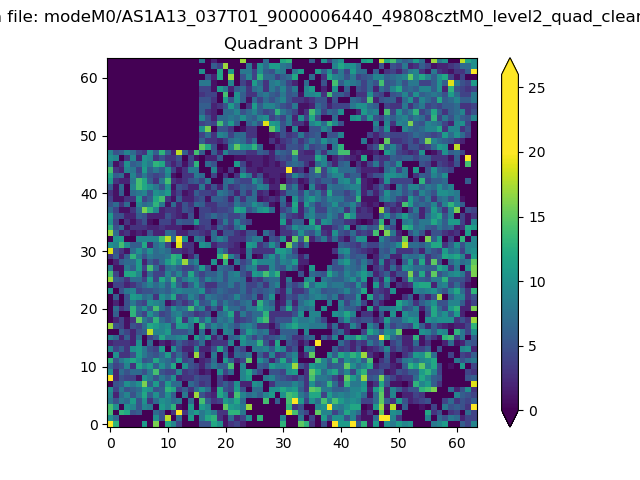 |
 |
Quadrant C |
| Plot type | Count rate plots | Images |
|---|---|---|
| Comparison with Poisson distribution Blue bars denote a histogram of data divided into 1 sec bins. Red curve is a Poisson curve with rate = median count rate of data. |
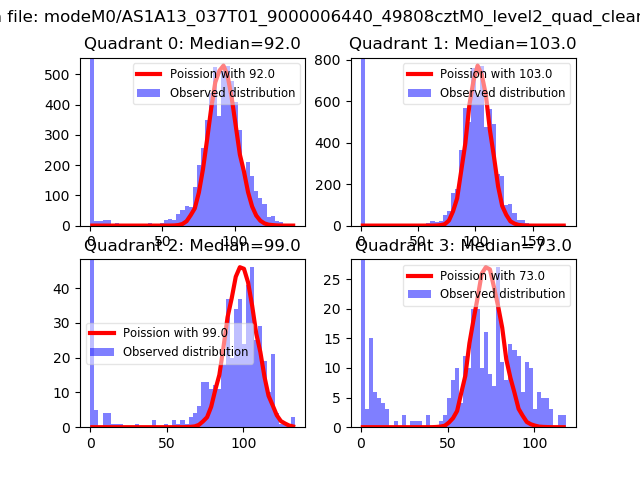 |
 |
| Quadrant-wise count rates Data is divided into 100 sec bins |
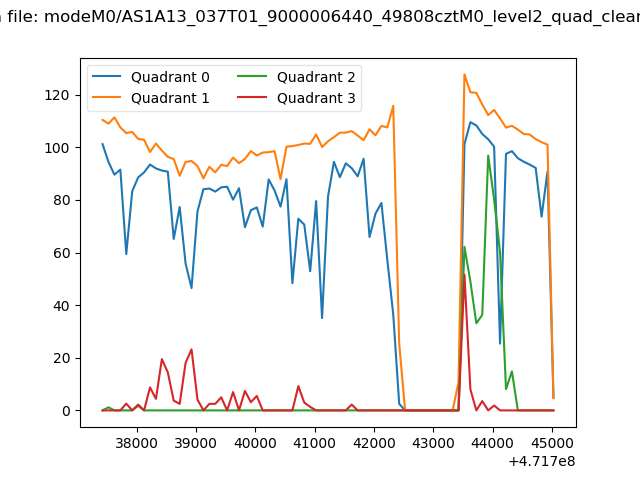 |
|
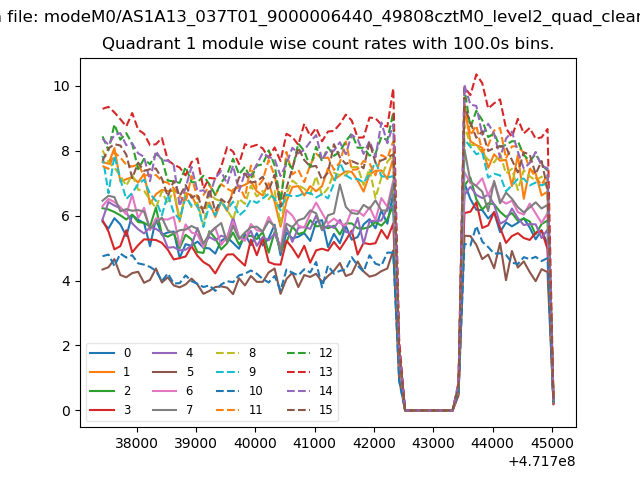
| Module-wise count rates for Quadrant A Data is divided into 100 sec bins |
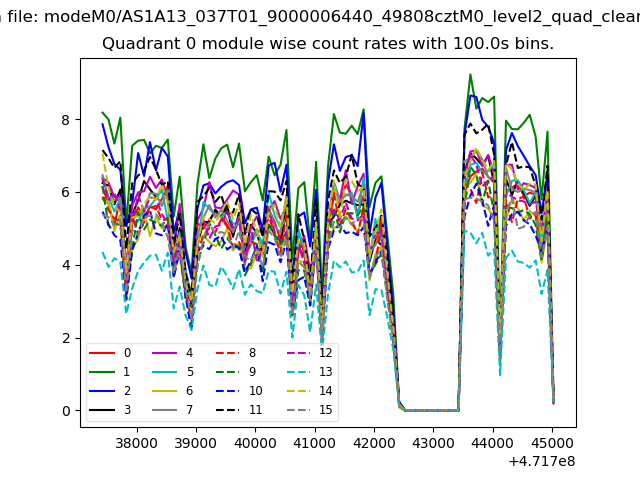 |
 |
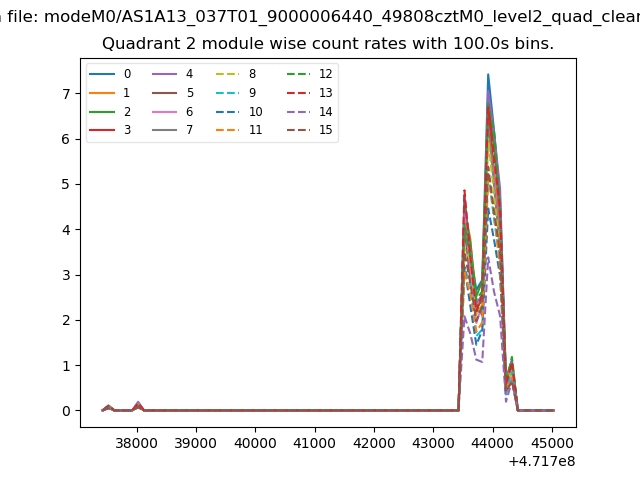
| Module-wise count rates for Quadrant B Data is divided into 100 sec bins |
 |
 |
| Module-wise count rates for Quadrant C Data is divided into 100 sec bins |
 |
 |
| Module-wise count rates for Quadrant D Data is divided into 100 sec bins |
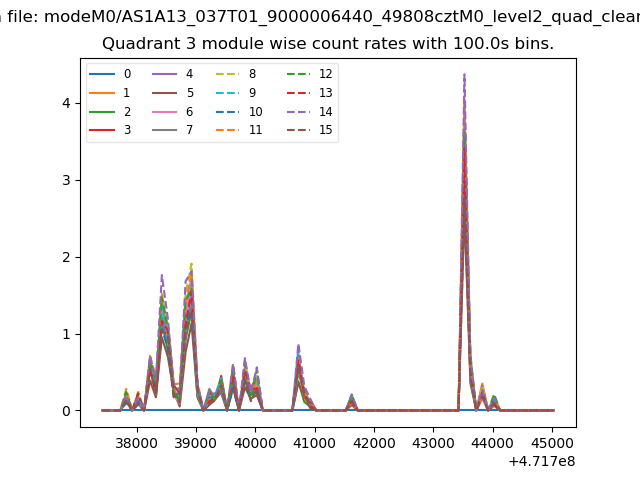 |
 |
| Parameter | Plot |
|---|---|
| CZT HV Monitor | 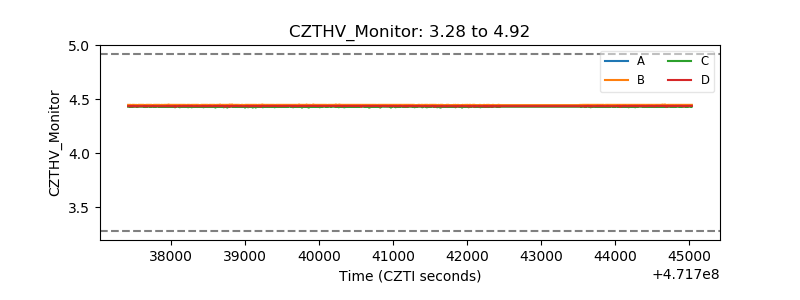 |
| D_VDD | 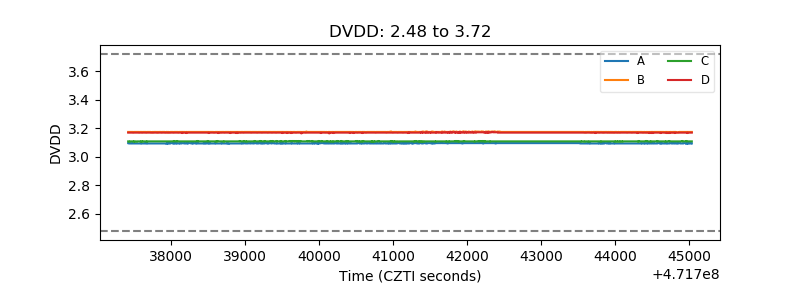 |
| Temperature 1 | 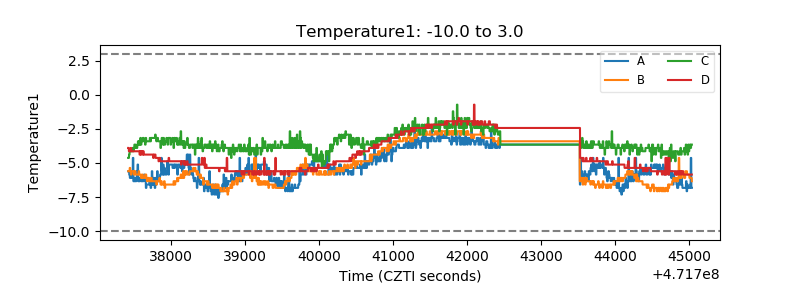 |
| Veto HV Monitor | 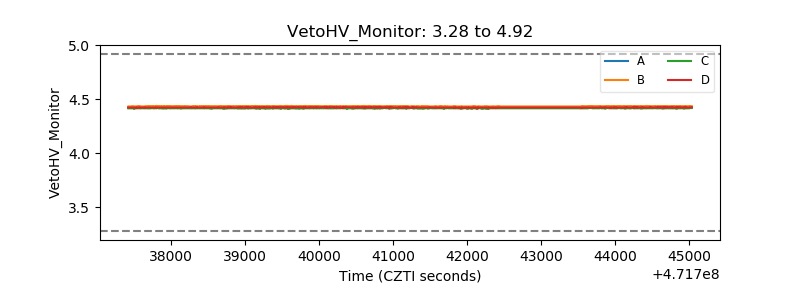 |
| Veto LLD | 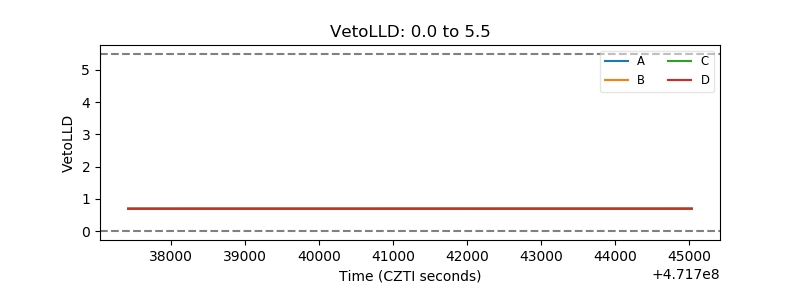 |
| Alpha Counter | 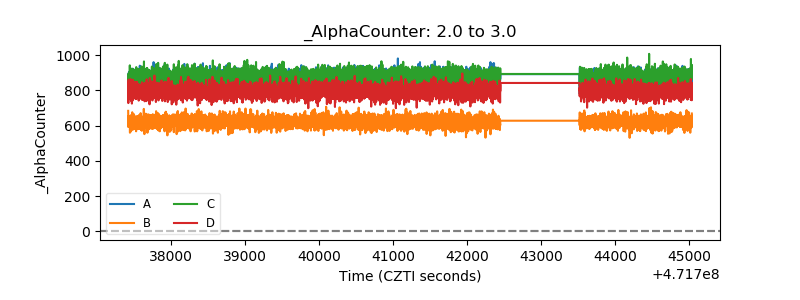 |
| _CPM_Rate | 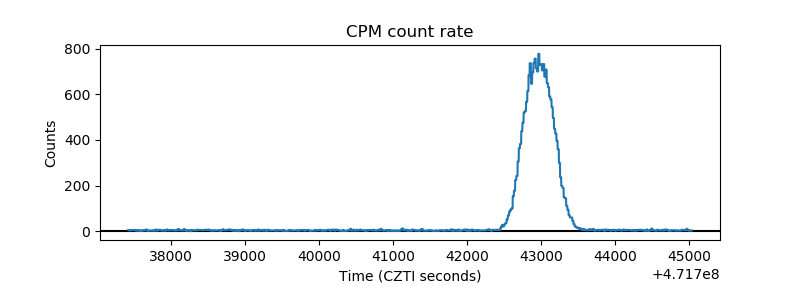 |
| CZT Counter | 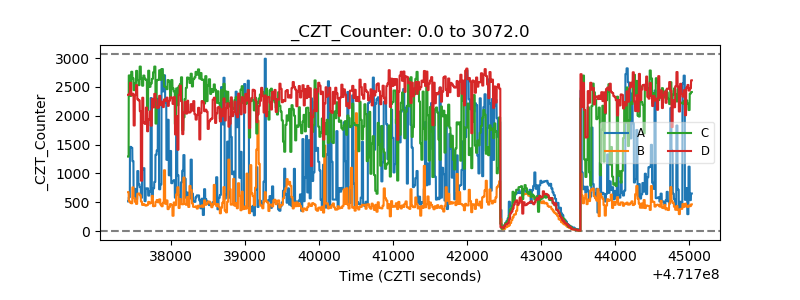 |
| +2.5 Volts monitor | 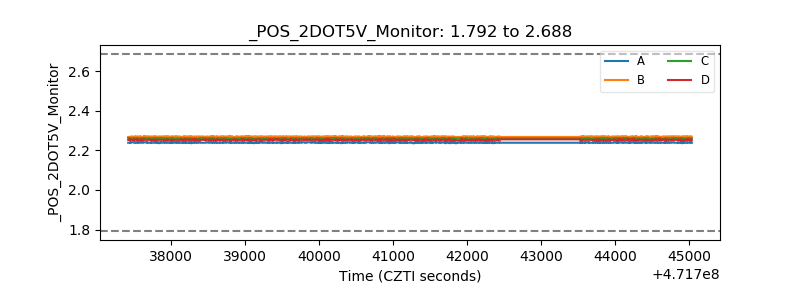 |
| +5 Volts monitor | 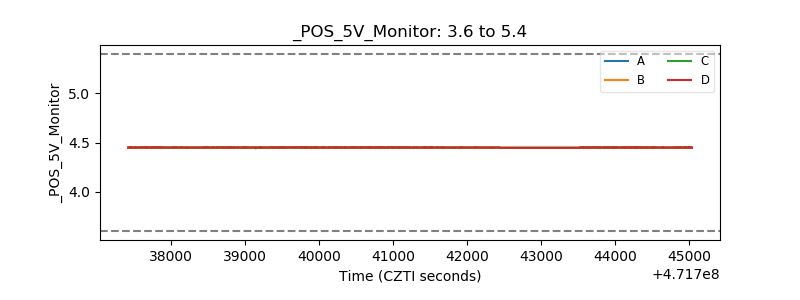 |
| _ROLL_ROT | 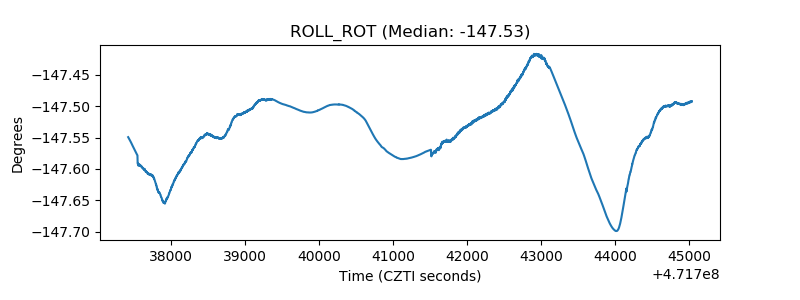 |
| _Roll_DEC | 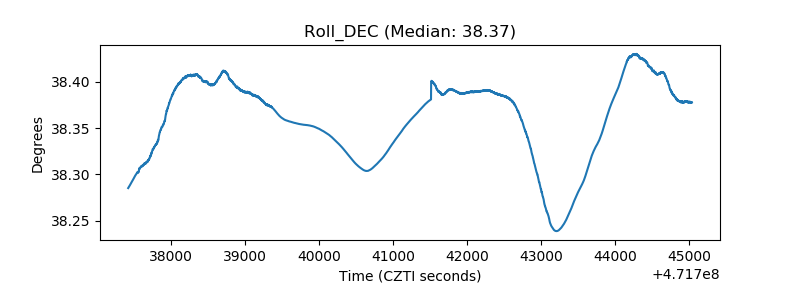 |
| _Roll_RA | 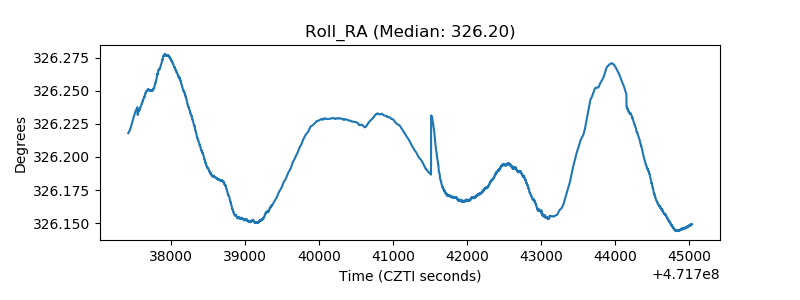 |
| Veto Counter | 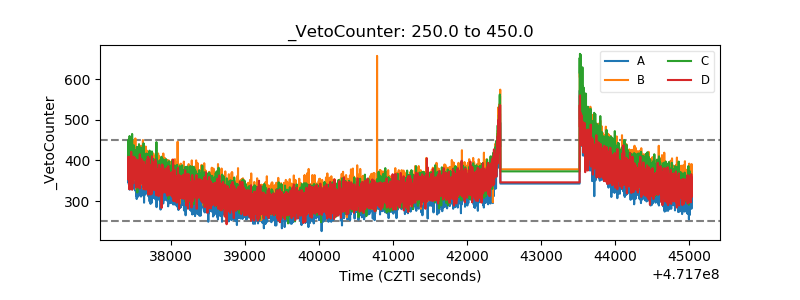 |