| Param | Original file | Final file |
|---|---|---|
| Filename | modeM0/AS1A13_037T01_9000006440_49809cztM0_level2.fits | modeM0/AS1A13_037T01_9000006440_49809cztM0_level2_quad_clean.evt |
| Size (bytes) | 1,061,735,040 | 60,442,560 |
| Size | 1012.5 MB | 57.6 MB |
| Events in quadrant A | 5,955,112 | 562,704 |
| Events in quadrant B | 3,423,024 | 686,606 |
| Events in quadrant C | 13,936,676 | 108,272 |
| Events in quadrant D | 15,487,624 | 21,836 |
| Mode M9 | |||
|---|---|---|---|
| Quadrant | BADHDUFLAG | Total packets | Discarded packets |
| A | 0 | 11 | 0 |
| B | 0 | 11 | 0 |
| C | 0 | 11 | 0 |
| D | 0 | 11 | 0 |
| Mode SS | |||
|---|---|---|---|
| Quadrant | BADHDUFLAG | Total packets | Discarded packets |
| A | 0 | 132 | 0 |
| B | 0 | 132 | 0 |
| C | 0 | 132 | 0 |
| D | 0 | 132 | 0 |
| Mode M0 | |||
|---|---|---|---|
| Quadrant | BADHDUFLAG | Total packets | Discarded packets |
| A | 0 | 22052 | 1 |
| B | 0 | 14610 | 1 |
| C | 0 | 45834 | 1 |
| D | 0 | 50392 | 1 |
| Quadrant | Total seconds | Saturated seconds | Saturation percentage |
|---|---|---|---|
| A | 6456 | 794 | 12.298637% |
| B | 6457 | 133 | 2.059780% |
| C | 6457 | 5511 | 85.349233% |
| D | 6457 | 6294 | 97.475608% |
Noise dominated data is calculated using 1-second bins in cleaned event files. If a bin has >2000 counts, and if more than 50% of those come from <1% of pixels, then it is considered to be noise-dominated and hence unusable.
| Quadrant | # 1 sec bins | Bins with >0 counts | Bins with >2000 counts | High rate bins dominated by noise | Noise dominated (total time) | Noise dominated (detector-on time) | Marked lightcurve |
|---|---|---|---|---|---|---|---|
| A | 7571 | 6456 | 725 | 725 | 9.58% | 11.23% | 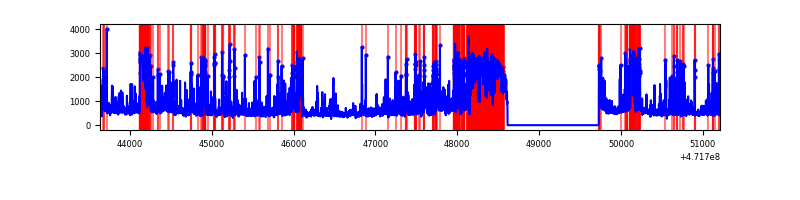 |
| B | 7572 | 6457 | 54 | 54 | 0.71% | 0.84% | 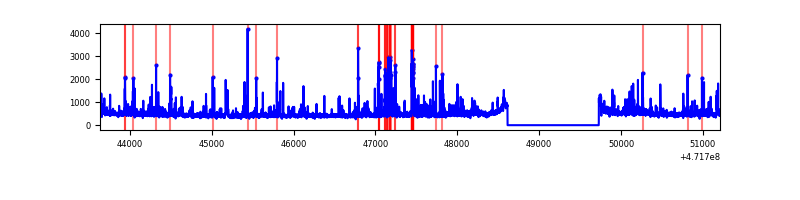 |
| C | 7571 | 6456 | 4804 | 4804 | 63.45% | 74.41% | 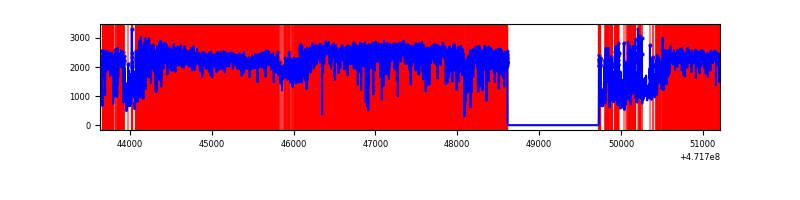 |
| D | 7571 | 6456 | 6016 | 6016 | 79.46% | 93.18% | 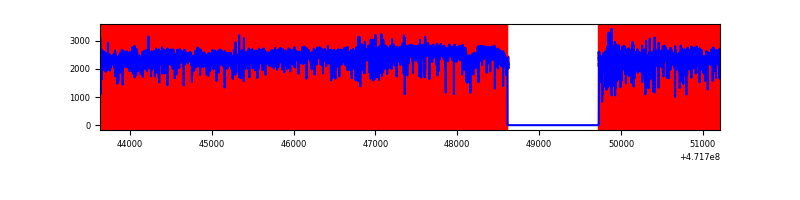 |
Top three noisy pixels from each quadrant. If the there are fewer than three noisy pixels in the level2.evt file, extra rows are filled as -1
| Pixel properties | Quadrant properties | ||||||
|---|---|---|---|---|---|---|---|
| Quadrant | DetID | PixID | Counts | Sigma | Mean | Median | Sigma |
| A | 0 | 98 | 1027929 | 6047.81 | 677 | 660 | 169.9 |
| A | 8 | 38 | 434569 | 2554.54 | 677 | 660 | 169.9 |
| A | 15 | 63 | 400389 | 2353.31 | 677 | 660 | 169.9 |
| B | 1 | 255 | 161226 | 1056.78 | 710 | 686 | 151.9 |
| B | 4 | 206 | 76253 | 497.43 | 710 | 686 | 151.9 |
| B | 5 | 49 | 57674 | 375.13 | 710 | 686 | 151.9 |
| C | 15 | 147 | 3925555 | 47996.54 | 276 | 273 | 81.8 |
| C | 15 | 197 | 3242318 | 39642.23 | 276 | 273 | 81.8 |
| C | 15 | 174 | 1371915 | 16771.81 | 276 | 273 | 81.8 |
| D | 7 | 61 | 6218163 | 65423.11 | 293 | 280 | 95.0 |
| D | 14 | 52 | 1291308 | 13583.9 | 293 | 280 | 95.0 |
| D | 15 | 168 | 1216378 | 12795.5 | 293 | 280 | 95.0 |
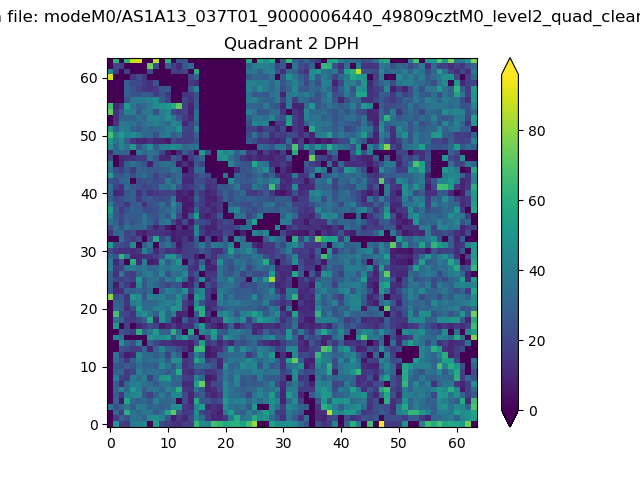
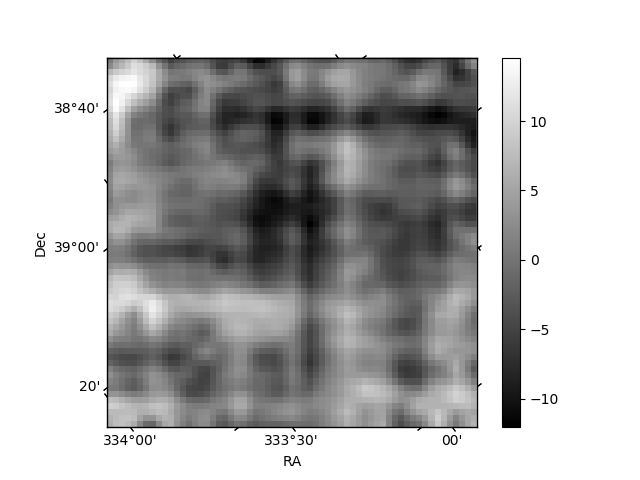
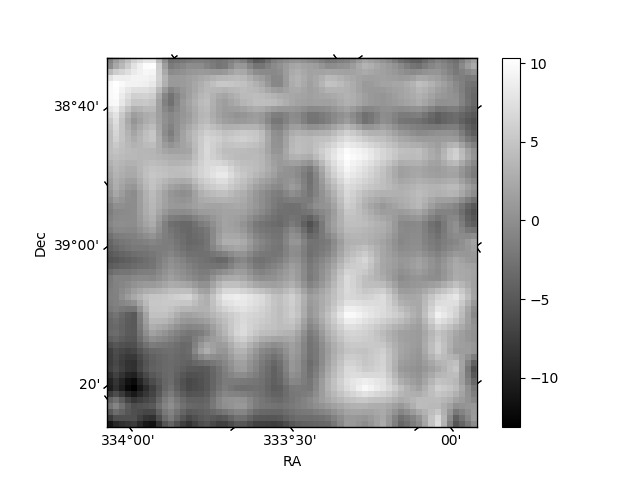
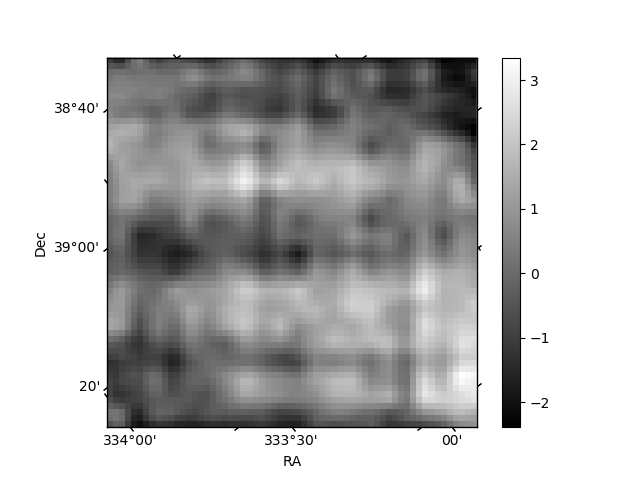
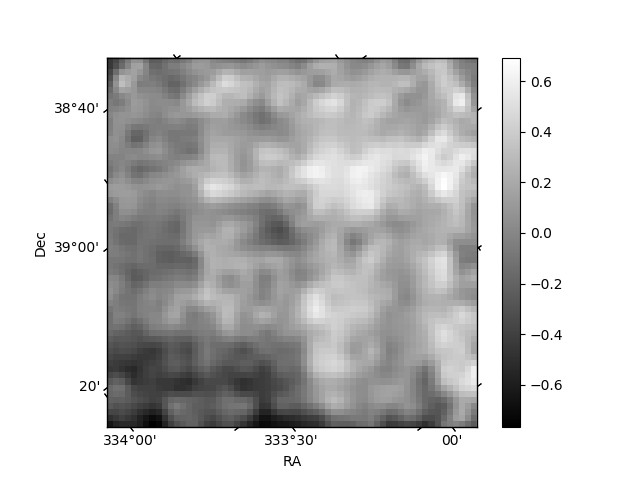
Histogram calculated using DETX and DETY for each event in the final _common_clean file
| Quadrant A | 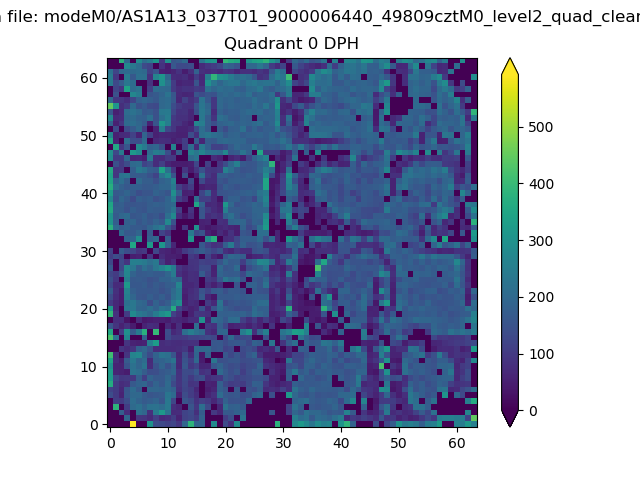 |
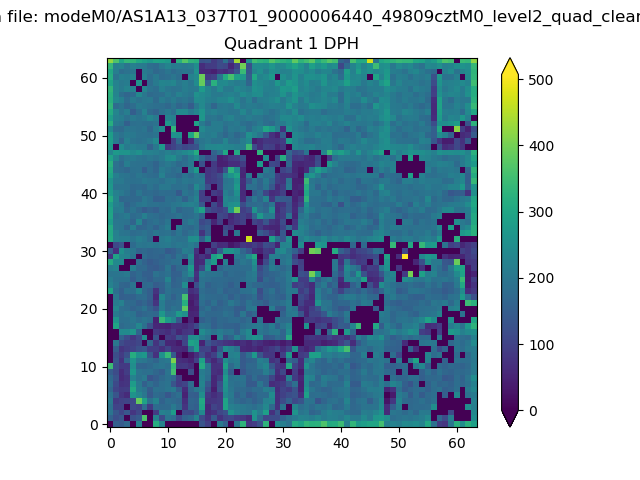 |
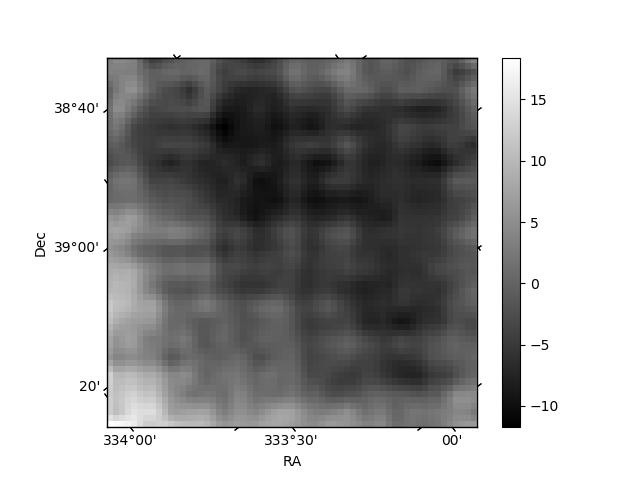
Quadrant B |
|---|---|---|---|
| Quadrant D | 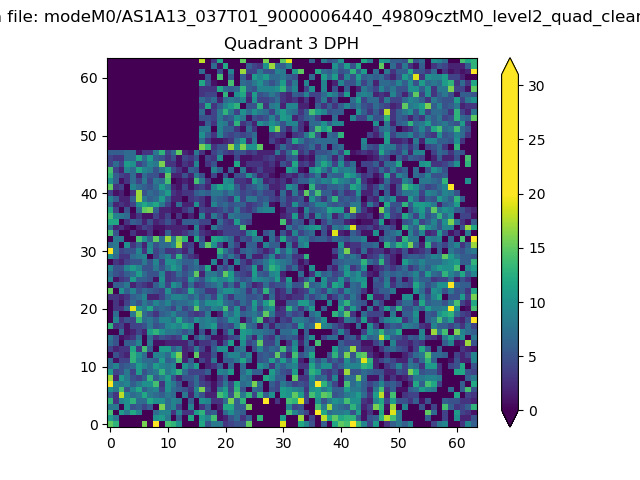 |
 |
Quadrant C |
| Plot type | Count rate plots | Images |
|---|---|---|
| Comparison with Poisson distribution Blue bars denote a histogram of data divided into 1 sec bins. Red curve is a Poisson curve with rate = median count rate of data. |
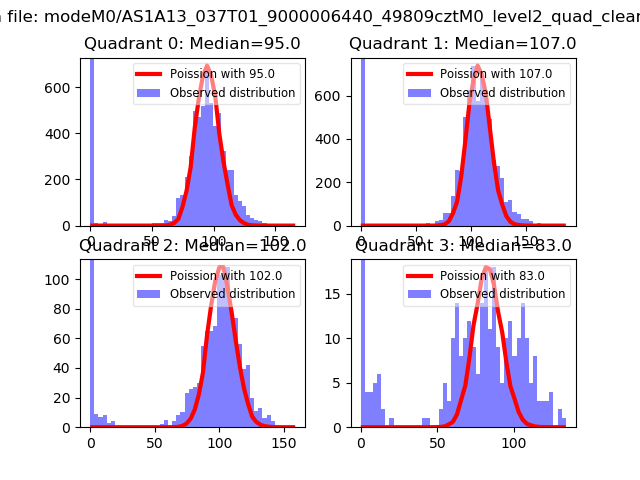 |
 |
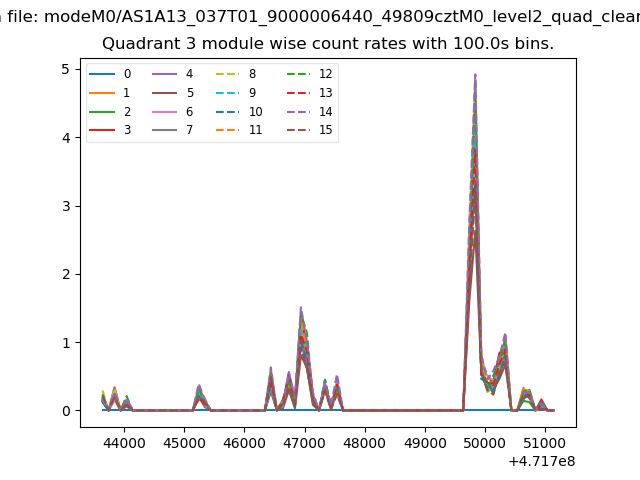
| Quadrant-wise count rates Data is divided into 100 sec bins |
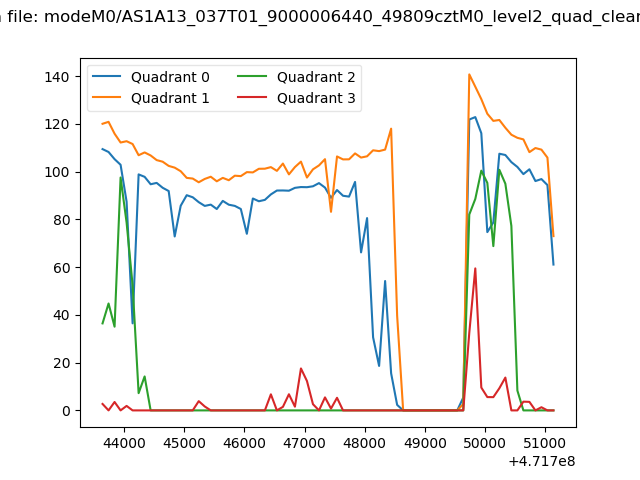 |
|
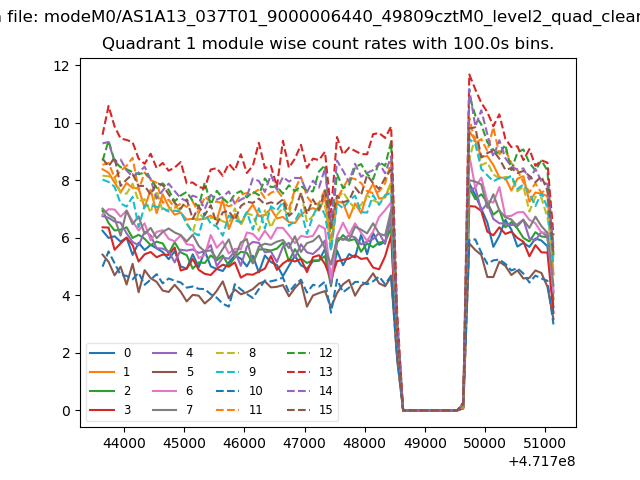
| Module-wise count rates for Quadrant A Data is divided into 100 sec bins |
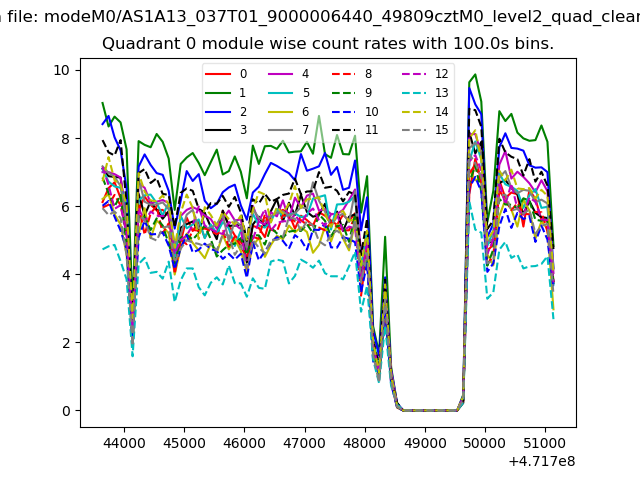 |
 |
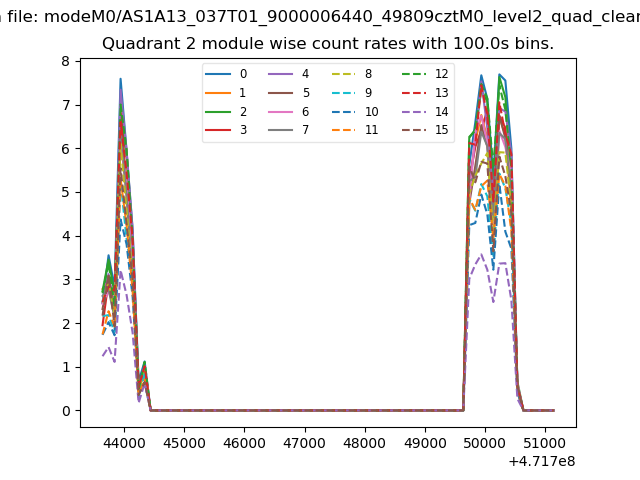
| Module-wise count rates for Quadrant B Data is divided into 100 sec bins |
 |
 |
| Module-wise count rates for Quadrant C Data is divided into 100 sec bins |
 |
 |
| Module-wise count rates for Quadrant D Data is divided into 100 sec bins |
 |
 |
| Parameter | Plot |
|---|---|
| CZT HV Monitor | 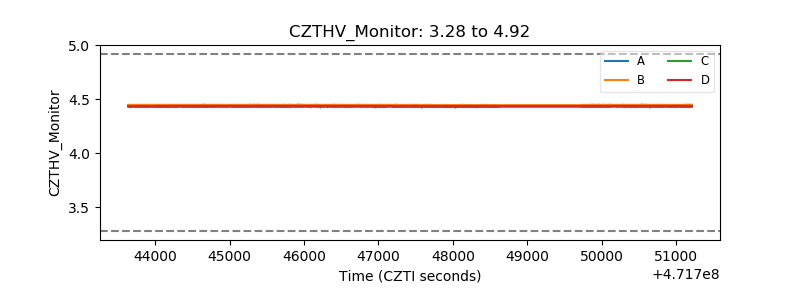 |
| D_VDD | 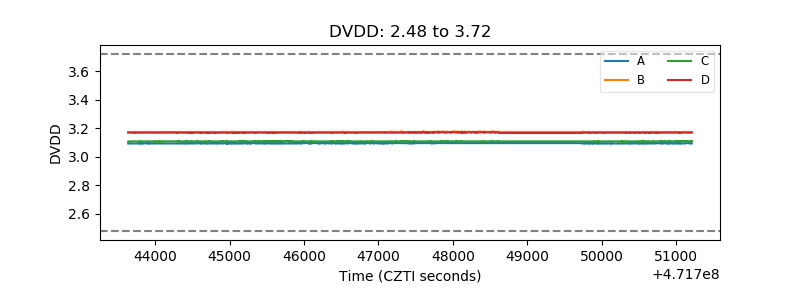 |
| Temperature 1 | 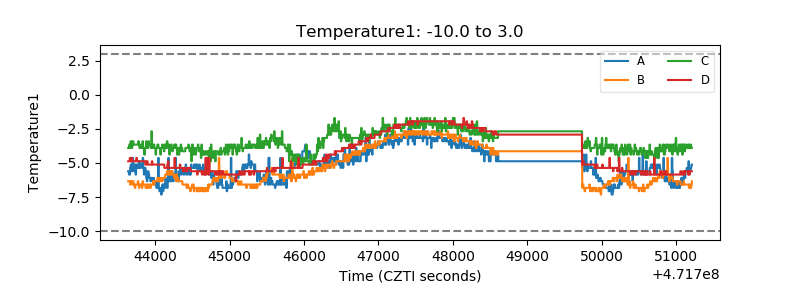 |
| Veto HV Monitor | 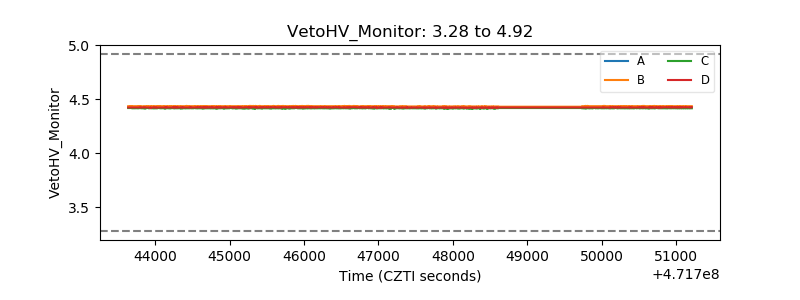 |
| Veto LLD | 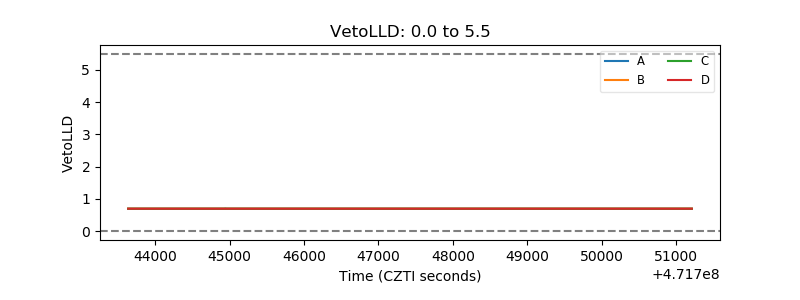 |
| Alpha Counter | 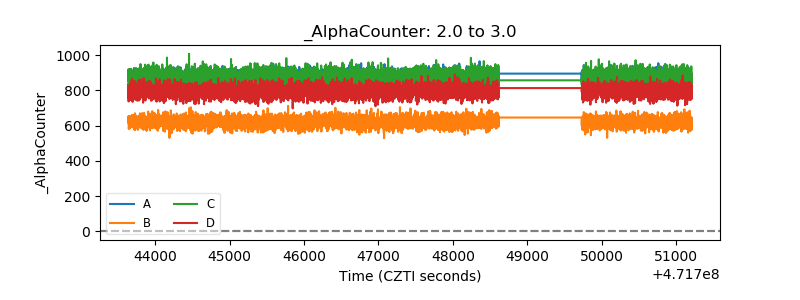 |
| _CPM_Rate | 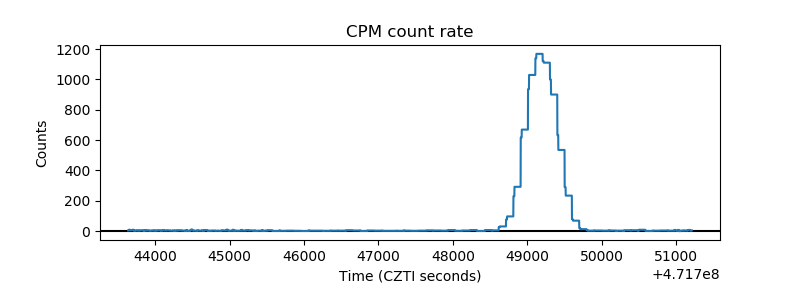 |
| CZT Counter | 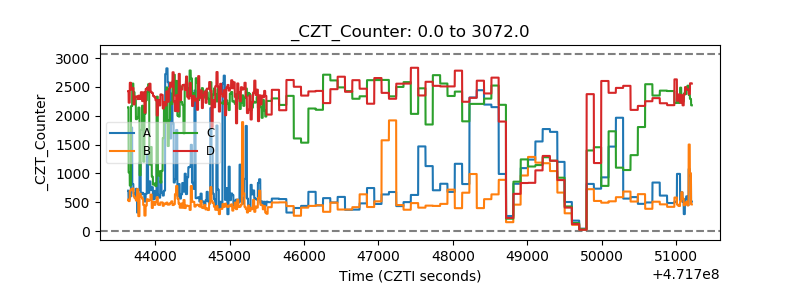 |
| +2.5 Volts monitor | 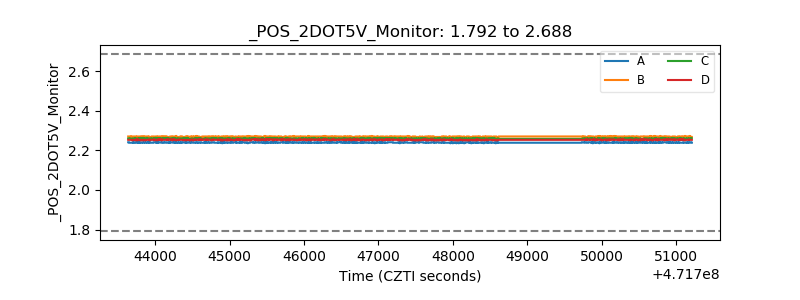 |
| +5 Volts monitor |  |
| _ROLL_ROT | 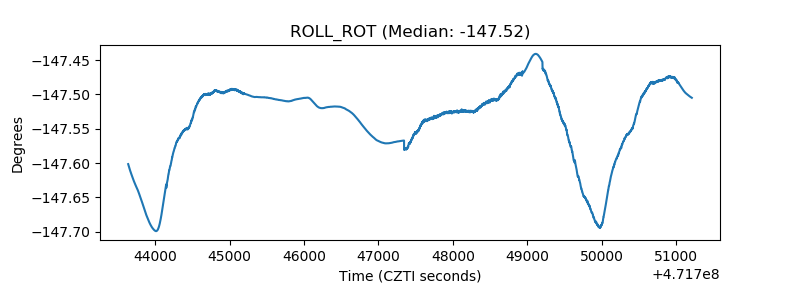 |
| _Roll_DEC | 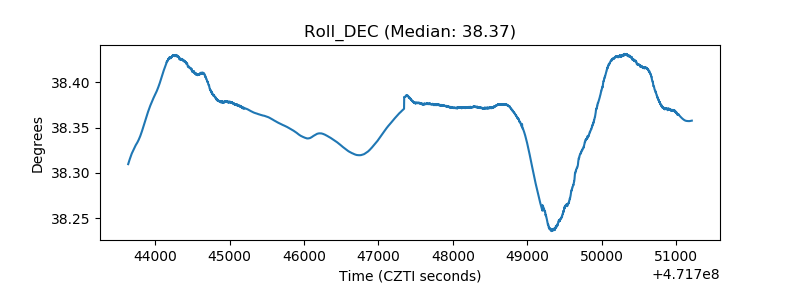 |
| _Roll_RA | 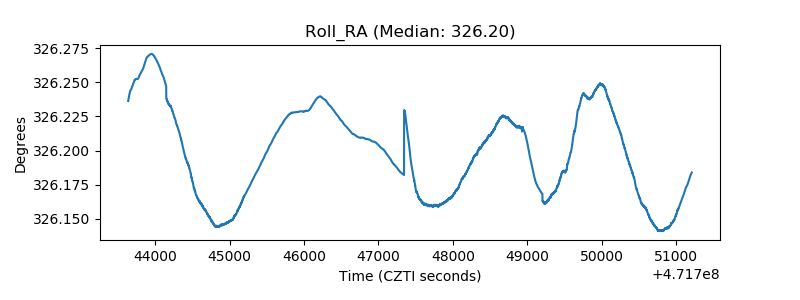 |
| Veto Counter | 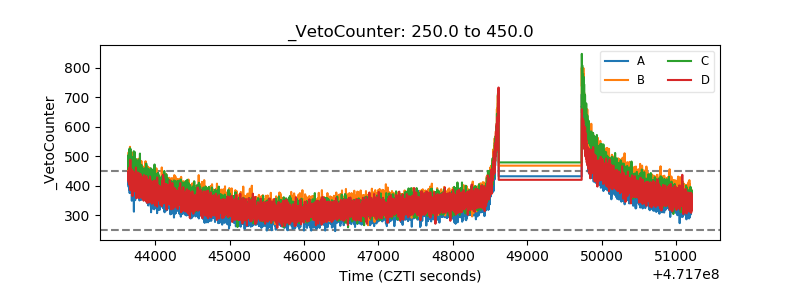 |