| Param | Original file | Final file |
|---|---|---|
| Filename | modeM0/AS1A13_037T01_9000006440_49810cztM0_level2.fits | modeM0/AS1A13_037T01_9000006440_49810cztM0_level2_quad_clean.evt |
| Size (bytes) | 1,065,640,320 | 59,898,240 |
| Size | 1016.3 MB | 57.1 MB |
| Events in quadrant A | 6,596,841 | 536,745 |
| Events in quadrant B | 3,594,083 | 703,462 |
| Events in quadrant C | 13,720,324 | 93,523 |
| Events in quadrant D | 15,040,253 | 33,929 |
| Mode M9 | |||
|---|---|---|---|
| Quadrant | BADHDUFLAG | Total packets | Discarded packets |
| A | 0 | 12 | 0 |
| B | 0 | 12 | 0 |
| C | 0 | 12 | 0 |
| D | 0 | 12 | 0 |
| Mode SS | |||
|---|---|---|---|
| Quadrant | BADHDUFLAG | Total packets | Discarded packets |
| A | 0 | 128 | 0 |
| B | 0 | 128 | 0 |
| C | 0 | 128 | 0 |
| D | 0 | 128 | 0 |
| Mode M0 | |||
|---|---|---|---|
| Quadrant | BADHDUFLAG | Total packets | Discarded packets |
| A | 0 | 23926 | 1 |
| B | 0 | 14903 | 1 |
| C | 0 | 45138 | 1 |
| D | 0 | 48986 | 1 |
| Quadrant | Total seconds | Saturated seconds | Saturation percentage |
|---|---|---|---|
| A | 6395 | 1179 | 18.436278% |
| B | 6396 | 161 | 2.517198% |
| C | 6396 | 5609 | 87.695435% |
| D | 6396 | 6129 | 95.825516% |
Noise dominated data is calculated using 1-second bins in cleaned event files. If a bin has >2000 counts, and if more than 50% of those come from <1% of pixels, then it is considered to be noise-dominated and hence unusable.
| Quadrant | # 1 sec bins | Bins with >0 counts | Bins with >2000 counts | High rate bins dominated by noise | Noise dominated (total time) | Noise dominated (detector-on time) | Marked lightcurve |
|---|---|---|---|---|---|---|---|
| A | 7560 | 6395 | 1049 | 1049 | 13.88% | 16.40% | 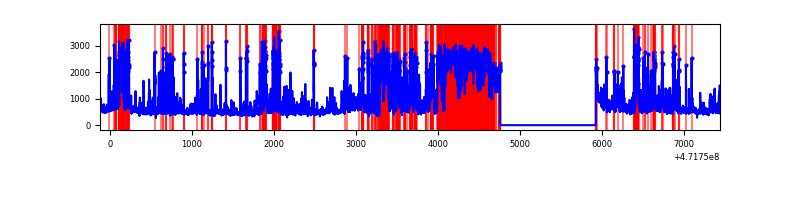 |
| B | 7561 | 6396 | 54 | 54 | 0.71% | 0.84% | 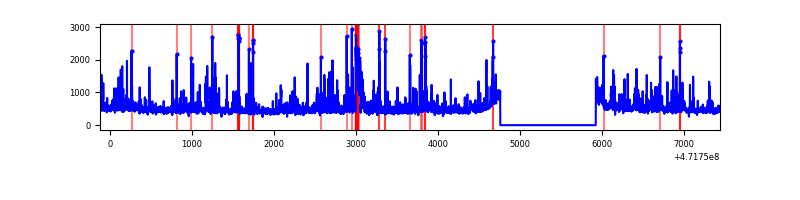 |
| C | 7560 | 6395 | 4826 | 4826 | 63.84% | 75.47% | 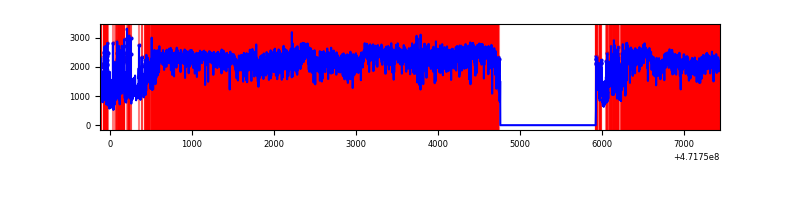 |
| D | 7560 | 6395 | 5769 | 5769 | 76.31% | 90.21% | 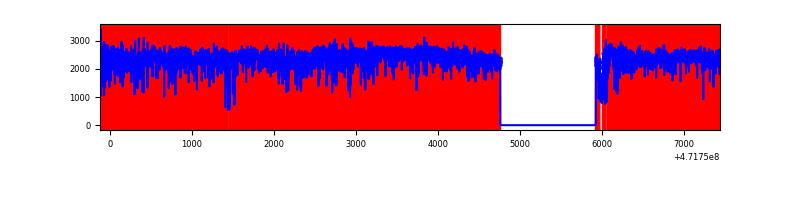 |
Top three noisy pixels from each quadrant. If the there are fewer than three noisy pixels in the level2.evt file, extra rows are filled as -1
| Pixel properties | Quadrant properties | ||||||
|---|---|---|---|---|---|---|---|
| Quadrant | DetID | PixID | Counts | Sigma | Mean | Median | Sigma |
| A | 0 | 98 | 1693927 | 9808.47 | 679 | 665 | 172.6 |
| A | 15 | 63 | 278178 | 1607.53 | 679 | 665 | 172.6 |
| A | 8 | 38 | 277965 | 1606.3 | 679 | 665 | 172.6 |
| B | 4 | 206 | 112019 | 722.09 | 724 | 700 | 154.2 |
| B | 10 | 44 | 107233 | 691.05 | 724 | 700 | 154.2 |
| B | 10 | 28 | 90419 | 581.98 | 724 | 700 | 154.2 |
| C | 15 | 197 | 2975974 | 30988.85 | 323 | 319 | 96.0 |
| C | 15 | 174 | 2661711 | 27716.07 | 323 | 319 | 96.0 |
| C | 15 | 147 | 1921450 | 20006.9 | 323 | 319 | 96.0 |
| D | 7 | 61 | 7057604 | 66547.02 | 323 | 310 | 106.0 |
| D | 15 | 168 | 1248123 | 11766.3 | 323 | 310 | 106.0 |
| D | 7 | 126 | 1054762 | 9943.0 | 323 | 310 | 106.0 |
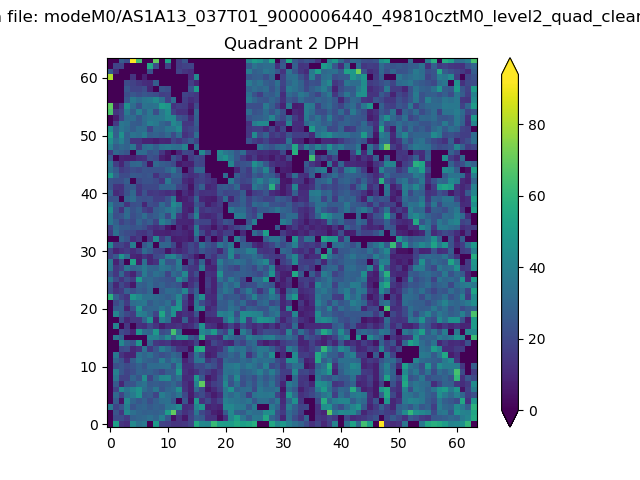
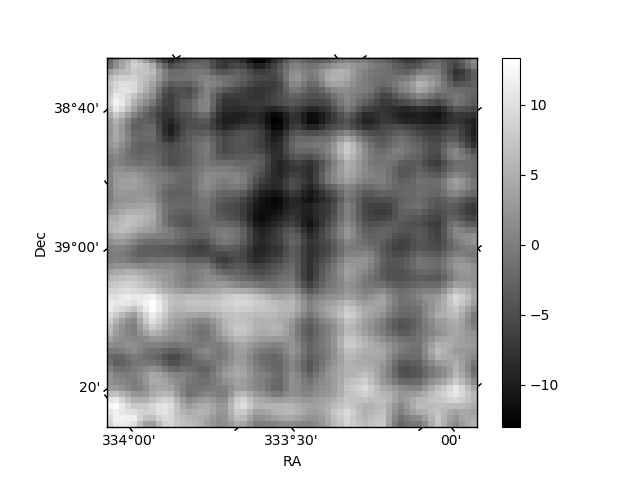
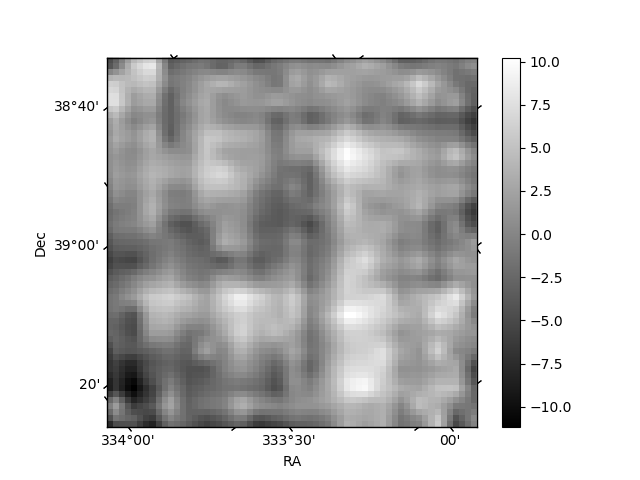
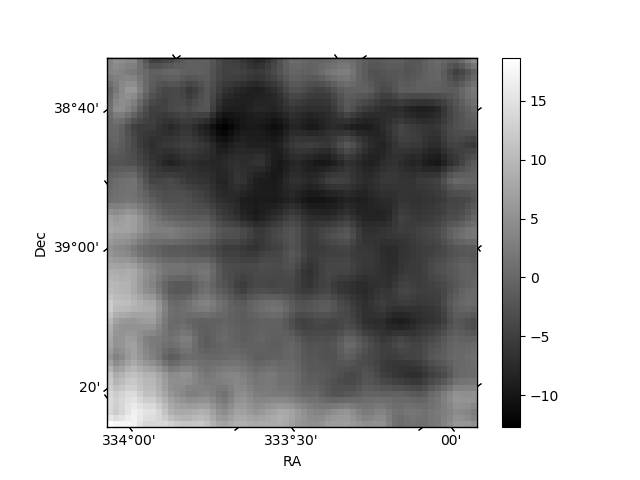
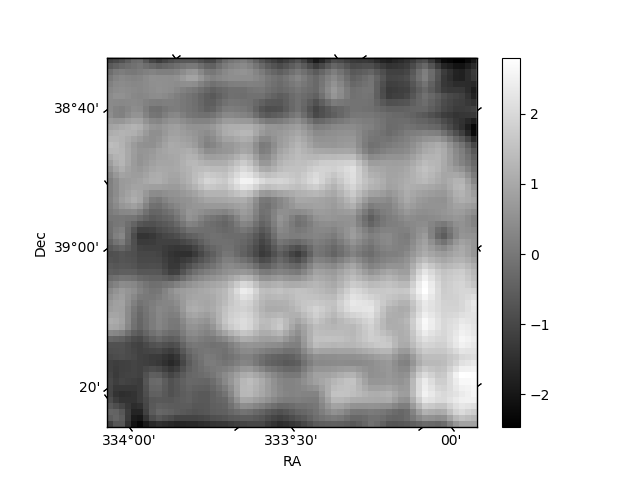
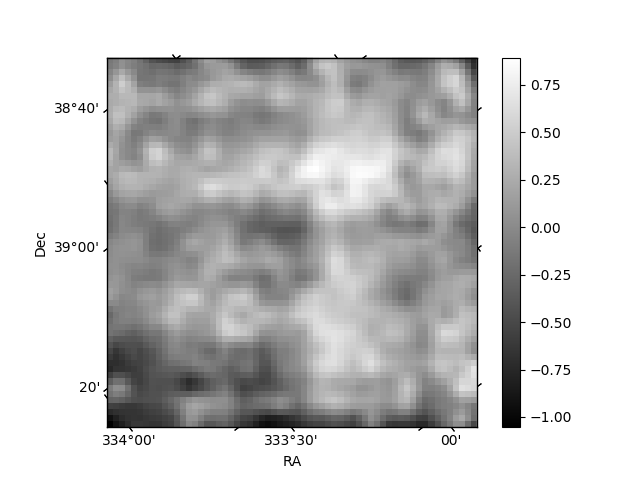
Histogram calculated using DETX and DETY for each event in the final _common_clean file
| Quadrant A | 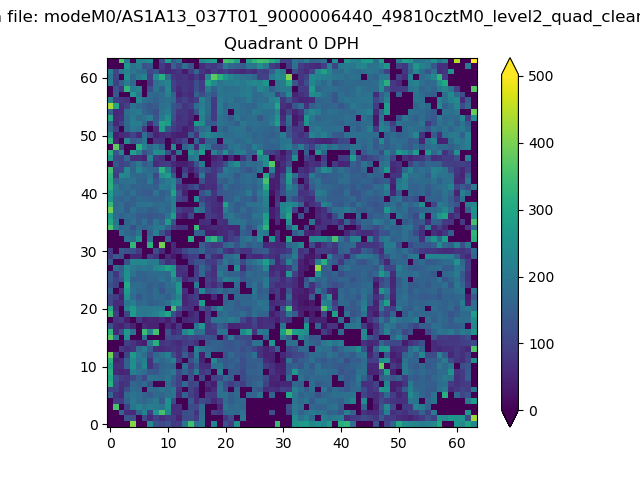 |
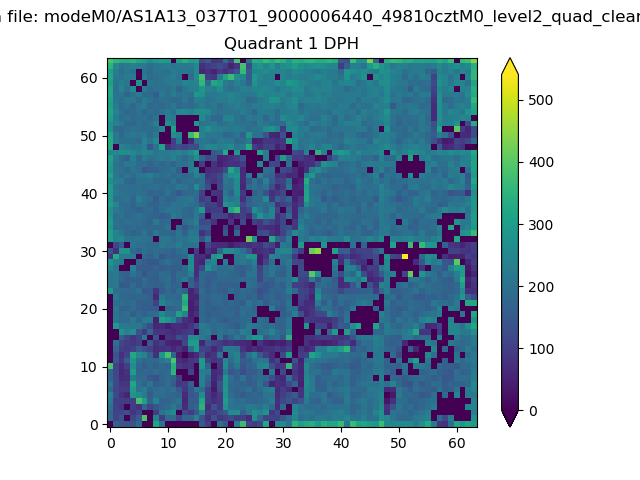 |
Quadrant B |
|---|---|---|---|
| Quadrant D | 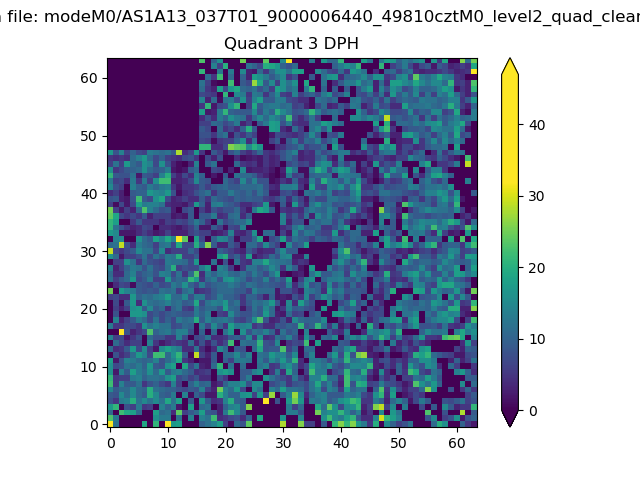 |
 |
Quadrant C |
| Plot type | Count rate plots | Images |
|---|---|---|
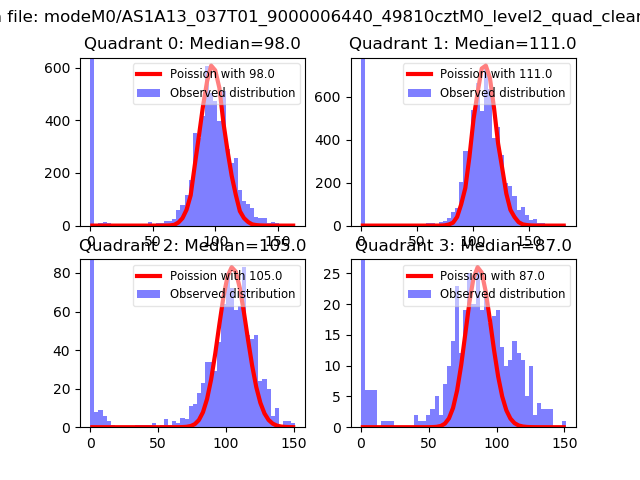
| Comparison with Poisson distribution Blue bars denote a histogram of data divided into 1 sec bins. Red curve is a Poisson curve with rate = median count rate of data. |
 |
 |
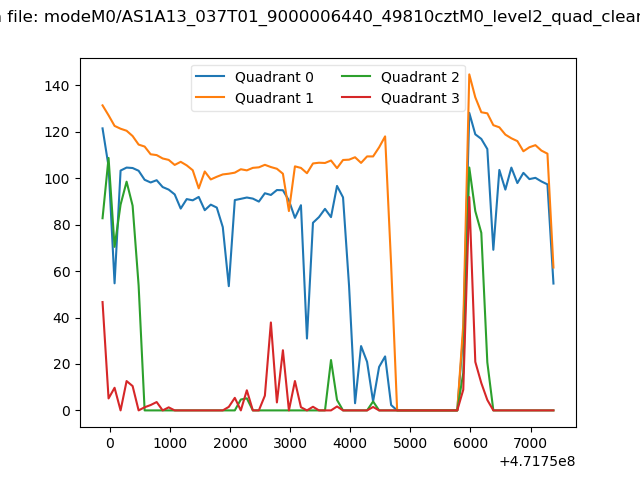
| Quadrant-wise count rates Data is divided into 100 sec bins |
 |
|
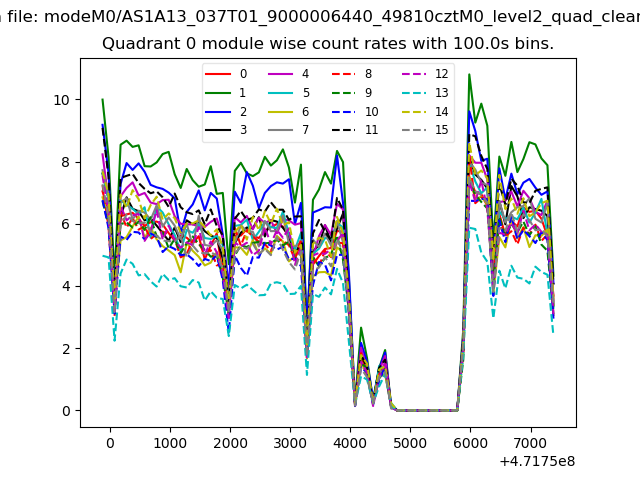
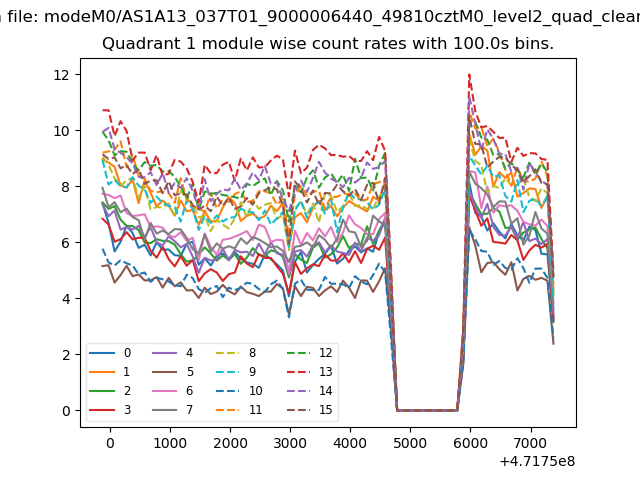
| Module-wise count rates for Quadrant A Data is divided into 100 sec bins |
 |
 |
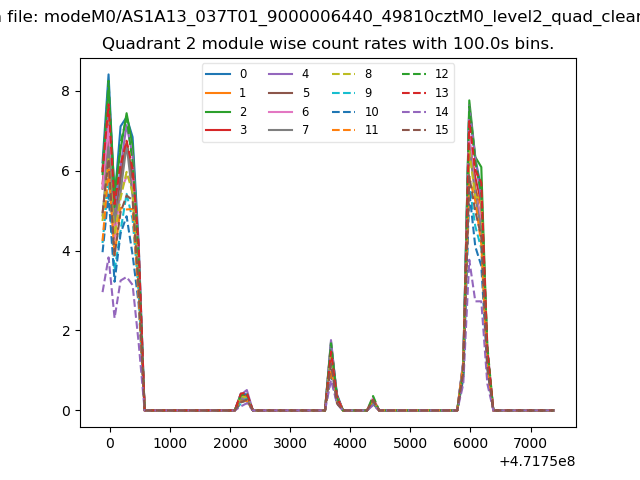
| Module-wise count rates for Quadrant B Data is divided into 100 sec bins |
 |
 |
| Module-wise count rates for Quadrant C Data is divided into 100 sec bins |
 |
 |
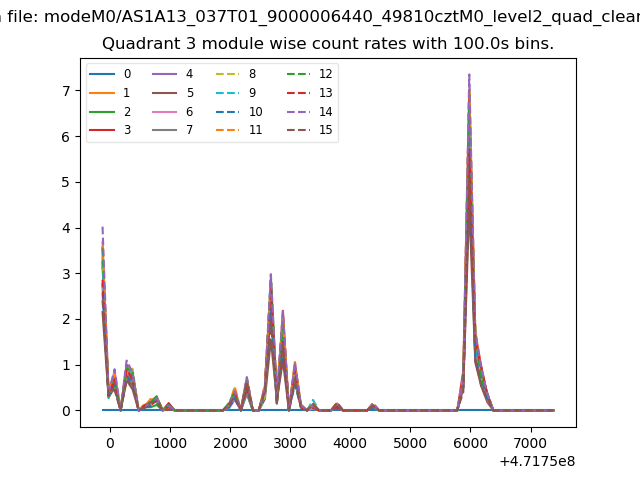
| Module-wise count rates for Quadrant D Data is divided into 100 sec bins |
 |
 |
| Parameter | Plot |
|---|---|
| CZT HV Monitor | 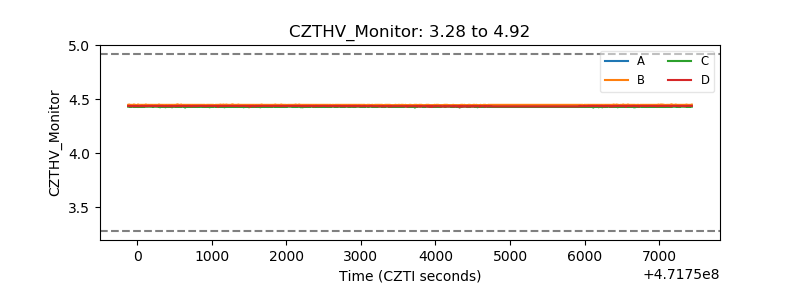 |
| D_VDD | 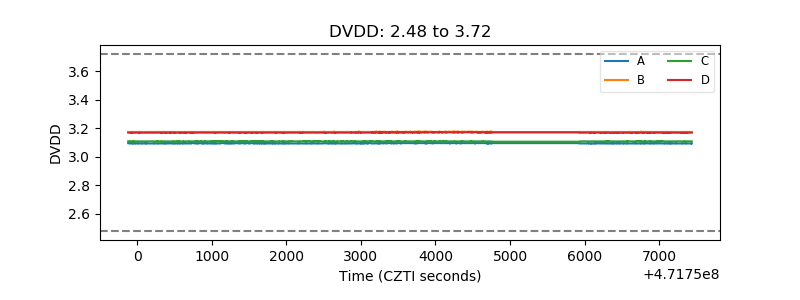 |
| Temperature 1 | 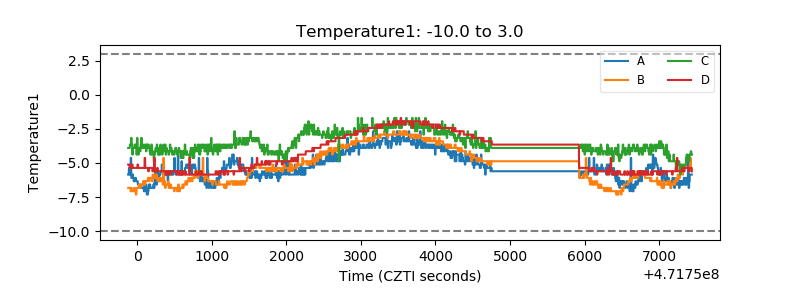 |
| Veto HV Monitor | 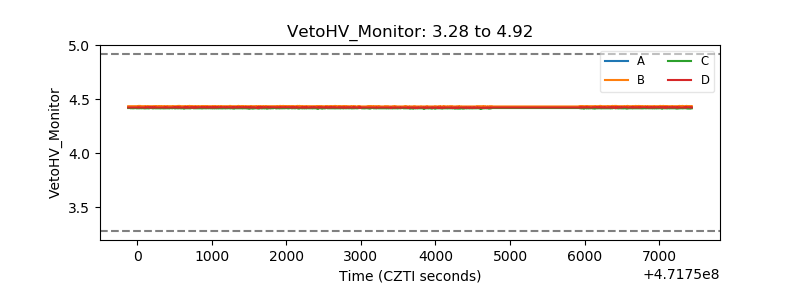 |
| Veto LLD | 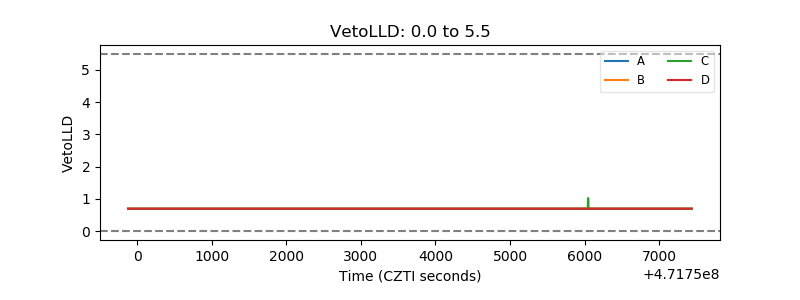 |
| Alpha Counter | 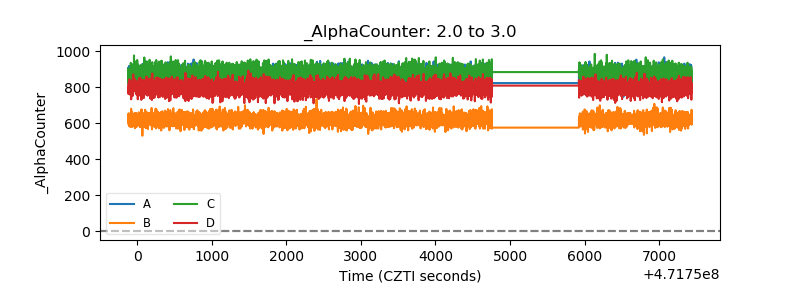 |
| _CPM_Rate | 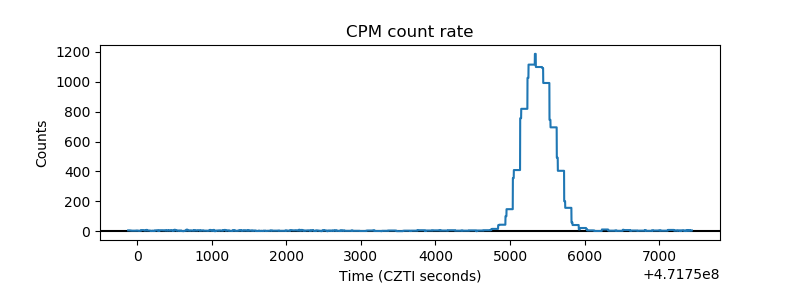 |
| CZT Counter | 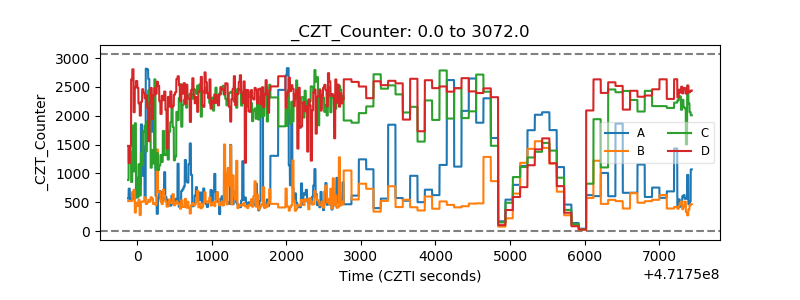 |
| +2.5 Volts monitor |  |
| +5 Volts monitor | 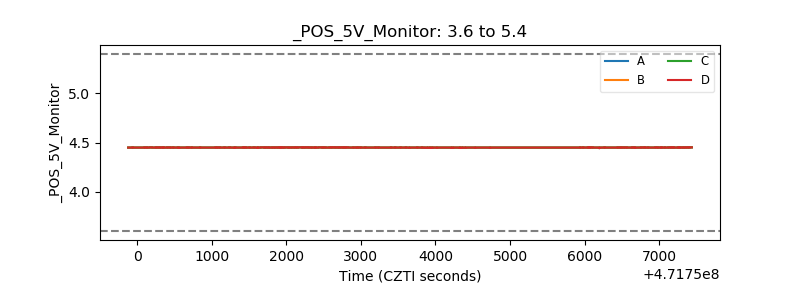 |
| _ROLL_ROT | 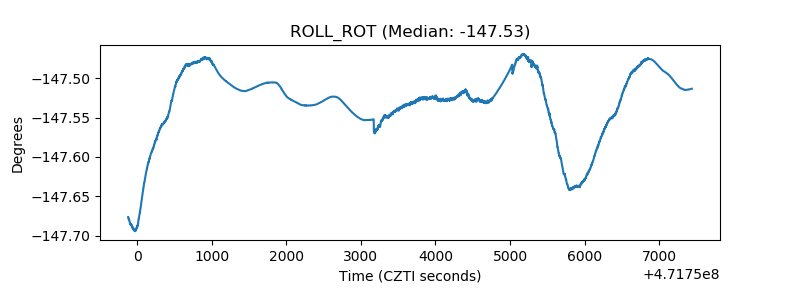 |
| _Roll_DEC | 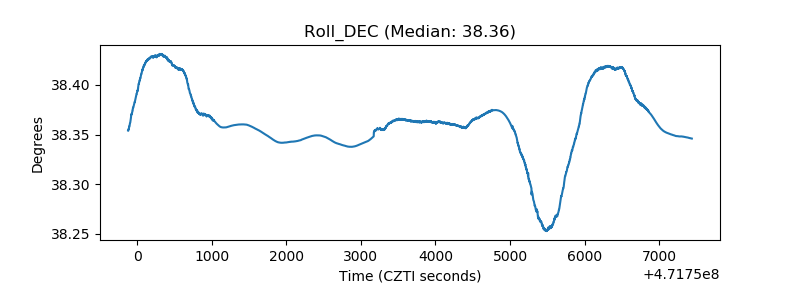 |
| _Roll_RA | 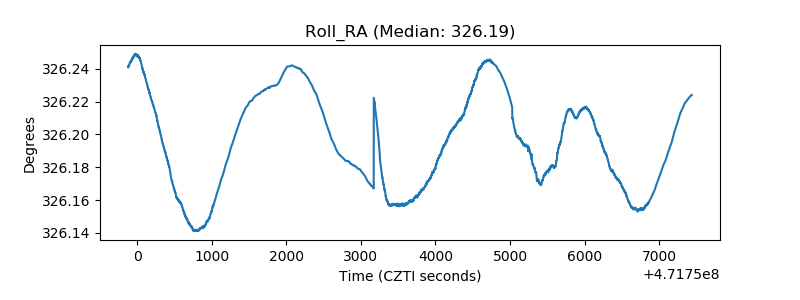 |
| Veto Counter | 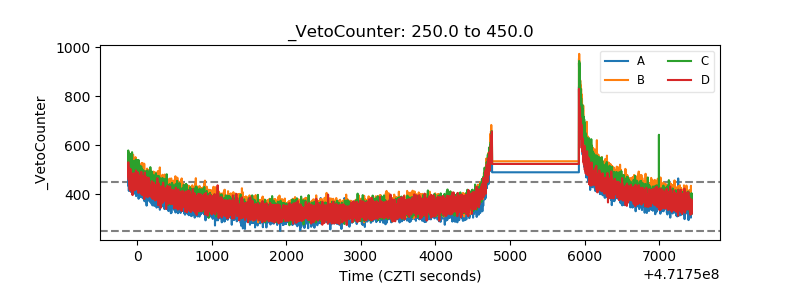 |